AMTD
2, 119–151, 2009Simultaneous, in situ detection of ClNO2
and N2O5
J. P. Kercher et al.
Title Page
Abstract Introduction
Conclusions References
Tables Figures
◭ ◮
◭ ◮
Back Close
Full Screen / Esc
Printer-friendly Version
Interactive Discussion
Atmos. Meas. Tech. Discuss., 2, 119–151, 2009 www.atmos-meas-tech-discuss.net/2/119/2009/ © Author(s) 2009. This work is distributed under the Creative Commons Attribution 3.0 License.
Atmospheric Measurement Techniques Discussions
Atmospheric Measurement Techniques Discussionsis the access reviewed discussion forum ofAtmospheric Measurement Techniques
Chlorine activation by N
2
O
5
:
simultaneous, in situ detection of ClNO
2
and N
2
O
5
by chemical ionization mass
spectrometry
J. P. Kercher1, T. P. Riedel1,2, and J. A. Thornton1 1
Department of Atmospheric Sciences, University of Washington, Seattle, WA 98195, USA
2
Department of Chemistry, University of Washington, Seattle, WA 98195, USA
Received: 2 December 2008 – Accepted: 7 December 2008 – Published: 14 January 2009 Correspondence to: J. A. Thornton ([email protected])
AMTD
2, 119–151, 2009Simultaneous, in situ detection of ClNO2
and N2O5
J. P. Kercher et al.
Title Page
Abstract Introduction
Conclusions References
Tables Figures
◭ ◮
◭ ◮
Back Close
Full Screen / Esc
Printer-friendly Version
Interactive Discussion Abstract
We report a new method for the simultaneous in situ detection of nitryl chloride (ClNO2) and dinitrogen pentoxide (N2O5) using chemical ionization mass spectrometry (CIMS). The technique relies on the formation and detection of iodide ion-molecule clusters, I(ClNO2)− and I(N2O5)−. The novel N2O5detection scheme is direct. It does not suffer 5
from high and variable chemical interferences, which are associated with the typical method of nitrate anion detection. We address the role of water vapor, electric field strength, and instrument zero determinations, which influence the overall sensitivity and detection limit of this method. For both species, the method demonstrates high sensitivity (>1 Hz/pptv), precision (∼10% for 100 pptv in 1 s), and accuracy (∼20%), the 10
latter ultimately determined by the nitrogen dioxide (NO2) cylinder calibration standard and characterization of inlet effects. For the typically low background signals (<10 Hz) and high selectivity, we estimate signal-to-noise (S/N) ratios of 2 for 1 pptv in 60 s averages, but uncertainty associated with the instrumental zero currently leads to an ultimate detection limit of ∼5 pptv for both species. We validate our approach for the 15
simultaneous in situ measurement of ClNO2 and N2O5 while on board the Research Vessel (RV) Knorr as part of the ICEALOT 2008 Field Campaign.
1 Introduction
Human activities of industry, transportation, and agriculture account for∼75% of global nitrogen oxide (NOx≡NO+NO2) emissions, and these emissions are expected to be 20
double the 1990 values in about a decade (van Aardenne et al., 1999; Yienger, 1999). NOx plays a fundamental role in the troposphere’s oxidizing capacity by regu-lating photochemical ozone production rates, and by partly controlling hydrogen oxide (HOx≡OH+HO2) and halogen oxide radical cycles (Logan, 1981). The regional and global scale impacts of anthropogenic NOx emissions ultimately depend on its atmo-25
AMTD
2, 119–151, 2009Simultaneous, in situ detection of ClNO2
and N2O5
J. P. Kercher et al.
Title Page
Abstract Introduction
Conclusions References
Tables Figures
◭ ◮
◭ ◮
Back Close
Full Screen / Esc
Printer-friendly Version
Interactive Discussion
daytime,
NO2+OH+M→HNO3M (R1)
and by homogeneous and heterogeneous reactions of the nitrate radical (NO3) and dinitrogen pentoxide (N2O5) at night (R2–R7).
NO2+O3→NO3+O2 (R2)
5
NO2+NO3⇄N2O5 (R3)
NO3+VOC→products (R4)
NO3+particles→products (R5)
N2O5+particles H2O
−→2HNO3 (R6)
N2O5+particles H+,Cl−aq
−→ ClNO2+HNO3 (R7)
10
Nocturnal processing of NO3 and N2O5 has been estimated to remove approxi-mately half of NOx, globally, and is a significant loss process for total odd-oxygen (Ox≡O3+NO2) (Brown et al., 2006; Dentener and Crutzen, 1993; Evans and Jacob, 2005). The chemistry involves reactions of NO3with a suite of diverse volatile organic compounds (VOC), and heterogeneous reactions of both NO3 and N2O5with aerosol 15
particles (Atkinson, 2000; Jacob, 2000; Mentel et al., 1996; Noxon et al., 1980; Platt and Heintz, 1994; Wayne et al., 1991). The branching between various pathways is strongly dependent on temperature, NOx, hydrocarbons, particle composition, and ver-tical mixing (Ayers and Simpson, 2006; Brown et al., 2007; Stutz et al., 2004); as such, several aspects of this chemistry remain uncertain.
20
AMTD
2, 119–151, 2009Simultaneous, in situ detection of ClNO2
and N2O5
J. P. Kercher et al.
Title Page
Abstract Introduction
Conclusions References
Tables Figures
◭ ◮
◭ ◮
Back Close
Full Screen / Esc
Printer-friendly Version
Interactive Discussion
2005). The relative branching between Reactions (R6) and (R7) for use in atmospheric chemistry models has essentially remained unconstrained due to a lack of in situ ob-servations of ClNO2. ClNO2 is fairly unreactive at night such that given sustained production via (R7), its concentration can increase throughout nighttime. A recent the-oretical study predicted ClNO2 mixing ratios of up to 50 parts per trillion by volume 5
(pptv) in polluted regions (e.g. the Long Island Sound) (Pechtl and von Glasow, 2007). During the daytime, ClNO2 undergoes photolysis by UV-VIS radiation to generate chlorine atoms and NO2 with a clear-sky lifetime of order 30–60 min depending on season and location.
ClNO2+hν→Cl+NO2 (R8)
10
The importance of the reaction sequence (R7)–(R8) is two-fold. First, in a NOx-laden air mass, the photodissociation of ClNO2can initiate photochemical ozone production earlier than would otherwise occur, ultimately increasing the integral amount of ozone produced. This effect is due to the fact that reaction R8 goes to completion within an hour or two after sunrise, liberating chlorine atoms which react with hydrocarbons up 15
to 10–100 times faster than does the hydroxyl radical (OH). While Cl-atoms have not been directly observed, labile sources in addition to ClNO2, such as Cl2, have been observed (Spicer et al., 1998). Regionally averaged Cl abundances have been inferred from observational analyses of hydrocarbons (Arsene et al., 2007; Cavender et al., 2008), but due to the limited spatial and temporal coverage of such measurements, the 20
global Cl-atom source term remains largely unconstrained (Platt et al., 2004). Second, since ClNO2 is not a terminal NOx sink, production via N2O5 heterogeneous reaction represents a reduction, by as much as 50%, in the amount of NOxremoved during night by NO3 and N2O5 chemistry, effectively enhancing the NOx-lifetime because reaction R8 ultimately returns one NOx.
25
AMTD
2, 119–151, 2009Simultaneous, in situ detection of ClNO2
and N2O5
J. P. Kercher et al.
Title Page
Abstract Introduction
Conclusions References
Tables Figures
◭ ◮
◭ ◮
Back Close
Full Screen / Esc
Printer-friendly Version
Interactive Discussion
assumption that NO3, NO2 and N2O5 are related by the equilibrium shown in (R3) (Heintz et al., 1996; Smith et al., 1995; Stutz et al., 2004). Recently, multiple groups have demonstrated a difference method for in situ N2O5 observations, where N2O5 is thermally decomposed to NO3, which is then detected by cavity ring-down spec-troscopy (CaRDS) or laser-induced fluorescence (Geyer et al., 1999; Simpson, 2003; 5
Wood et al., 2003). The contribution of ambient NO3, which is generally small, is sub-tracted from the total signal measured after N2O5thermal decomposition. The sum of N2O5 and NO3can also be measured as the nitrate anion, NO−3, by chemical ioniza-tion mass spectrometry (CIMS) using the iodide reagent ion (I−). Indeed, this particular CIMS approach has been employed in numerous laboratory studies (Huey et al., 1995; 10
Thornton et al., 2003) and has been demonstrated as a potential in situ method for N2O5detection (Huey, 2007; Slusher et al., 2004).
Recently, we showed that ClNO2could be sensitively and selectively detected by I− CIMS (McNeill et al., 2006), leading to the first in situ detection of ClNO2in the polluted Gulf of Mexico (Osthoff et al., 2008). Here, we describe this technique further, and 15
demonstrate a new method that allows the detection of both N2O5 and ClNO2 at pptv mixing ratios using the same instrument. We illustrate the instrument’s performance during the initial phase of the International Chemistry Experiment in the Arctic Lower Troposphere (ICEALOT), a recent ship-based research cruise that took place March– April 2008. The unique aspects of this method include a combination of high sensi-20
tivity (∼1 Hz pptv−1), low background noise (<10 Hz), and chemical selectivity for both ClNO2 and N2O5. The N2O5 measurement is direct, i.e. the signal does not include contributions from NO3, and it does not suffer from high and variable chemical interfer-ences which affect the NO−3-based detection method. Essentially, the method provides the ability to simultaneously monitor both the reactant (N2O5) and product (ClNO2) of 25
AMTD
2, 119–151, 2009Simultaneous, in situ detection of ClNO2
and N2O5
J. P. Kercher et al.
Title Page
Abstract Introduction
Conclusions References
Tables Figures
◭ ◮
◭ ◮
Back Close
Full Screen / Esc
Printer-friendly Version
Interactive Discussion 2 Instrument description
The University of Washington chemical ionization mass spectrometer (UW-CIMS), has previously been described (Wolfe et al., 2007), and is similar in concept to other field-deployable CIMS instruments (Slusher et al., 2004; Veres et al., 2008). In this section, we briefly discuss the major components and operation of the UW-CIMS with special 5
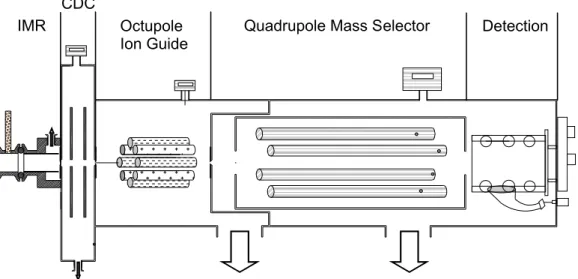
attention paid to features allowing for detection of N2O5 and ClNO2. A schematic of the UW-CIMS illustrating the four major components is shown in Fig. 1. These regions are: 1) ion-molecule reaction region, 2) collisional dissociation chamber, 3) octupole ion guide, 4) quadrupole mass spectrometer and electron multiplier.
2.1 Ion Molecule Reaction Region (IMR) 10
Ambient air, sampled by a rotary vane pump, passes through a critical orifice into a 4 cm OD electrically isolated stainless steel flow tube that serves as the IMR region. The orifice and vacuum pump maintain a constant volumetric flow rate of 2 standard liters per minute (slpm) through the sampling orifice, and a pressure of 60 torr. A commercial 210
Po radioactive ion source (alpha-emitter, 10 mCu), oriented perpendicular to the 15
main sample flow axis, is located along the reaction flow tube∼1 cm downstream of the sampling orifice. Iodide anions (I−) are introduced to the sample stream by passing a 2.5 slpm flow of ultra high purity (UHP) N2 that contains a trace amount of methyl iodide (CH3I) through the
210
Po ion source. Neutral molecules in air react with iodide anions for∼70 ms before exiting the IMR region.
20
2.2 Collisional Dissociation Chamber (CDC)
AMTD
2, 119–151, 2009Simultaneous, in situ detection of ClNO2
and N2O5
J. P. Kercher et al.
Title Page
Abstract Introduction
Conclusions References
Tables Figures
◭ ◮
◭ ◮
Back Close
Full Screen / Esc
Printer-friendly Version
Interactive Discussion
a series of 4 static lenses. The lenses are 2 mm thick, 4 cm OD, 1 cm ID, stainless steel discs that are spaced 6 mm from each other, and from the two orifice plates, which serve as the entrance and exit to/from the CDC. The front pair of lenses are biased to −45 V and the rear pair are biased to −25 V. The third orifice plate, which separates the CDC from the high vacuum chamber, is biased to−5.1 V to create a net 5
electric field of−20 V/cm at 1.5 torr. This field strength is less than that typically used by our group and others to detect acyl peroxy nitrates by I− CIMS (Wolfe et al., 2007). As discussed below, this lower field strength allows for the simultaneous detection of N2O5and ClNO2.
2.3 Octupole ion guide 10
Ions are focused through the CDC orifice plate into the fore chamber of a differentially pumped stainless steel high vacuum region. The fore chamber, pumped by a 250 lps turbomolecular pump, is maintained at 3 mtorr. Ions are focused into a narrow beam and transmitted into the quadrupole region by a custom RF-only octupole ion guide. The 4 cm long, 2 cm OD octupole ion guide, based on the designs of Tanner et al. at 15
Georgia Tech (Tanner, D. J., personal communication), is driven by a compact RF-only power supply (2.2 MHz, 220 V p-p) designed at the University of Washington. The oc-tupole is mounted on a fourth, and final orifice plate, which drops the pressure from 3 mtorr to 2×10⁻⁵torr by means of a second 250 lps turbomolecular pump. The ion beam is focused through the orifice into the quadrupole mass selector. The two tur-20
bomolecular pumps are backed by molecular drag pumps, in turn backed by the same rotary vane pump which maintains the IMR region pressure and flows.
2.4 Quadrupole Mass Selection (QMS) and detection
Ions transmitted through the final orifice are mass selected using a quadrupole mass selector (QMS) from Extrel Inc. housed in a high vacuum region held at 2×10⁻⁵torr. 25
AMTD
2, 119–151, 2009Simultaneous, in situ detection of ClNO2
and N2O5
J. P. Kercher et al.
Title Page
Abstract Introduction
Conclusions References
Tables Figures
◭ ◮
◭ ◮
Back Close
Full Screen / Esc
Printer-friendly Version
Interactive Discussion
driven by a 300 W, 1.2 MHz RF/DC power supply. The quadrupole rods are housed in a perforated stainless steel tube capped with entrance and exit lenses, and are followed by an off-axis electron multiplier detector with dynode from Extrel Inc. An MTS-100 preamp is used to convert the output pulses of the multiplier into TTL. The multiplier, preamp, and ion optics, including orifice plates and CDC lenses, are powered or biased 5
using pre-packaged Extrel Inc. power supplies.
2.5 Instrument control and data acquisition
Diagnostics monitoring and instrument control are handled via a 32-bit, 32 kHz analog-to-digital converter controlled by custom LabVIEW software on a custom rack-mounted PC. Typically, 4–20 individual mass-to-charge (m/z) ratios are monitored continuously 10
while sampling ambient air. The signal at an m/z is determined by sending a mass command voltage to the RF/DC quadrupole power supply, counting the TTL preamp output for a set period per m/z, typically 80–250 ms, then moving to the next m/z. Depending on the number of individualm/z to monitor, this scheme leads to sampling frequencies ranging from 0.2 to 3 Hz perm/z.
15
3 Ion chemistry
Neglecting the role of water vapor in the ion-molecule reaction region, the ion chemistry for the detection of both N2O5and ClNO2proceeds through two channels: dissociative charge transfer (R9 and R12) and cluster formation (R11 and R13). With the excep-tion of reacexcep-tion R11, the reacexcep-tion channels described below have been demonstrated 20
and used previously, primarily for laboratory studies (Huey, 2007; McNeill et al., 2006; Thornton et al., 2003).
I−+N2O5→NO−3 +INO2 (R9)
AMTD
2, 119–151, 2009Simultaneous, in situ detection of ClNO2
and N2O5
J. P. Kercher et al.
Title Page
Abstract Introduction
Conclusions References
Tables Figures
◭ ◮
◭ ◮
Back Close
Full Screen / Esc
Printer-friendly Version
Interactive Discussion
I−+N2O5→I (N2O5)− (R11)
I−+ClNO2→ICl−+INO2 (R12)
I−+ClNO2→I (ClNO2)− (R13)
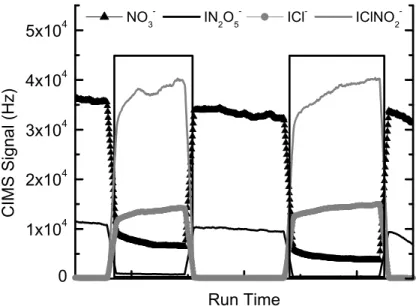
Figure 2 shows a sample ion time trace obtained in the laboratory for the four prod-ucts discussed above, under sampling conditions which have been optimized for the 5
detection of the cluster anions. Initially, N2O5 (750 pptv) in a 2.5 slpm flow of dry N2 was sampled directly into the UW-CIMS. The NO−3 and I(N2O5)− anions are observed in a 3:1 ratio. The boxed regions highlight the times when the N2O5flow passed over a wet sodium chloride (NaCl) salt bed prior to sampling by the UW-CIMS. In addition to NO−3 and I(N2O5)−, ICl− and I(ClNO2)− are observed during these times, with the 10
cluster anion representing 80% of the total nitryl chloride signal. The factors governing the observed branching between reactive charge transfer and cluster formation for both ClNO2and N2O5are discussed below.
4 Sensitivity and selectivity
4.1 Calibrations 15
The true instrument sensitivity is a function of conditions both internal and external to the CIMS instrument. For example, ion transmission efficiency is affected on the short term, of minutes-hours, by temperature-dependent drifts in power supply outputs which affect static and RF potentials; and on the long term, as electron multipliers lose gain and detection efficiency decreases over the course of months to years. Air mass 20
AMTD
2, 119–151, 2009Simultaneous, in situ detection of ClNO2
and N2O5
J. P. Kercher et al.
Title Page
Abstract Introduction
Conclusions References
Tables Figures
◭ ◮
◭ ◮
Back Close
Full Screen / Esc
Printer-friendly Version
Interactive Discussion
pptv (Hz/pptv) of N2O5or ClNO2sampled, that is then interpolated onto the measure-ment time base and used to convert instantaneous count rates into absolute mixing ratios.
Well-quantified, highly reproducible, and commercially available sources of N2O5 and ClNO2do not exist. We use a combination of generation and quantification meth-5
ods to develop confidence in the calibration sources we apply in the field. During ICEALOT 2008, N2O5was delivered to the sampling inlet for calibration purposes, one to two times per day, by passing a small flow of N2over pure, solid N2O5maintained at
−75◦C. Two types of additions were performed: one while overflowing the inlet with dry zero air, and one by adding the N2O5directly to moist ambient air. The NOAA CaRDS 10
instrument, sampling from the same inlet manifold as the UW-CIMS, used these addi-tions primarily to assess inlet transmission. For the purpose of this campaign, a goal of which was to test our N2O5 detection capability, we relied on the NOAA CaRDS instrument to determine the N2O5 concentration being delivered to the UW-CIMS inlet during these calibrations. We then used this known N2O5 concentration, typically a 15
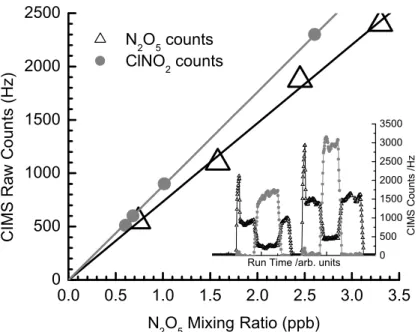
single value between 1–5 ppbv, to generate a Cf for the UW-CIMS based on the ob-served signal at the I(N2O5)−m/z. Figure 3 shows the resulting plots of signal (Hz) versus N2O5 mixing ratio sampled in relatively dry air (RH∼20%). The slope of linear least squares fit to the data yield a calibration factor of 0.75 Hz/pptv. An example of a calibration performed during the deployment is shown and discussed in the section on 20
field performance.
The difficulty with using the equilibrium vapor pressure over solid N2O5 as a CIMS calibration source is that the N2O5 solid is subject to contamination, which results in unknown changes in the vapor pressure on a weekly, if not daily timescale. Without an absolute calibration, such as the known NO3absorption cross-section available to 25
AMTD
2, 119–151, 2009Simultaneous, in situ detection of ClNO2
and N2O5
J. P. Kercher et al.
Title Page
Abstract Introduction
Conclusions References
Tables Figures
◭ ◮
◭ ◮
Back Close
Full Screen / Esc
Printer-friendly Version
Interactive Discussion
which is not ideal for long field deployments.
Our preferred method for independent calibration of the UW-CIMS to N2O5in future field deployments is to deliver the output from a custom PFA-Teflon flow reactor in which N2O5is continuously produced from the well known reaction of NO2with O3, i.e. Reactions (R2)–(R3). The N2O5source is described in detail elsewhere (Bertram et al., 5
2009). Briefly, the reaction is performed under excess NO2delivered at 2–10 standard cubic cm per minute (sccm) from a NIST-traceable cylinder of 10 ppm NO2in a balance of N2through a stainless steel mesh to scrub HNO3prior to entry into the flow reactor. The NO2mixing ratio in the reactor volume is typically of order 1 ppm. O3mixing ratios of 150–200 ppbv are generated by passing 50 sccm of UHP zero air through a custom 10
stainless steel chamber illuminated by a Hg pen-ray lamp. The ozone and NO2 mix and react for 2 min prior to dilution into the sample flow. After a 20:1 dilution, the mixing ratio of N2O5is between 1 and 10 ppbv, depending on the NO2flow. Based on recent laboratory and field tests, the output is constant to within 5% over several hours of continuous operation and accurate to within 20% (see more details below).
15
We calibrate to ClNO2 by passing a dry N2 flow containing a known mixing ratio of N2O5 over a wet NaCl bed, which is dispersed along the inner walls of a 20 cm length of 13 mm OD tubing. The mixing ratio of ClNO2 eluting from the salt bed is calculated from the observed amount of N2O5lost when passing through the salt bed and the known ClNO2yield (100%) from the reaction of N2O5on NaCl (Behnke et al., 20
1997; Finlayson-Pitts et al., 1989; McNeill et al., 2006). The inset of Fig. 3 shows the I(ClNO2)− signal in response to passing 1.0 and 1.5 ppbv N2O5 in ambient air (RH∼20%) over a wet NaCl bed. The resulting binned signal is plotted versus the calculated ClNO2 concentration. The slope yields 0.9 Hz/pptv for a calibration factor under relatively dry sampling conditions.
25
4.2 Factors affecting sensitivity
AMTD
2, 119–151, 2009Simultaneous, in situ detection of ClNO2
and N2O5
J. P. Kercher et al.
Title Page
Abstract Introduction
Conclusions References
Tables Figures
◭ ◮
◭ ◮
Back Close
Full Screen / Esc
Printer-friendly Version
Interactive Discussion
detection efficiencies. Ideally, the product ion formation rate is maximized by using high densities of a reagent ion which reacts at the collision limit with the analyte of interest to produce detectable count rates (Hz) of a unique product ion in a short interaction time. A short interaction time ensures a small extent of reaction and thus that the product ion abundance remains linearly proportional to the analyte concentration. For a more 5
complete discussion of these issues, we refer the reader elsewhere (Harrison, 1983). Here, we focus on two factors which affect the sensitivity of our I− CIMS to ClNO2and N2O5 via the iodide cluster channels (R11 and R13): water vapor mediated cluster formation and collisional dissociation in the CDC.
In sampling humid ambient air, iodide ions form clusters containing one or more wa-10
ter molecules, as do many of the analyte ions produced during the chemical ionization process. The formation of such complexes can enhance sensitivity by stabilizing reac-tive complexes, or, as is more often the case, such complexes can degrade sensitivity by reducing the reactivity of the reagent ion and/or by distributing the analyte ion of interest among severalm/z thus decreasing the signal-to-noise (S/N). For this latter 15
reason, a number of CIMS instruments employ a CDC to increase the S/N, by col-lapsing the analyte ion water cluster distribution into a singlem/z representative of the parent ion mass. We illustrate below that both aspects are important.
4.2.1 Water vapor mediated cluster formation
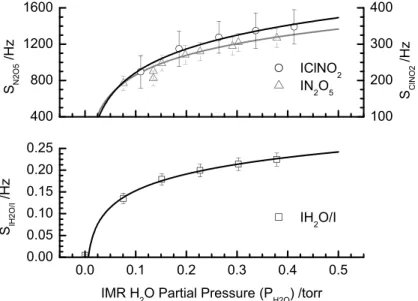
Figure 4 shows the water vapor dependence of the I(ClNO2)− and I(N2O5)− signals. 20
To obtain this data, a constant mixing ratio of N2O5 and ClNO2 were delivered to the UW-CIMS inlet as described below, while a humidified flow of N2was delivered directly to the IMR region via a separate length of tubing and orifice so that the results were not affected by humidity-dependent losses of N2O5 on the inlet tubing walls. The ex-periments were conducted with a typical CDC electric field strength of−40 V/cm (at 25
AMTD
2, 119–151, 2009Simultaneous, in situ detection of ClNO2
and N2O5
J. P. Kercher et al.
Title Page
Abstract Introduction
Conclusions References
Tables Figures
◭ ◮
◭ ◮
Back Close
Full Screen / Esc
Printer-friendly Version
Interactive Discussion
0.3 torr water vapor pressure,PH2O, in the IMR region. Due to the moist salt bed used to produce ClNO2, we were unable to achieve PH2O<0.1 torr in the IMR. Clearly, the formation of the N2O5 and ClNO2 clusters is facilitated by water vapor implying that the I(H2O)− cluster likely becomes an important additional reagent ion for production of I(ClNO2)−and I(N2O5)−
5
I(H2O)−+N2O5→I (N2O5)−+H2O (R14) I(H2O)−+ClNO2→I (ClNO2)−+H2O (R15) The behavior observed here for the N2O5 and ClNO2 iodide clusters is remarkably similar to that exhibited by acyl peroxy radicals (Slusher et al., 2004). Under minimal declustering, i.e.E <−5 V/cm in the CDC, the ratio of I− to I(H2O)− signals is approx-10
imately 1:1 to 1:2. Higher order water clusters, such as I(H2O)−2 and I(H2O)−3, are detected, but are less than 25% and 10%, respectively, of the I(H2O)− cluster signal. Thus, we presume that both I− and I(H2O)− are the most important reagent ions.
4.2.2 Collisional dissociation in the CDC
While the sensitivity to ClNO2and N2O5at their respective iodide clusters is enhanced 15
by the presence of water vapor, it is degraded by collisional dissociation in the CDC. Thus, we strike a balance in the operation of the CDC. The CDC electric field must be strong enough to dissociate water molecules associated with the analyte ions of interest to maintain a high S/N at the cluster-ion m/z. However, the field strength must be weak enough to allow the survival of the I(ClNO2)− and I(N2O5)− clusters. In 20
practice, there are often other species of interest for detection, such as acyl peroxy nitrates, the product ions of which may cluster with water more strongly than the iodide clusters of N2O5and ClNO2. Thus, the chosen CDC electric field strength usually does not favor maximum sensitivity to N2O5and ClNO2via their iodide clusters.
The overall sensitivity and detection limit for a particular species is improved by pro-25
AMTD
2, 119–151, 2009Simultaneous, in situ detection of ClNO2
and N2O5
J. P. Kercher et al.
Title Page
Abstract Introduction
Conclusions References
Tables Figures
◭ ◮
◭ ◮
Back Close
Full Screen / Esc
Printer-friendly Version
Interactive Discussion
charge transfer and cluster ion formation, the sensitivity and detection limit of the CIMS can be further optimized. To obtain an estimate of the branching between (R9) and (R11), and between (R12) and (R13) in the IMR at 60 torr, we examined the ratios of I(ClNO2)− to ICl− signals and of I(N2O5)− to NO−3 signals as a function of electric field strength in the CDC. As the cluster product ions can be dissociated in the CDC, the 5
relative signals detected after the CDC provide only lower limits to the true branch-ing. With relatively moist N2sample or ion source flows, I(ClNO2)− approaches∼80% of the total nitryl chloride signal{I(ClNO2)− + ICl−}while I(N2O5)− approaches up to
∼50% of the total measured N2O5signal{I(N2O5)−+NO−3 +NO3(H2O)−}as the CDC field strength is lowered to a few V/cm. The IMR pressure also likely affects the ab-10
solute branching given that the cluster channels are probably enhanced by third-body stabilization of the complexes. This issue deserves further study.
4.3 Specificity and instrumental zero determinations
In a complex matrix such as air, signal at some m/z cannot always be uniquely at-tributed to a specific compound. Chemical ionization provides a degree of specificity 15
given that many possible ion-molecule reactions are either kinetically or thermodynam-ically prohibited from occurring. Thus, the appropriate choice of a reagent ion can greatly improve specificity. N2O5 and ClNO2 also have certain chemical properties which can be utilized to enhance the inherent specificity of the CIMS method. First, both N2O5 and ClNO2 thermally decompose around 425 K (Zhu and Lin, 2004). Sec-20
ond, at temperatures near 298 K, N2O5exists in a dynamic equilibrium with NO3 and NO2. NO3reacts rapidly with NO to form NO2
NO3+NO→2NO2 (R16)
Thus, addition of high concentrations of NO to sample air near room temperature should effectively titrate both N2O5 and NO3from the sample air (Fuchs et al., 2008). 25
AMTD
2, 119–151, 2009Simultaneous, in situ detection of ClNO2
and N2O5
J. P. Kercher et al.
Title Page
Abstract Introduction
Conclusions References
Tables Figures
◭ ◮
◭ ◮
Back Close
Full Screen / Esc
Printer-friendly Version
Interactive Discussion
ratio that should match the natural isotopic abundance for chlorine. We use all of these qualities to ensure specificity in the N2O5and ClNO2measurements. We assume that it is highly unlikely there exists chemical species that havem/z identical to N2O5 and ClNO2, that cluster with the iodide ion, and that have the same chemical properties described above. Recent field tests suggest this assumption is valid.
5
To account for sources of signal at the I(N2O5)− and the I(ClNO2)−m/z that are not due to N2O5or ClNO2, i.e. sources of background noise, we perform routine “zero” de-terminations in which N2O5and ClNO2are scrubbed from ambient air and the residual signal is recorded. This background signal has two main sources: internal electronic noise and interferences, the latter of which are ions havingm/z within the mass resolu-10
tion of them/z of the N2O5and ClNO2iodide clusters. Our zero determinations include both short additions of high concentrations of NO (∼1 ppm) to the sampling manifold to titrate N2O5, and sampling ambient air through a 30 cm long, 13 mm OD stainless steel tube filled with stainless steel wool and heated to 450 K. The air exiting the hot metal tube passes through a 20 cm length of 6 mm OD tubing and thus likely cools 15
back to near ambient temperature prior to entry into the UW-CIMS. This latter method, with its high surface area of hot metal, efficiently scrubs NO3 and Cl-atoms released by thermal decomposition of N2O5and ClNO2whereas the NO addition will only scrub N2O5.
Instrument zeros performed through a hot metal thermal dissociation tube are sim-20
ple, but must be carefully examined. For example, it is possible that an interfering species is also lost in the hot metal tube or that the composition of the air is signifi-cantly changed to affect the overall sensitivity. Both scenarios lead to an uncertainty in the true background. We have observed that thePH2Oin the IMR is routinely lower dur-ing zero determinations than durdur-ing ambient sampldur-ing, implydur-ing a different sensitivity 25
AMTD
2, 119–151, 2009Simultaneous, in situ detection of ClNO2
and N2O5
J. P. Kercher et al.
Title Page
Abstract Introduction
Conclusions References
Tables Figures
◭ ◮
◭ ◮
Back Close
Full Screen / Esc
Printer-friendly Version
Interactive Discussion
4.4 Detection limits
The lowest concentration that gives rise to a signal which can be statistically diff erenti-ated from the instrumental background is termed the detection limit. It is a function of the instrumental sensitivity, background noise, and averaging time. A useful threshold for a statistical definition of a detection limit is the concentration at which the signal-to-5
noise ratio (S/N) is 2. Discrete ion counting follows Poisson statistics, thus the expected random variation about a mean count rate goes as the square root of the count rate. The signal-to-noise ratio can be calculated via
S N =
Cf[X]t
p
Cf[X]t+2Bt
(1)
where the numerator provides the total number of counts produced during a given 10
integration period,t, while sampling air with a mixing ratio, [X], of N2O5or ClNO2, and with a calibration factor, Cf. The denominator represents the total noise associated with such a measurement which comes from the scatter about the sum of the count rate associated with the signal and the underlying background count rate,B.
Under moist ambient conditions at Earth’s surface, i.e. RH>50% and T >280 K, the 15
Cf for N2O5 and ClNO2 at the iodide clusters are 1.1 and 1.3 Hz/pptv, respectively, and the background count rates are 2 and 3 Hz, respectively. These parameters and Eq. (1) yield detection limits for N2O5 and ClNO2 of 11 and 13 pptv for a one second measurement. These values improve with the square root of the averaging time to <2 pptv for a 1-min average. However, there is a limit to which time averaging can 20
improve the S/N. The ability to distinguish signal from the background depends on the uncertainty in the background value which can be approximated as the point-to-point variation in the values determined by individual zero determinations as described above. During a recent field campaign the 1σ variation in the background count rate measurements was 2.5 Hz for N2O5and ClNO2, respectively, which is equivalent to 2.3 25
AMTD
2, 119–151, 2009Simultaneous, in situ detection of ClNO2
and N2O5
J. P. Kercher et al.
Title Page
Abstract Introduction
Conclusions References
Tables Figures
◭ ◮
◭ ◮
Back Close
Full Screen / Esc
Printer-friendly Version
Interactive Discussion
4.5 Accuracy and precision
Ultimately, we expect the accuracy of our reported N2O5 and ClNO2 mixing ratios will be largely determined by uncertainty in the NO2 cylinder and O3 concentration measurement. We compared the observed changes in O3 mixing ratios eluting from the continuous-flow N2O5 source, described above, to those predicted by a time-5
dependent chemical model of the source for a range of initial NO2mixing ratios. The output of our continuous-flow N2O5 source agrees with the predicted values to within the 20% uncertainty in the NO2 cylinder concentration, O3mixing ratio measurement, and plug-flow estimated reaction time. Thus, for hourly or longer time averages, across which we will have a well-calibrated knowledge of instrument sensitivity and back-10
ground, we can report an accuracy of 20% for ClNO2 and N2O5 mixing ratios well above 5 pptv. On shorter timescales, we rely on normalization of ion count rates to the total I− and I(H2O)−2 clusters to capture changes in sensitivity due to changes in ion transmission and ambient water vapor. Note, the sensitivity varies by only 0.25% per percent change ambient water vapor mixing ratio whenPH2O>0.2 torr. It is only in 15
regions wherePH2O<0.15, and changing on timescales faster than can be normalized by the I(H2O)−that such contributions to uncertainty become important.
We expect that the precision of our N2O5 and ClNO2 observations should be gov-erned largely by counting statistics as we have already demonstrated for our acyl per-oxy nitrate measurements using adjacent differences of high time resolution measure-20
ments of a calibration source. The 1σ relative precision under counting statistics is S/√S where S is the signal count rate. For a 1 s integration and 100 pptv N2O5 or ClNO2, we estimate a precision of 10% and 7.5% respectively under moist conditions. This precision improves with the square root of the integration time. Generally, atmo-spheric variability is large enough, even on 60-s timescales to be the dominant source 25
AMTD
2, 119–151, 2009Simultaneous, in situ detection of ClNO2
and N2O5
J. P. Kercher et al.
Title Page
Abstract Introduction
Conclusions References
Tables Figures
◭ ◮
◭ ◮
Back Close
Full Screen / Esc
Printer-friendly Version
Interactive Discussion
5 Field performance
We recently deployed the UW-CIMS instrument aboard the RV Knorr as part of the International Chemistry in the Arctic Lower Troposphere (ICEALOT) campaign. The measurement campaign ran from 19 March–24 April 2008 as the ship left Woods Hole, MA and traveled from the Long Island Sound to Rekjavik, Iceland via Tromso, Nor-5
way. For more information on the goals and measurement suite during this campaign please visit: http://saga.pmel.noaa.gov/Field/icealot/. Our goal was to provide high quality measurements of ClNO2 and to test the performance of our N2O5 measure-ment technique side-by-side with the NOAA CaRDS instrumeasure-ment (Brown et al., 2002). Table 1 summarizes instrument performance during this campaign.
10
Prior to deployment, the UW-CIMS instrument and the NOAA CaRDS instrument made ambient measurements in Boulder, CO as part of the integration of the instru-ments into the shipping container that housed them on the RV Knorr. The inlet configu-ration for sampling both in Boulder, CO and on the Knorr consists of a virtual impactor, N2O5 and NO addition ports, a reducer, and a 12 m length of 6 mm OD PFA tubing 15
into the sea container. Ambient air is sampled at ∼11 slpm through a 1 cm length of 6 mm OD PFA tubing inlet on the front end of a custom built virtual impactor. Standard addition ports for N2O5 (6 mm) and NO (3 mm) are tied into the main sampling line via PFA fittings. Immediately following the NO addition port is a constriction which serves to drop the sampling line pressure to∼300 torr. A 12 m length of PFA tubing is used 20
to transport the gas from the top of the sampling tower to the sea container where it is split∼1 m from the end to allow the UW-CIMS and NOAA CaRDS to sample from the same inlet simultaneously.
The top panel of Fig. 5 shows N2O5 mixing ratios measured by the UW-CIMS and the NOAA CaRDS in Boulder, CO the night of 26 February 2008. N2O5 mixing ratios 25
AMTD
2, 119–151, 2009Simultaneous, in situ detection of ClNO2
and N2O5
J. P. Kercher et al.
Title Page
Abstract Introduction
Conclusions References
Tables Figures
◭ ◮
◭ ◮
Back Close
Full Screen / Esc
Printer-friendly Version
Interactive Discussion
from the signal at the nitrate ion mass (i.e. Reaction R9) where we have used zero measurements determined only from NO additions. If we use zero measurements ob-tained from the hot stainless steel tube, the lack of agreement between the NO−3 and the I(N2O5)− derived N2O5 mixing ratios worsens. The lower panel shows a point-by-point comparison of the data with the UW-CIMS N2O5 mixing ratio derived from 5
I(N2O5)− and NO−3 plotted versus that from the NOAA CaRDS. The slope of a linear least squares fit for I(N2O5)−is 1.02 with anR
2
of 0.990. The slope of the line changes by 2% when the intercept is allowed to vary from zero. The slope of a linear least squares fit for NO−3 is 1.20 with anR2of 0.967 when forced through zero. The slope of the line changes by 20% when the intercept is allowed to vary from zero, resulting in 10
a positive offset of 58 pptv. Even larger swings in sensitivity and background were ob-served at the NO−3m/z during the entire ICEALOT campaign (see Table 1 and Fig. 5). A more detailed comparison of the NOAA CaRDS and UW-CIMS N2O5measurements from ICEALOT is warranted. However, it is clear that the I(N2O5)− cluster ion more accurately reflects the true N2O5 mixing ratio over the full range of atmospheric con-15
centrations than does the NO−3 ion.
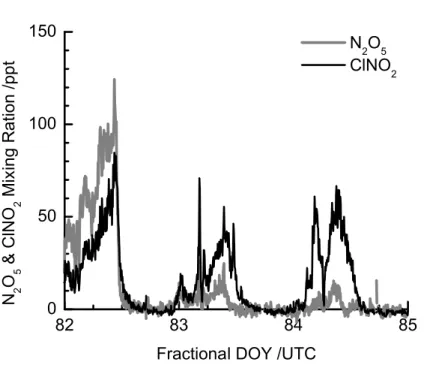
Figure 6 shows a time series of N2O5 and ClNO2 mixing ratios measured by the UW-CIMS during the first portion of ICEALOT. The RV Knorr left Woods Hole, MA on 19 March, headed west-southwest up the Long Island Sound until 21 March, when it reversed course, traveled east-northeast and exited the sound by 22 March. During the 20
traverse of the Long Island Sound, the prevailing wind-direction shifted from southerly flow, bringing air influenced primarily by Long Island sources, to northwesterly flow bringing air influenced by sources in Connecticut and New York. Most nights, N2O5 reached 100–250 pptv with ClNO2 being generally equal to or higher at mixing ratios of 150–200 pptv. Here we show a few nights where concentration maxima were 10– 25
100 pptv, illustrating the low detection limits of this method.
AMTD
2, 119–151, 2009Simultaneous, in situ detection of ClNO2
and N2O5
J. P. Kercher et al.
Title Page
Abstract Introduction
Conclusions References
Tables Figures
◭ ◮
◭ ◮
Back Close
Full Screen / Esc
Printer-friendly Version
Interactive Discussion
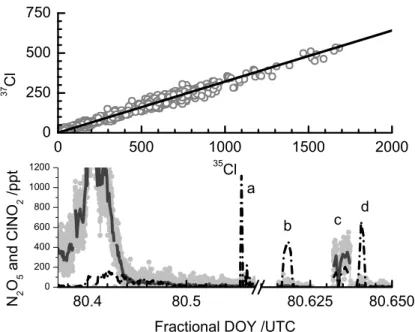
tests. In the top panel, we plot the raw signal obtained at I(35ClNO2)−m/z versus the signal at the I(37ClNO2)−m/z from the entire period of sampling in the Long Island Sound (see Fig. 6). A linear least squares fit to the data (not shown), forced through the intercept, yields a slope of 0.3207 andR2=0.996. This is within 0.5% percent of the theoretical isotopic value, 0.3199, indicated by the thick solid line. The experimen-5
tal and theoretical values are well within the precision of the instrument expected for 100 ms sampling. This result provides confidence that our measurements were of a chlorine-containing species that had the samem/z as ClNO2and can be destroyed on hot (180C) stainless steel. We note that the signals detected at the ICl−m/z did not demonstrate the expected Cl-isotopic ratio. In the lower panel of Fig. 7, we show raw 10
signals at the I(N2O5)−and the I( 35
ClNO2)−m/z during a standard addition of 2.0 ppbv N2O5 to ambient air. The N2O5 was added directly to the very top of the sampling manifold, 1cm from the sampling tip, just after a full night of continuous sampling and detection of N2O5 and ClNO2. The first addition occurs at the point labeled “a”. The N2O5 signal responds from a background count rate of 15 Hz to 2200 Hz, yielding a 15
UW-CIMS calibration factor for N2O5 of 1.1 Hz/pptv in ambient air. No change in the ClNO2signal is evident during the N2O5addition confirming that production of ClNO2 from N2O5 reactions on the tubing wall was minimal during this, and most such ad-ditions. Indeed, while the sampling manifold was cleaned almost daily, we used any evidence of ClNO2 signal enhancements during N2O5 additions to ambient air as an 20
indication of inlet contamination and the inlet tubing was replaced and the sampling manifold was cleaned.
6 Summary and conclusions
We report on a new method for the simultaneous in situ detection of nitryl chloride, ClNO2, and N2O5 using chemical ionization mass spectrometry (CIMS). The novel 25
AMTD
2, 119–151, 2009Simultaneous, in situ detection of ClNO2
and N2O5
J. P. Kercher et al.
Title Page
Abstract Introduction
Conclusions References
Tables Figures
◭ ◮
◭ ◮
Back Close
Full Screen / Esc
Printer-friendly Version
Interactive Discussion
We address the roles of water vapor, electric field strengths, and instrument zero de-terminations, which can greatly influence the overall sensitivity and detection limit of the method. The sensitivity to both N2O5 and ClNO2 is logarithmically dependant on the partial pressure of water vapor in the ion-molecule reaction region. Under typical marine boundary layer conditions, the technique can be largely insensitive to changes 5
in atmospheric water vapor concentrations, but under continental sampling, low water vapor concentrations could greatly reduce sensitivity. Detection of the iodide-clusters of these species has a threshold-dependence on the electric field strength in the CDC. Above∼70 V/cm at 1.5 torr in the CDC, the clusters become essentially undetectable. We demonstrate the ability for simultaneous in situ measurements of ClNO2and N2O5 10
while on board the RV Knorr as part of the ICEALOT 2008 Field Campaign. These ob-servations serve to reinforce the importance of ClNO2as a nocturnal NOxand Cl-atom reservoir in coastal regions. Our technique allows a way to measure both reactant (N2O5) and product (ClNO2) of complex gas-particle chemistry with a single instru-ment.
15
Acknowledgements. William P. Dub ´e, Hendrik Fuchs, and Steven S. Brown provided the cavity ringdown N2O5measurements for comparison. We thank National Oceanic and Atmospheric Administration (NOAA) scientists Steven S. Brown, Bill Kuster and Eric J. Williams of the Earth System Research Laboratory and Patricia K. Quinn and Timothy Bates of the Pacific Marine En-vironmental Laboratory for financial and logistical support during the integration and ICEALOT 20
campaign. We greatly appreciate the efforts of the RV Knorr crew exhibited during the entire cruise. We thank V. Faye McNeill for insights into nitryl chloride detection, G. M. Wolfe for help with instrument integration prior to ICEALOT and T. H. Bertram for useful discussions about in-strument performance. JPK gratefully acknowledges the Camille and Henry Dreyfus foundation for financial support through a postdoctoral fellowship.
25
References
AMTD
2, 119–151, 2009Simultaneous, in situ detection of ClNO2
and N2O5
J. P. Kercher et al.
Title Page
Abstract Introduction
Conclusions References
Tables Figures
◭ ◮
◭ ◮
Back Close
Full Screen / Esc
Printer-friendly Version
Interactive Discussion
Loss Mechanisms of NO3and N2O5in a Polluted Marine Environment: Results from in situ Measurements during New England Air Quality Study 2002, J. Geophys. Res.-Atmos., 111, D23S73, doi:10.1029/2006JD007252, 2006.
Arsene, C., Bougiatioti, A., Kanakidou, M., Bonsang, B., and Mihalopoulos, N.: Tropospheric OH and Cl levels deduced from non-methane hydrocarbon measurements in a marine site, 5
Atmos. Chem. Phys., 7, 4661–4673, 2007, http://www.atmos-chem-phys.net/7/4661/2007/.
Atkinson, R.: Atmospheric Chemistry of VOCs and NOx, Atmos. Environ., 34, 2063–2101, 2000.
Ayers, J. D. and Simpson, W. R.: Measurements of N2O5near Fairbanks, Alaska, J. Geophys. 10
Res.-Atmos., 111, D14309, doi:10.1029/2006JD007070, 2006.
Behnke, W., George, C., Scheer, V., and Zetzsch, C.: Production and Decay of ClNO2from the Reaction of Gaseous N2O5with NaCl solution: Bulk and Aerosol Experiments, J. Geophys. Res.-Atmos., 102, 3795–3804, 1997.
Bertram, T. H., Riedel, T. P., and Thornton, J. A.: An Experimental Technique for the Direct Mea-15
surement of Heterogeneous and Multiphase Reactions on Ambient Particles: Application to N2O5reactivity, Atmos. Chem. Phys. Discuss., submitted, 2009.
Brown, S. S., Dub ´e, W. P., Osthoff, H. D., Stutz, J., Ryerson, T. B., Wollny, A. G., Brock, C. A., Warneke, C., De Gouw, J. A., Atlas, E., Neuman, J. A., Holloway, J. S., Lerner, B. M., Williams, E. J., Kuster, W. C., Goldan, P. D., Angevine, W. M., Trainer, M., Fehsenfeld, F. 20
C., and Ravishankara, A. R.: Vertical Profiles in NO3and N2O5Measured from an Aircraft: Results from the NOAA P-3 and Surface Platforms during the New England Air Quality Study 2004, J. Geophys. Res.-Atmos., 112, D22304, doi:10.1029/2007JD008883, 2007.
Brown, S. S., Neuman, J. A., Ryerson, T. B., Trainer, M., Dub ´e, W. P., Holloway, J. S., Warneke, C., de Gouw, J. A., Donnelly, S. G., Atlas, E., Matthew, B., Middlebrook, A. M., Peltier, R., 25
Weber, R. J., Stohl, A., Meagher, J. F., Fehsenfeld, F. C., and Ravishankara, A. R.: Nocturnal Odd-Oxygen Budget and its Implications for Ozone Loss in the Lower Troposphere, Geophys. Res. Lett., 33, L08801, doi:10.1029/2006GL025900, 2006.
Brown, S. S., Stark, H., Ciciora, S. J., McLaughlin, R. J., and Ravishankara, A. R.: Simulta-neous in situ Detection of Atmospheric NO3and N2O5via Cavity Ring-Down Spectroscopy, 30
Rev. Sci. Instrum., 73, 3291–3301, 2002.
AMTD
2, 119–151, 2009Simultaneous, in situ detection of ClNO2
and N2O5
J. P. Kercher et al.
Title Page
Abstract Introduction
Conclusions References
Tables Figures
◭ ◮
◭ ◮
Back Close
Full Screen / Esc
Printer-friendly Version
Interactive Discussion
1737–1750, 2008,
http://www.atmos-chem-phys.net/8/1737/2008/.
Dentener, F. J. and Crutzen, P. J.: Reaction of N2O5on Tropospheric Aerosols – Impact on the Global Distributions of NOx, O3, and OH, J. Geophys. Res.-Atmos., 98, 7149–7163, 1993. Evans, M. J. and Jacob, D. J.: Impact of new Laboratory Studies of N2O5Hydrolysis on Global 5
Model Budgets of Tropospheric Nitrogen Oxides, Ozone, and OH, Geophys. Res. Lett., 32, L09813, doi:10.1029/2005GL022469, 2005.
Finlayson-Pitts, B. J., Ezell, M. J., and Pitts, J. N.: Formation of Chemically Active Chlorine Compounds by Reactions of Atmospheric NaCl Particles with Gaseous N2O5and ClONO2, Nature, 337, 241–244, 1989.
10
Fuchs, H., Dub ´e, W. P., Cicioira, S. J., and Brown, S. S.: Determination of Inlet Transmission and Conversion Efficiencies for in situ Measurements of the Nocturnal Nitrogen Oxides, NO3, N2O5and NO2, via Pulsed Cavity Ring-Down Spectroscopy, Anal. Chem., 80, 6010–6017, 2008.
Geyer, A., Alicke, B., Mihelcic, D., Stutz, J., and Platt, U.: Comparison of Tropospheric NO3 15
Radical Measurements by Differential Optical Absorption Spectroscopy and Matrix Isolation Electron Spin Resonance, J. Geophys. Res.-Atmos., 104, 26097–26105, 1999.
Harrison, A. G.: Chemical Ionization Mass Spectrometry, CRC Press, Boca Raton, Fla., 1983. Heintz, F., Platt, U., Flentje, H., and Dubois, R.: Long-term Observation of Nitrate Radicals at
the Tor Station, Kap Arkona (Rugen), J. Geophys. Res.-Atmos., 101, 22891–22910, 1996. 20
Huey, L. G.: Measurement of Trace Atmospheric Species by Chemical Ionization Mass Spec-trometry: Speciation of Reactive Nitrogen and Future Directions, Mass Spectrom. Rev., 26, 166–184, 2007.
Huey, L. G., Hanson, D. R., and Howard, C. J.: Reactions of SF−6 and I−with Atmospheric Trace Gases, J. Phys. Chem., 99, 5001–5008, 1995.
25
Jacob, D. J.: Heterogeneous Chemistry and Tropospheric Ozone, Atmos. Environ., 34, 2131– 2159, 2000.
Logan, J. A.: Tropospheric Chemistry – A Global Perspective, Abstracts of Papers of the Amer-ican Chemical Society, 182, 78-PHYS, 1981.
McNeill, V. F., Patterson, J., Wolfe, G. M., and Thornton, J. A.: The effect of varying levels 30
of surfactant on the reactive uptake of N2O5 to aqueous aerosol, Atmos. Chem. Phys., 6, 1635–1644, 2006,
AMTD
2, 119–151, 2009Simultaneous, in situ detection of ClNO2
and N2O5
J. P. Kercher et al.
Title Page
Abstract Introduction
Conclusions References
Tables Figures
◭ ◮
◭ ◮
Back Close
Full Screen / Esc
Printer-friendly Version
Interactive Discussion
Mentel, T. F., Bleilebens, D., and Wahner, A.: A Study of Nighttime Nitrogen Oxide Oxidation in a Large Reaction Chamber - The Fate of NO2N2O5, HNO3, and O3 at Different Humidities, Atmos. Environ., 30, 4007–4020, 1996.
Noxon, J. F., Norton, R. B., and Marovich, E.: NO3in the Troposphere, Geophys. Res. Lett., 7, 125–128, 1980.
5
Osthoff, H. D., Roberts, J. M., Ravishankara, A. R., Williams, E. J., Lerner, B. M., Sommariva, R., Bates, T. S., Coffman, D., Quinn, P. K., Dibb, J. E., Stark, H., Burkholder, J. B., Talukdar, R. K., Meagher, J., Fehsenfeld, F. C., and Brown, S. S.: High Levels of Nitryl Chloride in the Polluted Subtropical Marine Boundary Layer, Nature Geoscience, 1, 324–328, 2008. Pechtl, S. and von Glasow, R.: Reactive Chlorine in the Marine Boundary Layer in the 10
Outflow of Polluted Continental Air: A Model Study, Geophys. Res. Lett., 34, L11813, doi:10.1029/2007GL029761, 2007.
Platt, U., Allan, W., and Lowe, D.: Hemispheric average Cl atom concentration from13C/12C ratios in atmospheric methane, Atmos. Chem. Phys., 4, 2393–2399, 2004,
http://www.atmos-chem-phys.net/4/2393/2004/. 15
Platt, U. and Heintz, F.: Nitrate Radicals in Tropospheric Chemistry, Israel J. Chem., 34, 289– 300, 1994.
Simpson, W. R.: Continuous Wave Cavity Ring-Down Spectroscopy Applied to in situ Detection of Dinitrogen Pentoxide (N2O5), Rev. Sci. Instrum., 74, 3442–3452, 2003.
Slusher, D. L., Huey, L. G., Tanner, D. J., Flocke, F. M., and Roberts, J. M.: A Thermal 20
Dissociation-Chemical Ionization Mass Spectrometry (TD-CIMS) Technique for the Simul-taneous Measurement of Peroxyacyl Nitrates and Dinitrogen Pentoxide, J. Geophys. Res.-Atmos., 109, D19315, doi:10.1029/2004JD004670, 2004.
Smith, N., Plane, J. M. C., Nien, C. F., and Solomon, P. A.: Nighttime Radical Chemistry in the San-Joaquin Valley, Atmos. Environ., 29, 2887–2897, 1995.
25
Spicer, C. W., Chapman, E. G., Finlayson-Pitts, B. J., Plastridge, R. A., Hubbe, J. M., Fast, J. D., and Berkowitz, C. M.: Unexpectedly High Concentrations of Molecular Chlorine in Coastal Air, Nature, 394, 353–356, 1998.
Stutz, J., Alicke, B., Ackermann, R., Geyer, A., White, A., and Williams, E.: Vertical Profiles of NO3, N2O5, O3, and NOx in the Nocturnal Boundary Layer: 1. Observations during the Texas 30
Air Quality Study 2000, J. Geophys. Res.-Atmos., 109, D16399, doi:10.1029/2004JD005217, 2004.
AMTD
2, 119–151, 2009Simultaneous, in situ detection of ClNO2
and N2O5
J. P. Kercher et al.
Title Page
Abstract Introduction
Conclusions References
Tables Figures
◭ ◮
◭ ◮
Back Close
Full Screen / Esc
Printer-friendly Version
Interactive Discussion
Products, and the Effect of Surface Active Organics, J. Phys. Chem. A, 109, 10004–10012, 2005.
Thornton, J. A., Braban, C. F., and Abbatt, J. P. D.: N2O5 Hydrolysis on Sub-Micron Organic Aerosols: the Effect of Relative Humidity, Particle Phase, and Particle Size, Phys. Chem. Chem. Phys., 5, 4593–4603, 2003.
5
van Aardenne, J. A., Carmichael, G. R., Levy, H., Streets, D., and Hordijk, L.: Anthropogenic NOx Emissions in Asia in the Period 1990–2020, Atmos. Environ., 33, 633–646, 1999. Veres, P., Roberts, J. M., Warneke, C., Welsh-Bon, D., Zahniser, M., Herndon, S., Fall, R., and
de Gouw, J.: Development of Negative-Ion Proton-Transfer Chemical-Ionization Mass Spec-trometry (NI-PT-CIMS) for the Measurement of Gas-Phase Organic Acids in the Atmosphere, 10
Int. J. Mass Spectrom., 274, 48–55, 2008.
Wayne, R. P., Barnes, I., Biggs, P., Burrows, J. P., Canosamas, C. E., Hjorth, J., Lebras, G., Moortgat, G. K., Perner, D., Poulet, G., Restelli, G., and Sidebottom, H.: The Nitrate Radical -Physics, Chemistry, and the Atmosphere, Atmos. Environ. Part A-General Topics, 25, 1–203, 1991.
15
Wolfe, G. M., Thornton, J. A., McNeill, V. F., Jaffe, D. A., Reidmiller, D., Chand, D., Smith, J., Swartzendruber, P., Flocke, F., and Zheng, W.: Influence of trans-Pacific pollution transport on acyl peroxy nitrate abundances and speciation at Mount Bachelor Observatory during INTEX-B, Atmos. Chem. Phys., 7, 5309–5325, 2007,
http://www.atmos-chem-phys.net/7/5309/2007/. 20
Wood, E. C., Wooldridge, P. J., Freese, J. H., Albrecht, T., and Cohen, R. C.: Prototype for in situ detection of Atmospheric NO3and N2O5via Laser-Induced Fluorescence, Environ. Sci. Technol., 37, 5732–5738, 2003.
Yienger, J. J.: An Evaluation of Chemistry’s Role in the Winter-Spring Ozone Maximum found in the Northern Midlatitude Free Troposphere, J. Geophys. Res.-Atmos., 104, 8329–8329, 25
1999.
Zhu, R. S. and Lin, M. C.: Ab initio Studies of ClOx Reactions: Prediction of the Rate Constants of ClO+NO for the Forward and Reverse Processes, Chem. Phys. Chem., 5, 1864–1870, 2004.
AMTD
2, 119–151, 2009Simultaneous, in situ detection of ClNO2
and N2O5
J. P. Kercher et al.
Title Page
Abstract Introduction
Conclusions References
Tables Figures
◭ ◮
◭ ◮
Back Close
Full Screen / Esc
Printer-friendly Version
Interactive Discussion
Table 1. Summary of UW-CIMS performance for simultaneous, in situ detection of N2O5and
ClNO2during ICEALOT.
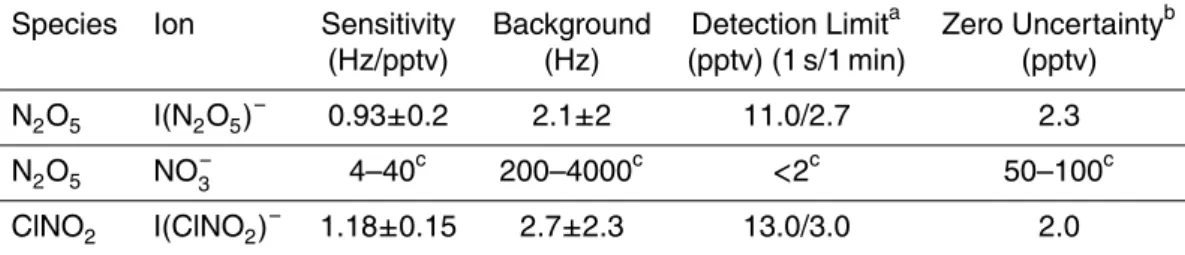
Species Ion Sensitivity Background Detection Limita Zero Uncertaintyb (Hz/pptv) (Hz) (pptv) (1 s/1 min) (pptv) N2O5 I(N2O5)− 0.93±0.2 2.1±2 11.0/2.7 2.3
N2O5 NO−3 4–40c 200–4000c <2c 50–100c
ClNO2 I(ClNO2)− 1.18±0.15 2.7±2.3 13.0/3.0 2.0
a
Mixing ratio which yields an instantaneous signal-to-noise ratio of 2:1. This theoretical value assumes the background count rate is known with absolute certainty.
b
Based on 1σ variation between adjacent background measurements. This value is a more realistic measure of the lowest detectable mixing ratio. See text for details.
c
AMTD
2, 119–151, 2009Simultaneous, in situ detection of ClNO2
and N2O5
J. P. Kercher et al.
Title Page
Abstract Introduction
Conclusions References
Tables Figures
◭ ◮
◭ ◮
Back Close
Full Screen / Esc
Printer-friendly Version
Interactive Discussion
≡ ion molecule region; CDC ≡ collisional dissociation chamber; QMS ≡
IMRCDC
Octupole Ion Guide
Quadrupole Mass Selector Detection
Fig. 1. Schematic of the University of Washington Chemical Ionization Mass Spectrometer
AMTD
2, 119–151, 2009Simultaneous, in situ detection of ClNO2
and N2O5
J. P. Kercher et al.
Title Page
Abstract Introduction
Conclusions References
Tables Figures
◭ ◮
◭ ◮
Back Close
Full Screen / Esc
Printer-friendly Version
Interactive Discussion
0 1x10⁴ 2x10⁴ 3x10⁴ 4x10⁴ 5x10⁴
C
IM
S
S
ig
n
a
l
(H
z
)
Run Time
NO 3
IN
2O5
ICl- IClNO
2
-−
− − −
Fig. 2.UW-CIMS ion time trace showing the evolution of the ICl−(solid grey circles), I(ClNO2)−
AMTD
2, 119–151, 2009Simultaneous, in situ detection of ClNO2
and N2O5
J. P. Kercher et al.
Title Page
Abstract Introduction
Conclusions References
Tables Figures
◭ ◮
◭ ◮
Back Close
Full Screen / Esc
Printer-friendly Version
Interactive Discussion
− −
corresponds to the 1σ deviation of the points used in the
0.0 0.5 1.0 1.5 2.0 2.5 3.0 3.5
0 500 1000 1500 2000 2500
N2O5 counts ClNO2 counts
C
IM
S
R
a
w
C
o
u
n
ts
(
H
z
)
N
2O5 Mixing Ratio (ppb)
0 500 1000 1500 2000 2500 3000 3500
C
IM
S
C
o
u
n
ts
/
H
z
Run Time /arb. units
Fig. 3. UW-CIMS signal (Hz) vs mixing ratio (ppbv) for N2O5 (triangles) and ClNO2 (circles)
AMTD
2, 119–151, 2009Simultaneous, in situ detection of ClNO2
and N2O5
J. P. Kercher et al.
Title Page
Abstract Introduction
Conclusions References
Tables Figures
◭ ◮
◭ ◮
Back Close
Full Screen / Esc
Printer-friendly Version
Interactive Discussion
0.0 0.1 0.2 0.3 0.4 0.5
0.00 0.05 0.10 0.15 0.20 0.25
IH2O/I SIH
2
O
/I
/
H
z
IMR H
2O Partial Pressure (PH2O) /torr 400
800 1200 1600
IN2O5 SN
2
O
5
/
H
z
100 200 300 400
IClNO2
S
C
lN
O
2
/
H
z
−
−
Fig. 4. Upper Panel: UW-CIMS cluster anion signal dependence on the ion molecule region
(IMR) water partial pressure (PH2O). Lower Panel: The iodide-water (IH2O
−) cluster anion
AMTD
2, 119–151, 2009Simultaneous, in situ detection of ClNO2
and N2O5
J. P. Kercher et al.
Title Page
Abstract Introduction
Conclusions References
Tables Figures
◭ ◮
◭ ◮
Back Close
Full Screen / Esc
Printer-friendly Version
Interactive Discussion
0 200 400 600 800 1000
0 200 400 600 800 1000
U
W
-C
IM
S
NOAA CaRDS N2O5
57.4 57.5 57.6 57.7 57.8
0 200 400 600 800
1000 NOAA CaRDS N
2O5
NO3
IN 2O5
N2 O5
M
ix
in
g
R
a
ti
o
/
p
p
t
Fractional DOY /UTC
− −
− −
Fig. 5.Top Panel: The N2O5mixing ratio for February 26th, 2008, as measured by the NOAA
AMTD
2, 119–151, 2009Simultaneous, in situ detection of ClNO2
and N2O5
J. P. Kercher et al.
Title Page
Abstract Introduction
Conclusions References
Tables Figures
◭ ◮
◭ ◮
Back Close
Full Screen / Esc
Printer-friendly Version
Interactive Discussion
82 83 84 85
0 50 100 150
N 2O5
ClNO2
N 2
O 5
&
C
lN
O 2
M
ix
in
g
R
a
ti
o
n
/
p
p
t
Fractional DOY /UTC
Fig. 6. The ClNO2(black) and N2O5 (grey) mixing ratios measured from 22 March (DOY 82)
AMTD
2, 119–151, 2009Simultaneous, in situ detection of ClNO2
and N2O5
J. P. Kercher et al.
Title Page
Abstract Introduction
Conclusions References
Tables Figures
◭ ◮
◭ ◮
Back Close
Full Screen / Esc
Printer-friendly Version
Interactive Discussion
80.4 80.5 80.625 80.650
0 200 400 600 800 1000 1200
d c b a
N 2 O 5
a
n
d
C
lN
O 2
/
p
p
t
Fractional DOY /UTC
0 500 1000 1500 2000
0 250 500 750
3
7 C
l
35 Cl
Fig. 7.Top Panel: The measured ClNO2isotope ratio (open circles) and a linear fit (m=0.320,