19
THROUGH DERIVATIVE FINANCIAL INSTRUMENTS
BASED ON SELYANINOV INDICES
Cristian KEVORCHIAN, PhD1 Camelia GAVRILESCU, PhD2
Gheorghe HURDUZEU, PhD3
Abstract
The financial product designed by the authors belongs to the class of derivative financial instruments, having “weather conditions” as basic variable; the settlement is oriented to options on OTC markets, which are able to adapt to the farmers’ risk exposure level. Unfortunately, they cause certain problems at position liquidation, and, moreover, due to lack of stock prices, they require proper evaluation models. The transformation of the weather risk into financial risk and its trading on financial markets relies on the willingness for risk taking of those groups of farmers which are using this particular financial instrument. One needs to emphasize that the proposed product is covering the risk for the production segment only of a specific crop that cannot be covered by the regular agricultural insurance, and it is based upon the Selyaninov index. The calculation formulae for a put type option will be presented: pay-off, strike, tick, and the level of the insurance premium for cereals. The reference weather stations will be: Tulcea, Brăila, Buzău, Galaţi, Focşani and Medgidia.
Keywords: Selyaninov index, weather risk, hedging, derivative instruments, options
JEL Classification: Q14, G22, G23
1 Scientific researcher III, Institute of Agricultural Economics, Romanian Academy 2
Scientific researcher II, Institute of Agricultural Economics, Romanian Academy 3
20
Introduction
More than 90% of production losses are due to unpredictable or extreme weather conditions. In this context, the agricultural policies of many countries include important economic mechanisms for agricultural production insurance, in the sense of compensating farmers in the case of extreme situations that result in totally or partially compromised farm production. The agricultural insurances currently on the market are marked by ”informational asymmetry and systematic risk”. The United States and Canada tested and implemented a wide range of advanced insurance products, such as those of “multiple-hazard” type. In this context, we mention the range of products offered by WeatherBill, where the Total Weather Insurance product stands out, which combines Big Data, Climatology and Agriculture in an attempt to supply online agricultural insurance for weather risk coverage. However, there are certain analysts who advocate a re-evaluation of the scope and utilization modality of these products (Skees, 2001).
The paper investigates the opportunity of financial product utilization for limiting the weather risks – the weather derivative contracts used in the agricultural sector. The approach finds its rationale in the identification of connections between the weather derivative contracts markets (Jewson, Brix and Ziehmann, 2005).
We consider it appropriate to focus on the agricultural sector, starting from the negative effects that the natural disasters (e.g. flooding) (Skees and Barnett, 1999) and the weather variables (e.g. temperature) generate on this sector, both at national and international level. At the same time, we consider that an integrated approach to these is also justified by the fact that in the specialty literature these two types of contracts are also found in the large family of market-oriented environmental instruments, named mechanisms belonging to the field “Environmental Finance” (White, 2013), or “Eco-Finance” (Ali and Yano, 2004) – a hybrid between the regulations on the environment and the financial markets.
State of knowledge
21
contracts originate in the deregulation of the energy sector in the US starting with the year 1997, which led to the disappearance of monopolies in the electric power and natural gas industry, which had an impressive dynamics in the developed countries at that time, according to a study made in the year 2001 by PricewaterhouseCoopers (PWC) on the demand of Weather Risk Management Association (WRMA). As regards the contracts introduced in the developing countries (India, Morocco, Ukraine), one should mention the research efforts (mainly as regards the research and data availability infrastructure), the construction of econometric models and their testing and the special efforts with regard to the implementation of new financial structures (part of these were developed under certain projects funded by the World Bank - World Bank Commodity Risk Management Group (CRMG) or by the United Nations Organization - United Nations World Food Program (WFP).
A standard contract for a weather derivative financial product comprises:
- the period of contract: beginning date and ending date of contract;
- the weather measuring station;
- a weather variable, measured at the weather station during the contract period;
- an index, which aggregates the weather variable during the contract period;
- a pay-off function, which converts the index value in cash at the end of contract period;
- for certain types of contract, a premium is paid to the seller by the buyer at contract initiation.
These basic attributes are in direct concordance with the existence of the following:
(a) an agency in charge of measuring the weather variables; (b) a paying agent, responsible for supplying the final index
value, based on the values obtained according to a family of previously defined algorithms;
(c) a back-up station, which would be used in case of the main station failure;
22
Briefly, the financial product resulting from our research falls into the category of derivative financial instruments with the basic variable “weather conditions”, and the settlement is based on options, with transactions on OTC (Over The Counter) markets, which can be structured according to the needs; unfortunately, these raise certain problems at position liquidation, and furthermore, due to the absence of quotations, impose the utilization of evaluation models.
One must underline that the proposed product covers only the production risk at the level of a given crop, based on the hydro-thermal Selyaninov index.
For a put type option, we shall indicate formulae for calculating: pay-off, strike, tick and the premium level for cereals. The reference weather stations will be the following: Tulcea, Brăila, Buzău, Galaţi, Focşani and Medgidia.
The weather impact upon a large and various business category begins from small diminution of sales in a shop on a rainy day up to total disaster, i.e. in the situation when catastrophic flooding destroys large areas under crops together with the processing factories of certain large companies that operate in agriculture and not only in agriculture. The extreme weather conditions result in significant material damages and loss of human lives. The companies willing to protect themselves against the financial impact of such disasters can buy products of the insurance companies on the basis of which they will get compensations according to their losses.
The weather derivatives are financial products designed to help companies involved in agricultural business to get insured against non-catastrophic weather risks (Cao and Wei, 2000). The non-catastrophic weather fluctuations include the alternation of warm and cold periods, rainy or dry periods, storm or calm periods, and so on and so forth, their emergence being reasonable. However, these can induce drastic diminutions of profit depending on the moment from the vegetation period of crops when they occur.
23
price, and implicitly an increase of their attractiveness for investors. Although hedging incurs additional costs, these might be insignificant as compared to the potential production losses and of their influence upon profit, which most often led to company bankruptcy. The usual instruments for limiting the risk at farm level are the following:
(a) production diversification;
(b) increase of reserves at farm level; (c) irrigations.
An alternative variant to this weather risk coverage scenario is that of the financial instruments used as vehicle to transfer risk to markets specialized in this type of operations: insurance contracts and derivative financial instruments.
A derivative instrument is a transfer contract of a risk sized depending on the value of a basic asset. The basic asset may be any transactional instrument agreed by the contracting parts. A derivative instrument is characterized by the fact that its value depends on the value of an asset (agricultural production) and does not need an initial investment as in the case of usual risk limiting instruments that have been previously presented; furthermore, the payment is made at a subsequent date.
Depending on how the settlement is done, there are:
- futures financial instruments (Kevorchian and Hurduzeu, 2010) (forward, swap, futures);
- options (put and call, collar, swap, etc.).
Depending on the market on which these financial instruments are transacted, we might find:
-transacting on organized markets, where there are standardized contracts as well as certain advantages, i.e. liquidity, available quotations as well as an increased possibility of position liquidation. Standardization obstructs a coverage;
-transacting on OTC markets, which allows an adaptive structuring to own needs, yet difficulties in position liquidation are met, and the absence of quotations imposes the utilization of adequate models for evaluation.
24
Methodology and data sources
The approach described in the previous chapter requires the construction of a subscription index model on the basis of which the derived product value is established. The simplest solution in index modeling is based on the distribution of its historical values. Parametric or non-parametric variants of distribution can be adopted as well.
Temperature and moisture are essential parameters during the vegetation period on which the quantity and quality of production depend, yet the predictive power of models for the entire vegetation period is quite limited. We consider that a better result might be obtained by modeling the process of index generation on a finer scale. In the case of contracts on temperature only, in the model based on the daily average (or min/max value), the time series thus obtained can be relatively easy to predict.
The model can be constructed by using the common statistical models, time series (e.g. ARMA (Autoregressive Moving Average) or Fourier transform in frequency domain), exclusively based on the characteristics displayed in the historical time series of the index. A more sophisticated approach is to incorporate certain exogenous data in our statistical models based on spatial-temporal correlations from the weather zone (for instance the effects of hurricanes with temperatures and rainfall can be integrated). A superior approach for the daily or monthly modeling of the variable time series is to combine the weather, statistical and physical models using the weighted data horizon on the basis of which they are obtained, after the optimization on the basis of data from the combined systems performance evaluation sample.
Results and discussions
In general, the financial instruments of weather derivatives type target the low risk events, but with high occurrence probability, compared to the weather insurances that target high risk events, but with low occurrence probability. Hence, on the basis of a proper risk coverage policy, the two instruments can be combined into a mix of products accessed according to the farmer’s risk aversion level.
25
2 South-East: wheat, maize, barley, sunflower and rapeseed. Region 2 South-East was selected on purpose, as the largest and most modern farms are found there, which benefit from the best soils in the country, yet at the same time they are subject to the strongest weather variations (excessive temperatures, excessive drought, excessive rainfall).
We consider the Selyaninov hydro-thermal index as the subscription asset, as it reflects the couple temperature-moisture into a single variable:
(1)
where: T = temperature;
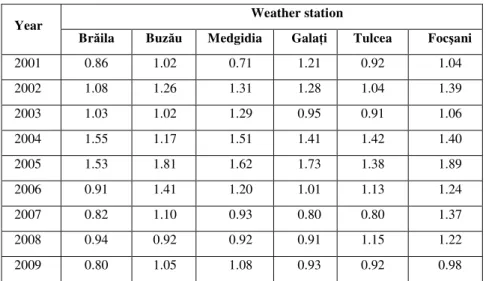
P = rainfall volume measured at a given weather station. The National Meteorology and Hydrology Authority issues a forecast for the Selyaninov index value for all the weather stations in the country on a quarterly basis, and afterwards it publishes the yearly average values effectively reached (Table 1).
For the Romanian crops, the weather conditions for obtaining the best harvest possible, in general, require a Selyaninov index in the interval 1≤SHR≤1.4. When the index exceeds the value 1.6, production decreases due to excessive moisture, and when the index is lower than 0.6 production decreases due to excessive drought.
As a spot value to be used in the transactions on the market, the index was calculated on the basis of daily measurements of temperature and rainfall in 6 weather stations in the 6 counties from Region 2 South-East (Brăila, Buzău, Medgidia, Galaţi, Tulcea and Focşani).
26
Table 1
Yearly value of Selyaninov index for the six investigated weather stations
Year Weather station
Brăila Buzău Medgidia Galaţi Tulcea Focşani
2001 0.86 1.02 0.71 1.21 0.92 1.04
2002 1.08 1.26 1.31 1.28 1.04 1.39
2003 1.03 1.02 1.29 0.95 0.91 1.06
2004 1.55 1.17 1.51 1.41 1.42 1.40
2005 1.53 1.81 1.62 1.73 1.38 1.89
2006 0.91 1.41 1.20 1.01 1.13 1.24
2007 0.82 1.10 0.93 0.80 0.80 1.37
2008 0.94 0.92 0.92 0.91 1.15 1.22
2009 0.80 1.05 1.08 0.93 0.92 0.98
Source: National Authority for Meteorology and Hydrology (NAMH)
We propose the following scenario: a farmer whose farm is located in Tulcea county wishes to use financial derivatives to cover the risk that the hydro-thermal Selyaninov index may reach values ranging from 0.71 to 0.73 (forecasted values), as it is known that this value of the index in the case of the wheat crop can result in a qualitative depreciation of production. The forecast value of index is below the historical average (a low risk event, but with high occurrence probability). With index values within this interval, the farmer’s incomes will be significantly diminished due to production losses caused by unfavorable weather conditions. The calculation formula of Selyaninov hydrothermal index (SHR) for the winter wheat vegetation period (15 April – 30 June), SHRwheat is:
∑
∑
∗
=
30 Jume -15 April
30 June -15 April wheat
re
temperatu
average
Daily
0,1
rainfall.
Daily
SHR
(2)27
index is not a tradable asset, through a family of functions attached to each crop and weather station a fraction of the Selyaninov index is associated to a certain amount of money that reflects the production loss or gain depending on the favorable/unfavorable weather conditions for obtaining the desired production.
The valoric Selyaninov index associated to a certain crop measures the weather suitability level for reaching a certain production level and it is identified with the value SHRcrop for a given
day in the contracting period, relative to a given weather station. The negative impact of the temperature – moisture combination on the wheat crop was calculated, expressed in production losses (table 3). The impact upon production was calculated using the following formula:
(3)
where: M = contract value;
θ = calculated value in table 3.
The functions estimating the production variation on the basis of Selyaninov index were determined (the Selyaninov index-production dependence adjustment curves) for all the 5 crops in all the 6 weather stations (30 functions in total – table 2).
Table 1
Adjustment curves determined for contract sizing
Crop
Selyaninov-production dependence adjustment
curve
Step Production
loss (tons)
θ index value (RON)
Brăila Station
Wheat Fwheat (x) = 5.948x 2
– 2.711x3 0.01 0.03237 15.3721 Maize Fmaize (x) = 11.785x2 –
6.522x3
0.01 0.05263 27.5817
Barley Fbarley (x) = 11.413x 4
– 6.089x5
0.01 0.03215 10.2896
Sunflower Fsunflower (x) = 4.262x 2
– 2.341x3
28 Crop
Selyaninov-production dependence adjustment
curve
Step Production
loss (tons)
θ index value (RON)
Rapeseed Frapeseed (x) = 2.661x2 –
0.9998x3
0.01 0.0104 7.280
Buzău Station
Wheat Fwheat (x) = 3.560x2 – 1.291x3 0.01 0.02269 10.7753
Maize Fmaize (x) = 7.114x2 – 2.954x3 0.01 0.05383 21.8013
Barley Fbarley (x) = 2.952x 2
– 1.400x3 0.01 0.0109 3.505 Sunflower Fsunflower (x) = 1.8954x2 –
0.8315x3
0.01 0.01465 21.1060
Rapeseed F rapeseed (x) = 1.4736x 2
– 0.5805x3
0.01 0.00582 4.0735
Medgidia Station
Wheat Fwheat (x) = 4.9947x 2
– 2.4737x3
0.01 0.025210 11.9719
Maize Fmaize (x) = 3.4695x 2
– 0.55819x3
0.01 0.028876 15.1330
Barley Fbarley (x) = 5.3725x
2
– 3.0620x3
0.01 0.06607 21.1441
Sunflower Fsunflower (x) = 1.8703x
2
– 0.8042x3
0.01 0.009913 14.2749
Rapeseed F rapeseed (x) = 2.7519x2 –
1.4289x3
0.01 0.026735 18.715049
Galaţi Station
Wheat Fwheat (x) = 4.0245x2 –
1.267x3
0.01 0.02757 13.0950
Maize Fmaize (x) = 12.902x2 –
6.142x3
0.01 0.06762 35.4281
Barley Fbarley (x) = 4.905x 2
– 2.365x3 0.01 0.021003 6.7208 Sunflower Fsunflower (x) = 2.1033x2 –
0.9449x3
0.01 0.018512 26.6578
Rapeseed F rapeseed (x) = 1.8944x 2
– 0.7140x3
29 Crop
Selyaninov-production dependence adjustment
curve
Step Production
loss (tons)
θ index value (RON)
Tulcea Station
Wheat Fwheat (x) = 3.943x2 – 1.858x3 0.01 0.02085 9.9014
Maize Fmaize (x) = 3.386x 2
– 0.589x3 0.01 0.02797 14.6582 Barley Fbarley (x) = 4.262x2 – 2.341x3 0.01 0.01921 6.147
Sunflower Fsunflower (x) = 4.262x2 –
2.341x3
0.01 0.03607 51.843
Rapeseed F rapeseed (x) = 2.172x3 –
1.065x4
0.01 0.0264 18.480
Tulcea Station
Wheat Fwheat (x) = 3.952x2 – 1.471x3 0.01 0.02480 11.7772
Maize Fmaize (x) = 3.159x
2
– 0.7654x3
0.01 0.023942 12.5472
Barley Fbarley (x) = 4.1218x2 –
2.0856x3
0.01 0.038123 12.19957
Sunflower Fsunflower (x) = 2.2380x2 –
1.0232x3
0.01 0.015105 2175061
Rapeseed F rapeseed (x) = 2.1273x 2
– 0.8484x3
0.01 0.007482 5.2374190
Source: authors’ calculations
Calculation example: Crop: winter wheat; Weather station: Tulcea; Step (variation tick): 0.01;
Fwheat, Tulcea (x) = 3.943 x2 – 1.858 x3 where: x= SHRwheat
30
Table 2
Evaluation of wheat production losses according to Selyaninov index value measured at the weather station Tulcea
Date
Average temperature
(°C)
Rainfall (mm)
SHRwheat (Selyaninov index calculated on a daily
basis)
I(SHR) (impact upon production – losses in tons)
16.04.2010 8.4 6.2 0.40 1.25
17.04.2010 8.5 0.0 0.26 1.54
18.04.2010 10.1 0.0 0.18 1.70
19.04.2010 12.0 0.6 0.15 1.77
20.04.2010 12.8 0.0 0.12 1.84
21.04.2010 13.0 0.2 0.10 1.88
22.04.2010 15.3 0.0 0.08 1.91
23.04.2010 12.9 6.8 0.14 1.79
Source: authors’ calculations
The index volatility was calculated in the area of the six weather stations where the study was conducted; the picture is shown in Figure 1.
Fig. 1 – Index volatility calculated for the 6 weather stations
0.00 0.05 0.10 0.15 0.20 0.25 0.30 0.35 0.40
1 2 3 4 5 6
Volatility R mean
31
Conclusions
Risk coverage in the case of certain weather phenomena with low risk but high occurrence probability is a necessity that can reduce the negative impact at farm economy level.
The weather derivatives market requires certain adjustments in the sense of unifying the price establishment methodologies. Practically, the financial product designed by the authors falls into the “black-box” modeling tendency for determining the option price, on the basis of the technologies belonging to Cloud Computing and Big Data paradigm (Kevorchian, 2013).
References
1. Ali, P. A. U., Yano, K. (2004) Eco-Finance - The Legal Design and Regulation of Market-Based Environmental Instruments, John Wiley and Sons.
2. Barnett, B., Vedenov, D. (2004) Efficiency of Weather Derivatives as Primary Crop Insurance Instruments, University of Georgia, Working Paper, 2004.
3. Brocket, P., Wang, M., Yang, C. (2005) Weather, derivatives and weather risk management, Risk Management and Insurance Review, vol. 8, nr. 1.
4. Cao, M., Wei, J. (2000) Pricing Weather Derivatives: an Intuitive and Practical Approach, Risk, p. 67-70.
5. Dischel, R. (2002) Climate Risk and Weather Market, Financial Risk Management With Wether Hedges, London: HayMarket House.
6. Jewson, S., Brix, A., Ziehmann, C. (2005) Weather Derivative Valuation: The Meteorological, Statistical, Financial and Mathematical Foundations, Cambridge University Press.
7. Kevorchian, C, Hurduzeu, G. (2011) Acoperirea riscului meteo în agricultură prin instrumente financiare derivate, în Otiman, P.I., Toderoiu, F., Sima, E. (coordonatori), Cercetări de economie agrară şi dezvoltare rurală 1990-2010 - realizări şi perspective, Editura Academiei Române, Bucureşti.
32
9. Labat, S., White R. (2002) Environmental Finance: A Guide to Environmental Risk Assessment and Financial Products, John Wiley & Sons.
10. Skees, J. (2000) A Role for Capital Markets în Natural Disasters: A Piece of the Food Security Puzzle, Food Policy, vol. 25, nr. 3, pp. 365-378.
11. Skees, J. (2001) The Bad Harvest, Regulation, vol. 24, nr. 1, pp. 16-21.
12. Skees, J., Barnett, B.J. (1999) Conceptual and Practical Considerations for Sharing Catastrophic/Systemic Risks, Review of Agricultural Economics, nr. 21, pp. 424-441.