Original Ar
tic
le
Study conducted at Centro de Estudos da Voz – CEV – São Paulo (SP), Brazil. Conflict of interests: None
(1) Centro de Estudos da Voz – CEV – São Paulo (SP), Brazil.
Correspondence address: Cristina Ribeiro Paiva Caldeira. R. Pilar 530/502, Grajaú, Belo Horizonte (MG), Brasil, CEP: 30431-225. E-mail: [email protected]
Received: 9/20/2010; Accepted: 8/31/2011
Análise das modificações vocais de repórteres na situação de
ruído
Cristina Ribeiro Paiva Caldeira1, Vanessa Pedrosa Vieira1, Mara Behlau1
ABSTRACT
Purpose: To investigate and compare the occurrence of vocal changes in the presence of masking noise between reporters and other professionals. Methods: Participants were 46 subjects with normal hearing, 23 reporters (study group) and 23 non-reporters (control group). Participants read an excerpt from a TV news broadcast in three listening situations: without masking noise, with 50 dB white noise, and with 90 dB white noise. The narrations were recorded and then submitted to auditory-perceptual and acoustic analyses. The auditory-perceptual analysis was performed by a speech-language pathologist specialized in voice. The acoustic analysis used the software Voxmetria (CTS Informática) to perform the acoustic measurements. Results: In the situation with 50 dB masking noise, individuals in the control group had higher increase of the following parameters, when compared to the group of reporters: pitch (82.6%), loudness(91.3%), and strain (82.6%). The same occurred in the situation with 90 dB masking noise for the same parameters: pitch (95.7%), loudness (100%) and strain (91.3%). Conclusion: The negative consequences of the Lombard effect occur in both groups; however, reporters showed the ability to partially inhibit the negative impact of noise situations, probably due to the stability of the professional speech production and activation of other feedback pathways.
Keywords: Voice; Voice quality; Perceptual masking; Voice training; Noise effects; Loudness perception
INTRODUCTION
Auditory feedback plays an important role in the voice control due to the regulation of respiratory and phonatory processes(1,2). In addition, feedback is considered an important resource in the control of frequency, intensity and voice quality parameters(3,4,5). Several studies reinforce the importance of auditory feedback on phonatory processes, claiming that it is crucial for the organization of vocal production, since it is through this system that individuals monitor and confirm the effectiveness of their communication(6).
Some parameters of voice production undergo changes when there is impairment or interruption of the auditory fee-dback. The presence of environmental noise is a condition that can impair voice auditory feedback, hindering communication. As an effect of the presence of noise, vocal intensity increases automatically. This phenomenon was described by Etiene Lombard in 1911(7), and it is known as the Lombard Reflex or the Lombard Effect.
The reporter’s professional performance depends on the use of voice, and a mild vocal deviation may affect the career
of this professional(8). The quantity and quality factors of voice usage associated with some recording situations, such as the presence of environmental noise, put these professionals at risk for developing voice problems(9,10). This occurs because increa-sed vocal intensity is a type of phonotraumatic situation, which may contribute to the development of voice disorders(11,12).
In addition to good voice quality, the reporter should be able to keep the viewer’s attention and to convey the message clearly. Frequently, there are different recording situations for the same story. The out of vision – OOV (part of the story in which the reporter’s voice is heard while images are shown on screen) can be recorded in a booth or in a silent room (when the reporter is out of the TV station), and the standup (part of the story in which the reporter appears in the video at the news site) might be held in a noisy place. However, large discrepancies in the reporter’s voice in these two situations (OOV and standup) should not happen, because they will be part of the same story. This fact leads us to hypothesize that, in addition to the auditory pathway, reporters use other means of monitoring the voice.
in singers than in non-singers when there is an interruption of auditory feedback(13,14).
As reporters deal with noisy environmental conditions and need to maintain a good voice quality and communicative performance in a high vocal demand context, it is clinically relevant to know the vocal behavior of this group in noisy situations(10). Although the importance of auditory feedback in voice control is known, it is observed that even in noisy situations some reporters have little voice changes. Thus, this study had the aims to verify and compare the occurrence of voice changes in reporters and non-reporters in the presence of noise, and also to characterize the nature of these deviations and establish a parallel between voice changes in reporters and their work experience and previous auditory training.
METHODS
This study, approved by the Ethics Committee of Centro de Estudos da Voz under number 716/08, was conducted with reporters from a TV station in Brazil. Participants were 46 subjects: 23 reporters (Study Group) and 23 non-reporters (Control Group). All the participants signed the Free and Informed Consent Term.
In the group of reporters, there were 10 men (43.5%) with mean age of 33.7 years (±7.77), and 13 women (56.5%) with mean age of 27.6 years (±7.77). For the Control Group, we selected non-reporters, employees from the same TV sta-tion, who did not use their voice professionally and had not undergone previous vocal or auditory training. In this group, 12 subjects were men (52.1%) with mean age of 30.5 years (±3.39), and 11 were women (47.9%) with mean age of 31 years (±5.60). The number of men and women in both samples was balanced. All participants underwent audiometry, with results within normal limits.
A speech sample was collected from the reading of the following excerpt from a TV news broadcast story: “A fila só não ficou maior e os preços não subiram ainda mais, porque nunca houve tanto financiamento para a casa própria. Como mais gente consegue comprar um imóvel aumenta a oferta no mercado de locação”.
Subjects got familiarized with the text by reading it once prior to recording. We did not provide any information regard-ing voice control durregard-ing the recordregard-ing. Both groups read the same passage in three different moments: the first without masking noise and the other two with white noise at 50 dB and 90 dB, respectively. Recordings were conducted in a silent room, with the subject standing, and the microphone positioned at 45° and 5 cm away from the mouth of the participant.
We used the following equipment: HP Pavillion® laptop, Shure® SM58 microphone, Sony® MDR-7506 professional headphone. For introducing the white noise and registering the recording, we used the masking tool of the software Fonotools 1.5 (CTS Informática).
The speech samples collected were submitted to auditory-perceptual and acoustic analyses. The auditory-auditory-perceptual analysis was conducted by a speech-language pathologist (SLP) specialized in voice without previous knowledge of the recording situation (with or without noise), according to the
parameters: loudness, pitch, strain, speech rate, and articula-tory precision. The recordings were presented in random order, without identification, and compared in pairs according to the following groups: 50 dB in relation to 0 dB, 90 dB in rela-tion to 50 dB, and 90 dB in relarela-tion to 0 dB. The SLP should identify whether the vocal parameters had increased, decreased or remained, compared with the other recording. The extrac-tion of the following acoustic measurements was performed using the software VoxMetria 3.0 (CTS Informática): mean frequency in Hz, minimum and maximum frequency in Hz, duration of the segment in seconds, mean intensity in dB, and variability in Hz.
All analyses for the Study Group were made taking into ac-count the reporter’s work experience and the report of previous auditory training. Work experience was classified according to three subgroups: 0-5 years (n=9), 6-10 years (n=8) and >11 years (n=6). With regards to previous auditory training, the group of reporters was divided into two subgroups: trained (n=7) and untrained (n=16).
Non-parametric statistical tests (Equality of Two Propor-tions, Mann Whitney and Kruskal-Wallis) were used for the analysis of auditory-perceptual and acoustic data. We adopted the significance level of 0.05 (5%). The calculations performed using the Minitab software showed that the sample of 23 subjects for each group has a high power, with value of 78.31% (0.7831).
RESULTS
For the analysis of the auditory-perceptual data, we used the Equality of Two Proportions test. In the presence of 50 dB of masking, the parameters loudness, pitch and strain were better preserved in the Study Group when compared to the Control Group. The same occurred for the situation with 90 dB of masking. In both moments, the most deviated parameters in the Control Group were: increased loudness, higher pitch, and increased strain. Moreover, under 90 dB masking, there was a statistical tendency of increased speech rate and articu-latory precision. Although the auditory-perceptual parameters increased in both groups, a larger number of subjects in the Study Group preserved the parameters loudness, pitch and strain when 50 dB and 90 dB of masking were inserted, even without instruction (Table 1).
There were no changes in auditory-perceptual parameters in the presence of 50 dB in relation to 90 dB of masking. Thus, it was observed that, regardless of the amount of masking increased, the responses were uniform and more evident for the Control Group (Table 2).
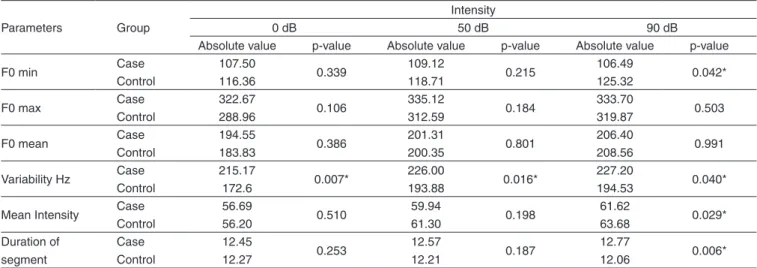
The results of acoustic analysis showed that, in the presence of 90 dB of masking, the minimum fundamental frequency was higher for the Control Group, whereas the variability of fundamental frequency in Hz remained higher for the Study Group. This difference remained constant even when there was an increase in the intensity of masking (Table 3). Both groups showed increase in intensity and frequency means when 50 dB and 90 dB of masking were inserted.
Table 1. Comparison of auditory-perceptual parameters between Study (reporters) and Control (non-reporters) groups
Parameter Group
Intensity 50 dB
Increased
50 dB Remained
90 dB Increased
90 dB Remained
n % p-value n % p-value n % p-value n % p-value
Loudness Case 13 56.5 0.007* 10 43.5 0.007* 17 73.9 0.009* 6 26.1 0.009*
Control 21 91.3 2 8.7 23 100 0 0.0
Pitch Case 10 43.5 0.006* 12 52.2 0.013* 17 73.9 0.040* 6 26.1 0.040*
Control 19 82.6 4 17.4 22 95.7 1 4.3
Strain Case 11 47.8 0.013* 12 52.2 0.013* 13 56.5 0.007* 9 39.1 0.016*
Control 19 82.6 4 17.4 21 91.3 2 8.7
Speech rate Case 6 26.1 0.345 12 52.2 0.234 5 21.7 0.063# 12 52.2 0.070#
Control 9 39.1 8 34.8 11 47.8 6 26.1
Articulatory precision
Case 7 30.4
0.134 15 65.2 0.234 8 34.8 0.039* 15 65.2 0.039*
Control 12 52.2 11 47.8 15 65.2 8 34.8
* Significant values (p<0.005) – Test of Equality of Two Proportions # Differences that tend to be significant
Table 2. Comparison of perceptual parameters, 90-50 dB relation, between Study (reporters) and Control (non-reporters) groups
Parameters Group
Intensity 90-50 dB
Increased
90-50 dB Remained
n % p-value n % p-value
Loudness Case 13 56.5 0.765 10 43.5 0.765
Control 14 60.9 9 39.1
Pitch Case 11 47.8 0.375 10 43.5 0.765
Control 14 60.9 9 39.1
Strain Case 10 43.5 0.555 13 56.5 0.555
Control 12 52.2 11 47.8
Speech rate Case 4 17.4 0.179 15 65.2 0.139
Control 8 34.8 10 43.5
Articulatory precision
Case 7 30.4
0.227 16 69.6 0.227
Control 11 47.8 12 52.2
Test of Equality of Two Proportions (p<0.005)
Table 3. Comparison of acoustic parameters, absolute values, between the Study (reporters) and Control (non-reporters) groups
Parameters Group
Intensity
0 dB 50 dB 90 dB
Absolute value p-value Absolute value p-value Absolute value p-value
F0 min Case 107.50 0.339 109.12 0.215 106.49 0.042*
Control 116.36 118.71 125.32
F0 max Case 322.67 0.106 335.12 0.184 333.70 0.503
Control 288.96 312.59 319.87
F0 mean Case 194.55 0.386 201.31 0.801 206.40 0.991
Control 183.83 200.35 208.56
Variability Hz Case 215.17 0.007* 226.00 0.016* 227.20 0.040*
Control 172.6 193.88 194.53
Mean Intensity Case 56.69 0.510 59.94 0.198 61.62 0.029*
Control 56.20 61.30 63.68
Duration of segment
Case 12.45
0.253 12.57 0.187 12.77 0.006*
Control 12.27 12.21 12.06
* Significant values (p<0.005) – Mann-Whitney Test
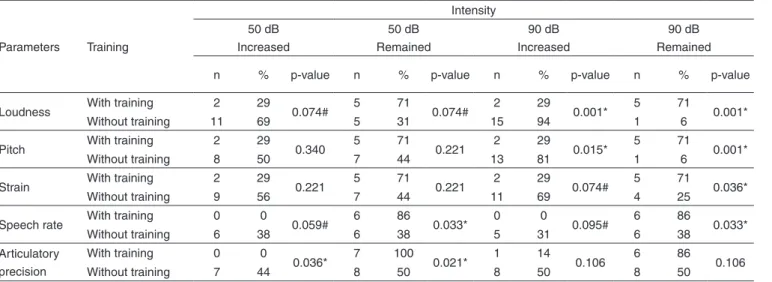
auditory-perceptual data relating the work experience and previous auditory training. Statistical analysis showed that there were differences in the parameters articulatory precision and speech rate with 50 dB of masking, and in the parameters
articulatory precision, loudness and pitch in the presence of 50 dB and 90 dB of masking in the group without training. The trained group showed little change in loudness, pitch, strain and speech rate in the presence of 90 dB of masking when compared to 50 dB (Table 4).
Acoustic data also revealed differences among subjects from the Study Group regarding auditory training. In the pre-sence of 50 dB and 90 dB, the values of maximum and mean intensity for the untrained group were higher than for the group with previous training. The untrained subjects had higher va-lues of maximum intensity (78.6 dB) when compared to trained subjects (76.1 dB) in the situation with 50 dB of masking. The same occurred with 90 dB of masking among untrained (80.3 dB) and trained subjects (76.8 dB). The acoustic parameter mean intensity was also superior in the untrained group in both situations, as follows: with 50 dB of masking, the mean intensity was 58.1 dB in the trained subjects and 60.8 dB in the untrained ones; with 90 dB, the mean was 59.3 dB in the trained group and 62.6 dB in the untrained group.
DISCUSSION
The increase in vocal intensity can be considered one of the phonotraumatic situations that most affects and endangers vocal health. Noise is considered one of the main factors that contribute to increase vocal intensity, as it interrupts the audi-tory feedback and compromises phonaaudi-tory control. Several studies have sought to better understand the vocal behavior of individuals in noisy situations(2,7,11,12,15,16). The results obtained in the present research answer the questions that guided the study.
According to these results, both groups in this study pre-sented voice changes characterized by increased loudness, pitch and strain. Similarly, a survey conducted with individuals with Parkinson’s disease showed improvement in their voice quality in the presence of noise, probably due to the increased loudness and strain, and better articulatory precision(17). These data corroborate the findings of research that explain the
Lombard effect(7,18-21). Ramig et al. observed that the increase in vocal intensity is associated directly with a more precise articulation in individuals that were submitted to the LSVT® method(22). As with the LSVT®, masked speech triggers the setting of increased intensity, and there is an improvement in other speech subsystems, working on joint action. Therefore, this statement explains the fact that the control group has increased articulatory precision in the presence of 90 dB of masking.
Both groups showed an increase in intensity and frequency means when 50 dB and 90 dB of masking were introduced. This result was observed in the literature, which states that the absence of auditory feedback causes changes mainly characterized by lack of control in intensity and shift of the fundamental frequency(12,15). In the present study, the acoustic values of frequency variability in Hz were higher in the pre-sence of masking noise. This result corroborates the findings of a study that had the aim to characterize the vocal capacity of 252 students and concluded that the increase in vocal intensity caused shift of the fundamental frequency(23).
The results of this study demonstrate that a larger number of subjects in the Study Group preserved the parameters loud-ness, pitch and strain in the presence of 50 dB and 90 dB of masking. This finding leads us to reflect on other ways of voice control and monitoring, because even with the impairment and interruption of auditory feedback, some professionals have ma-naged to preserve vocal parameters. A survey with 28 singing students estimated the significance of auditory and kinesthetic feedback in the control of vocal frequency. The results showed that the accuracy of intonation was reduced with impairment of auditory feedback and, in these conditions, singers should rely on the kinesthetic feedback circuits(13).
Several studies have sought to better understand the vocal behavior of normal individuals(2,6,14), subjects with communi-cation disorders(12,17), and professional voice users(13,16) in the presence of noise. Others have addressed the vocal training and the capacity to inhibit the Lombard effect. In this sense, experiments were conducted to test and inhibit the Lombard
Table 4. Analysis of perceptual parameters related to previous auditory training
Parameters Training
Intensity 50 dB
Increased
50 dB Remained
90 dB Increased
90 dB Remained
n % p-value n % p-value n % p-value n % p-value
Loudness With training 2 29 0.074# 5 71 0.074# 2 29 0.001* 5 71 0.001*
Without training 11 69 5 31 15 94 1 6
Pitch With training 2 29 0.340 5 71 0.221 2 29 0.015* 5 71 0.001*
Without training 8 50 7 44 13 81 1 6
Strain With training 2 29 0.221 5 71 0.221 2 29 0.074# 5 71 0.036*
Without training 9 56 7 44 11 69 4 25
Speech rate With training 0 0 0.059# 6 86 0.033* 0 0 0.095# 6 86 0.033*
Without training 6 38 6 38 5 31 6 38
Articulatory precision
With training 0 0
0.036* 7 100 0.021* 1 14 0.106 6 86 0.106
Without training 7 44 8 50 8 50 8 50
effect by means of instruction and/or training with visual fee-dback(16,20). According to an experiment in which participants were separated into two groups (experienced in speaking in noisy situations group and inexperienced group), it was found that, when the instruction was provided, the experienced sub-jects had greater capacity to keep the vocal intensity constant, regardless of the noise. However, none of the groups was able to completely suppress the Lombard effect even when instructions were combined to visual feedback(20). Following the same line of research, another study with 27 choir singers evaluated the effect of instruction in the inhibition of the Lombard effect(16). The author concluded that instructions were effective to suppress the Lombard effect. Thus, singers can learn to resist and consciously regulate the automatic res-ponse of increasing the vocal intensity in noise. Therefore, in the present study, the findings of greater vocal control in the noise by the Study Group and especially by those who have had previous training, corroborate the data reported in literature, since the reporters, as well as singers, suffered interruption of auditory feedback by noise and needed to use other means for monitoring their voices.
In this study, there were no differences between the repor-ters’ work experience and changes in acoustic and perceptual vocal parameters. However, it was observed that previous audi-tory training contributed in some extent to inhibit the negative
consequences of the Lombard effect(16,20). Although there is no information about the type, frequency and duration of the training performed by these reporters, we observed that this feature might help to control vocal parameters in noise. Hence, further research is needed to identify the ideal techniques to inhibit or minimize the Lombard effect. These studies may benefit professionals who use their voices in noisy environ-ments, such as reporters, and therefore help to prevent vocal disorders arising from the use of voice in these environments.
CONCLUSION
In the presence of masking noise, reporters and non--reporters present changes in voice and speech production characterized by an increase in loudness, pitch, strain and articulatory precision, with major shifts in the non-reporters. Thus, professional voice users can minimize the negative con-sequences of the Lombard effect and maintain the stability of the emission when exposed to noise situations, probably due to activation of kinesthetic feedback pathways.
Reporters with previous auditory training demonstrate greater ability to suppress the Lombard effect, with minor changes in vocal parameters in the presence of noise. Work experience is not a determining factor for preserving vocal parameters in noisy situations.
RESUMO
Objetivo: Verificar e comparar a ocorrência das modificações vocais de repórteres e não-repórteres na presença de ruído mascarante. Métodos: Participaram 46 sujeitos, sendo 23 repórteres e 23 não-repórteres (grupo controle), todos com audição normal. Os partici-pantes deveriam ler um trecho de uma matéria de telejornal em três situações de escuta: sem ruído mascarante, com ruído de 50 dB, e com ruído de 90 dB. As narrações foram gravadas e submetidas à avaliação perceptivo-auditiva (realizada por uma fonoaudióloga especialista em voz) e análise acústica (medidas extraídas por meio do Software Voxmetria – CTS Informática). Resultados: Com 50 dB de mascaramento, houve maior aumento nos parâmetros pitch (82,6%), loudness (91,3%) e tensão (82,6%) no grupo controle, quando este foi comparado ao grupo dos repórteres. O mesmo ocorreu com ruído de 90 dB para os parâmetros pitch (95,7%), loud-ness (100%) e tensão (91,3%). Conclusão: As consequências negativas do efeito Lombard ocorrem em ambos os grupos, porém, pelas respostas apresentadas, os repórteres demonstram conseguir inibir parcialmente o impacto negativo das situações de ruído, por provável estabilidade da emissão profissional e ativação de outras vias de monitoramento.
Descritores: Voz; Qualidade da voz; Mascaramento perceptivo; Efeitos do ruído; Treinamento da voz; Percepção sonora
REFERENCES
1. Sapir S, McClean MD, Luschei ES. Effects of frequency-modulated auditory tones on the voice fundamental frequency in humans. J Acoust Soc Am.1983;73(3):1070-73.
2. Ferrand CT. Relationship between masking levels and phonatory stability in normal-speaking women. J Voice. 2006;20(2):223-8. 3. Mürbe D, Pabst F, Hofmann G, Sundberg J. Significance of
auditory and kinesthetic feedback to singers’ pitch control. J Voice. 2002;16(1):44-51.
4. Laukkanen AM, Mickelson NP, Laitala M, Syrjä T, Salo A, Sihvo M. Effects of hearFones on speaking and singing voice quality. J Voice. 2004;18(4):475-87.
5. Södersten M, Ternström S, Bohman M. Loud speech in realistic environmental noise: phonetogram data, perceptual voice quality,
subjective ratings, and gender differences in healthy speakers. J Voice. 2005;19(1):29-46.
6. Behlau M, Madazio G, Feijó D, Azevedo R, Gielow I, Rehder MI. Aperfeiçoamento vocal e tratamento fonoaudiológico das disfonias. In: Behlau M. Voz: O livro do especialista. vol 2. Rio de Janeiro: Revinter; 2005. p.409-564.
7. Lane H, Tranel B. The lombard sign and the role of hearing in speech. J Speech Hear Res. 1971;14:677-709.
8. Koufman JA. Approach to the patient with a voice disorder. Otolaryngol Clin North Am. 1991;24(5):989-98.
10. Kyrillos L. Voz na mídia (Televisão e rádio) In: Ferreira L, Befi-Lopes D, Limongi S. Tratado de fonoaudiologia. 1a ed. São Paulo: Roca; 2004. p.150-65.
11. Schultz-Coulon HJ, Fues CP. The Lombard reflex as a test of vocal function. HNO. 1976;24(6):200-4.
12. Lauer MC. Comportamento vocal diante do efeito Lombard em mulheres com disfonia funcional [dissertação]. São Paulo (SP): Centro de Estudos da Voz; 2006.
13. Schultz-Coulon HJ. The neuromuscular phonatory control system and vocal function. Acta Otolaryngol. 1978;86(1-2):142-53.
14. Ward WD, Burns EM. Singing without auditory feedback. J Res Sing. 1978;1:24-44.
15. Silva VS. O impacto vocal imediato do efeito Lombard na qualidade vocal: análise perceptivo-auditiva e acústica [monografia]. São Paulo (SP): Centro de Estudos da Voz; 2005.
16. Tonkinson S. The Lombard effect in choral singing. J Voice. 1994;8(1):24-9.
17. Coutinho SB, Diaféria G, Oliveira G, Behlau M. Voz e fala de Parkinsonianos durante situações de amplificação, atraso e mascaramento. Pró-Fono. 2009;21(3):219-24.
18. Siegel GM, Schork EJ Jr, Pick HL Jr, Garber SR. Parameters of auditory feedback. J Speech Hear Res. 1982;25(3):473-5.
19. Egan JJ. The Lombard reflex. Arch Otolaryngol. 1971;94(4):310-12. 20. Pick HL Jr, Siegel GM, Fox PW, Garber SR, Kearney JK. Inhibiting the
Lombard effect. J Acoust Soc Am. 1989;85(2):894-900.
21. Siegel GM, Pick HL Jr. Auditory feedback in the regulation of voice. J Acoust Soc Am. 1974;56(5):1618-24.
22. Ramig LO, Bonitati CM, Lemke JH, Horii Y. Voice treatment for patients with Parkinson’s disease: development of an approach an preliminary efficacy data. J Med Speech-Lang Pathol. 1994;2(3):191-209.