INDICES OF TRENDS OF CLIMATIC CHANGES FOR THE STATES OF THE BAHIA AND
SERGIPE BY MEANS OF DAILY PRECIPITACION INDICES AND ITS RELATION WITH SST’S
OF THE PACIFIC AND ATLANTIC
WINÍCIUS DOS SANTOS ARAÚJO AND JOSÉ IVALDO BARBOSA DE BRITO
Universidade Federal de Campina Grande, Departamento de Ciências Atmosférica (UFCG/ DAC), Campina
Grande, PB, Brazil
[email protected], [email protected]
Received April 2009 – Accepted June 2011
ABSTRACT
The objective of this study was to investigate statistically the precipitation variability in annual scale from the states of the Bahia and Sergipe using daily precipitation data. From that, indexes
of detection of climate changes were calculated to evaluate the relationship of the most signiicant indexes with the sea surface temperature (SST) anomalies of the Paciic and Atlantic oceans. The
daily precipitation data used were for a period of 45 years of 75 meteorological stations supplied by the old net of the SUDENE available in the DSA and data of the of the SST anomalies obtained from
NOAA. Inluence of SST of the Paciic and Atlantic oceans on the precipitation of the studied area
is evidenced. A decrease of CWD was veriied; increase was observed in the number days with rain; therefore, the amount of annual total precipitation increased. Several stations presented positive or negative tendencies in all examined indexes, consequently, they are also related to regional aspects.
Therefore, it is not possible to afirm that the climate alterations noted in the study area are due to
the global climate changes.
Keywords: RClimdex 1.9.1, climate changes, daily precipitation.
RESUMO: ÍNDICES DE TENDÊNCIAS DE MUDANÇAS CLIMÁTICAS PARA OS ESTADOS DA BAHIA E SERGIPE POR MEIO DE ÍNDICES PLUVIOMÉTRICOS DIÁRIOS E SUA RELAÇÃO COM TSM’S DO PACÍFICO E ATLÂNTICO
O objetivo deste trabalho foi estudar estatisticamente a variabilidade climática pluvial em escala anual dos estados da Bahia e Sergipe, por meio de dados diários de precipitação, e a partir disso, calcular
índices de detecção de mudanças climáticas e avaliar a relação dos mais signiicativos com as anomalias de temperatura da superfície do mar dos oceanos Pacíico e Atlântico. Foram utilizados dados diários
pluviais referentes a um período de 45 anos de 75 estações e/ou postos meteorológicos fornecidos pela antiga rede de postos da SUDENE, através do DCA e dados das anomalias de TSM obtidos através
da NOAA. Evidencia-se inluência da TSM dos oceanos Pacíico e Atlântico sobre a precipitação da região estudada. Veriicou-se uma diminuição de DUC; ocorreu acréscimo no número dias com chuva; portanto, o montante de precipitação total anual aumentou. Muitas localidades apresentaram
tendências positivas ou negativas em todos os índices examinados, conseqüentemente, estas também
estão relacionadas a aspectos regionais. Portanto, não é possível airmar que estas alterações climáticas
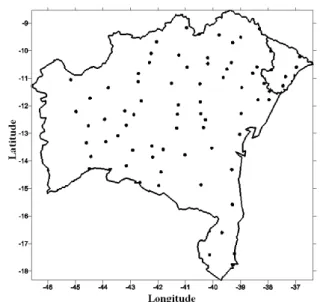
Figure 1 - Spatial distribution of rainfall stations in the geographical area of study.
1. INTRODUCTION
One of the most important issues in environmental discourses are the climatic changes. It is known that temperature,
precipitation, pressure and humidity luctuate in time and
space scale from seconds to tens of years and from millimeters to thousands of kilometers, respectively. Thus, the last one million years, drastic climate changes led the development of life worldwide. The climatology rescues these changes and
allows the scientiic community to evaluate how the climate
behaves over time.
There are several theories on climate change on the globe, most of them, the party that the origin of these changes can be caused by external factors such as changes in Earth’s orbital parameters, solar radiation intensity and rate of rotation Earth, geographic features such as distribution of land and sea: the composition of the atmosphere, particles of volcanic eruptions and the heat release due to human activities.
According Sentelhas et al. (2000), climatic conditions
on Earth luctuate continuously. Depending on the time scale in which we work this variability can view and deine what is climate change. The dificulties in the deinition of climate change occur for several reasons: dificulty in account for the effects of natural variability, dificulties with respect to changes in temperature
measurement techniques over time, inadequate distribution of
points and dificulties to model the climate. However, a series
of evidence reinforces global warming as a result of human action. The authors also predict that the rate of increase of CO2 at 1% per year, would promote a warming of 0.3°C per decade. Some consequences of climate change will affect the poorest societies in the world that are more dependent on water resources, of agricultural implements and are devoid of technology and capital to mitigate the destabilizing effects of climate (IPCC, 2007).
According to Ayoade (2003) the terrestrial reasons relate all kinds of changes to changes in conditions on the surface and atmosphere of Earth. Thus, the migration included polar, continental drift, changes in topography, variations in atmospheric composition, changes in water distribution and continental and variations in snow and ice
It is suggested, therefore, of this work, to examine if in
the local scale occurs signiicant changes in the trend of hydric
regimes based on daily rainfall as an indicator of long-term climate change. And, furthermore, to evaluate the relationship
of the most signiicant indices obtained with the anomalies of sea surface temperature of the Atlantic and Paciic and if you
can detect the tendency of water systems with different physical characteristics and intensive human intervention in two states of the Brazilian Northeast , Bahia and Sergipe, whose area is hereafter referred to as “study area”.
2. MATERIAL AND METHODS
The study area covers the states of Bahia (561,497 km2) and Sergipe (22,050 km2), totals approximately 40% of the Northeast, 7% of Brazil and makes up a large portion of the semiarid. This region is located between longitudes 46.59°W and 36.37°W, and the latitudes 18.32°S and 8.54°S (Figure 1).
We used daily rainfall data provided by the UACA (Academic Unit of Atmospheric Sciences), from SUDENE (Superintendence of Northeast Development) for the states of Bahia and Sergipe, however, they have proved inadequate and
lawed mostly being a necessary complement these with data
from the ANA (National Water Agency), DNOCS (National Department of Works Against Drought) and INMET (National Institute of Meteorology). After a detailed work of verifying the uniformity and quality of data, 75 stations were chosen in different cities, whose data cover a period of 45 years (1947 to 1991), have good quality, good spatial distribution and represent all meso-regions of the study area.
Table 1 shows the rainfall stations and/or the weather stations and their geographic coordinates that are used at work. These stations are spatially distributed in the study area as shown in Figure 1.
Data related to temperature anomalies in the Paciic and
Atlantic regions were obtained through the website of NOAA, www.cdc.noaa.gov/ClimateIndices/.
Although there are several indexes in the literature for daily precipitation in this research are used 11 indices (Table
2), deined ETCCDMI of 27 (Group of Experts on Monitoring
Table 1 -Location of 75 stations in the study area for the period 1947 to 1991.
Source: INMET (1991) and SEI/BA (1999)
RClimDex 1.9.1. Designed to provide a friendly interface it calculates the indices from daily data and generates results
based on the annual level, a ixed threshold value and other
percentiles. It is available on the free distribution of ETCCDMI (http://cccma.seos.uvic.ca/ETCCDMI/), and the DAC/UFCG.
Once processed, the indices were stored in spreadsheet
iles containing information about each annual.
In order to analyze the regional climate, there were correlations between the indices and the anomalies of sea surface temperature in the regions of Niño 1 +2 (0°S - 10°S, 90°W - 80°W), Niño 3 (5°N - 5°S, 150°W - 90°W), Niño 3.4 (5°N - 5°S, 170°W - 120°W), Niño 4 (5°N - 5°S, 160°E - 150°W), TNA (5.5°N - 23.5°N, 15°W - 57.5°W) and TSA (Eq. - 20°S, 10°E - 30°W)
Subsequently we applied the Student t test to analyze
statistical signiicance of correlations. To test application, we used the three highest levels of signiicance, t0.95; GL
corresponding to a statistically signiicant 90% (p<0.1), t0.975; GL corresponding to a statistically signiicant 95% (p <0.05)
and t0.995; GL corresponding to a statistically signiicant 99% (p <0.01) where GL = n-2 represents the degree of freedom for
n years, which in this case was 42, for the period considered was 1950 to 1991
3. RESULTS AND DISCUSSION
3.1 ETCCDMI the storm climate indices
Presents the results of the behavior of the trend of climate indices 11 rain, spatially distributed in 75 stations and/or rainfall stations, plotted using mapping software by kriging interpolation
method producing ields of trends over the states of Bahia and
Sergipe, which make up the geographical area of study. Stations Lat. Lon. Alt. Stations Lat. Lon. Alt.
Andaraí – BA -12.80 -41.33 386 Japaratuba - SE -10.60 -36.95 79
Araci - BA -11.33 -38.95 212 Jequié - BA -13.52 -40.05 150
Baianópolis - BA -12.72 -44.56 659 Juazeiro - BA -9.40 -40.50 371
Barra - BA -11.34 -43.82 402 Lençóis - BA -12.30 -41.30 439
Barreiras - BA -12.20 -45.01 439 Livram. do Brumado - BA -13.85 -42.20 700
Bom Jes. da Lapa - BA -13.08 -43.47 440 Malhada de Pedra - BA -14.38 -41.90 470
Brejolândia - BA -12.48 -43.95 531 Mascote - BA -15.56 -39.30 50
Campo Formoso - BA -10.60 -40.95 545 Medeiros Neto - BA -17.38 -40.13 180
Cansanção - BA -10.67 -39.50 359 Monte Santo - BA -10.43 -39.33 500
Caravelas - BA -17.74 -39.26 3 Mundo Novo - BA -11.85 -40.47 480
Carinhanha - BA -14.30 -43.77 473 Nazaré - BA -13.03 -39.03 35
Casa Nova - BA -9.17 -40.97 380 Oliv. dos Brejinhos - BA -12.31 -42.89 490
Chorrochó - BA -9.52 -38.99 380 Palmas de M. Alto - BA -14.16 -43.16 600
Cícero Dantas - BA -10.59 -38.39 420 Paramirim - BA -13.45 -42.23 593
Cocos - BA -14.27 -44.52 546 Paratinga - BA -12.70 -43.16 420
Condeúba - BA -14.88 -41.98 695 Paripiranga - BA -10.69 -37.86 430
Cont. do Sincora - BA -13.77 -41.03 286 Paulo Afonso - BA -9.21 -38.30 253
Coribe - BA -13.83 -44.47 658 Pedro Alexandre - BA -10.01 -37.89 320
Correntina - BA -13.33 -44.63 550 Pilão Arcado - BA -10.10 -42.26 470
Cotegipe - BA -11.72 -44.50 460 Prado - BA -17.34 -39.22 6
Curaçá - BA -9.43 -39.78 400 Própria - SE -10.22 -36.83 17
Esplanada - BA -11.78 -37.95 181 Queimadas - BA -10.97 -39.63 280
Estância – SE -11.27 -37.44 53 Remanso - BA -9.68 -42.06 400
Feira de Santana - BA -12.27 -38.97 257 Riacho de Santana - BA -13.60 -42.93 627
Form. do R. Preto- BA -11.05 -45.20 491 Ribeira do Pombal - BA -10.82 -38.54 228
Gentio do Ouro - BA -11.12 -42.73 490 Rio de Contas - BA -13.57 -41.82 1002
Guaratinga - BA -16.58 -39.68 324 Rio Real - BA -11.47 -37.93 220
Iaçu - BA -12.78 -40.35 249 Rui Barbosa - BA -12.28 -40.45 395
Ibitiara - BA -10.43 -42.32 460 Santana - BA -13.29 -43.91 450
Ibotirama - BA -12.18 -43.22 450 Senhor do Bonfim - BA -10.47 -40.19 558
Inhambupe - BA -11.78 -38.35 180 Sento Sé - BA -10.16 -41.25 380
Ipupiara - BA -11.82 -42.62 732 Uauá - BA -9.71 -39.29 439
Irecê - BA -11.18 -41.52 700 Ubaitaba - BA -14.30 -39.32 50
Itaberaba - BA -12.50 -40.28 250 Urandi - BA -14.77 -42.67 637
Itapicuru - BA -11.19 -38.13 153 Utinga - BA -11.96 -41.27 967
Itapor. d’ajuda - SE -10.94 -37.35 19 Vitória da Conquista - BA -14.85 -40.44 950
Jacobina - BA -11.20 -40.48 485 Xique-xique - BA -10.83 -42.72 403
Table 2 - Indexes of rain with their deinitions and their units.
ID Indicator name Definitions Units
Rx1day Max 1-day precipitation amount
Monthly maximum 1-day precipitation mm
Rx5day Max 5-day precipitation amount
Monthly maximum consecutive 5-day precipitation
mm
SDII Simple daily intensity index
Annual total precipitation divided by the number of wet days (defined as PRCP>=1.0mm) in the year
mm/day
R10 Number of heavy precipitation days
Annual count of days when PRCP>=10mm days
R20 Number of very heavy precipitation days
Annual count of days when PRCP>=20mm days
R50 Number of days above 50 mm
Annual count of days when PRCP>=nn mm, nn is user defined threshold
days
CDD Consecutive dry days Maximum number of consecutive days with RR<1mm
days
CWD Consecutive wet days Maximum number of consecutive days with RR>=1mm
days
R95p Very wet days Annual total PRCP when RR>95th percentile mm R99p Extremely wet days Annual total PRCP when RR>99th percentile mm PRCPTOT Annual total wet-day
precipitation
Annual total PRCP in wet days (RR>=1mm) mm
Note: RR is the amount of rainfall. By convention, the day is humid or rainy RR major or equal to 1.0 mm and
a dry day is rainy or not RR <1.0 mm.
Rx1day Rx5day SDII R10 R20 R50 CDD CWD R95p R99p PRCPTOT
Positives () 9 3 30 19 16 18 12 8 15 7 18
Negatives () 6 8 5 1 3 7 18 24 3 5 4
Total 15 11 35 20 19 25 30 32 18 12 22
Table 3 - Signiicant trends obtained for each index.
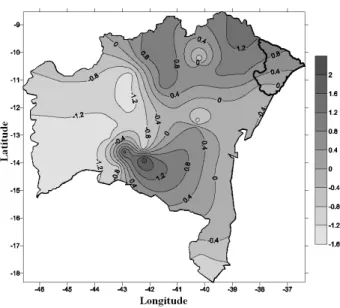
Figure 2 - Spatial distribution of trends of consecutive dry days (CDD) in days/year for the states of Bahia and Sergipe.
It is noteworthy that the maps presented, the results were spatially referenced according to geographic regions and
territories of identity deined by IBGE for analysis and were plotted only the values of locations with statistically signiicant
trends, namely those in which the value p was less than 0.1, while in Table 3 the number of positive and negative trends obtained for each index.
Figure 2 shows the ield for the trend in the number of
consecutive dry days (CDD), there was an increase in the trend (days/year) in the meso-region of south-central Bahia, covering areas such as the productive hinterland, Vitoria da Conquista and part south of the Chapada Diamantina, and the meso-region of north-central Bahia, mainly the valley areas of San Francisco, shallow Catherine Irecê, Sisal and Itaparica. The areas that showed decreased (CDD) have been the average San Francisco, west and extreme south of Bahia. Figure 2 also shows that for the two states as a whole there was no predominance of negative and positive trend.
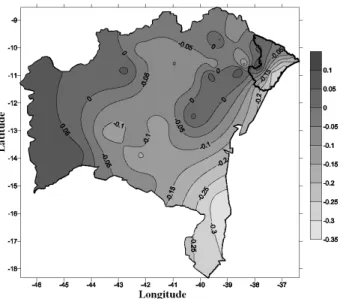
The ield of trend in the number of consecutive wet days
(CWD) is shown in Figure 3. It was found that, in general,
Figure 3 - Spatial distribution of trends of consecutive wet days (CWD) in days / year for the states of Bahia and Sergipe.
Figure 5 - Spatial distribution of trends in the number of days that precipitation was above 50 mm (R50mm), in days, for the states of Bahia and Sergipe.
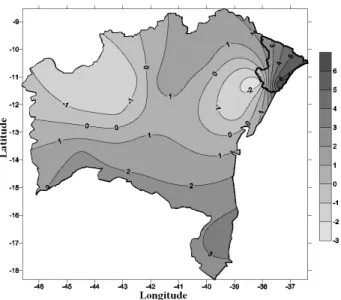
Figure 4 -Spatial distribution of trends in total annual rainfall (PRCPTOT) in mm for the states of Bahia and Sergipe.
increased CWD are practically concentrated in western Bahia and in isolated clusters in the northeast state of Bahia. These results differ from those reported by Haylock et al. (2005),
which for three seasons of the NEB identiied an increase in humidity conditions in this research; it was conirmed only in
the middle region of the western tip of Bahia. It should be noted that Haylock et al. (2005) did not use any city of Bahia and this may explain the discrepancies observed.
It is noteworthy that the 75 stations, 32 showed
signiicant change in the number of consecutive wet days
(CWD), showed an increase of 8 and 24 decreasedSince the
30 meteorological stations that showed signiicant change in the
number of consecutive dry days (CDD), 12 showed increases and 18 decreases.
Therefore, prevails in the study area decreased by CWD, while for DSC we can not say if dominate the increase or decrease in this index.
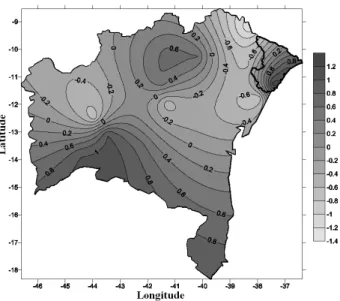
Analyzing the spatial trends in total annual precipitation rates (PRCPTOT) (Figure 4) and the number of days when rainfall was above 50mm (R50) (Figure 5) there is the occurrence of patterns of spatial homogeneity trend of both
indices. The index had 18 points PRCPTOT signiicant trend of
increase, decrease compared to 4, in turn, and the index values
18 of R50 also showed a signiicant tendency to increase while
7 indicated a decreasing trend.
From these results, for 22 stations with signiicant values
of PRCPTOT and 25 of R50, and making a display in its spatial distribution, we can infer that around the state of Sergipe and on the meso-regions as the center-north, far west and northeast of Bahia had their total annual rainfall and frequency of rainfall
above 50 mm increasing with time, while there was a decrease of PRCPTOT and 50mm in the regions of the valley of San Francisco, and in the extreme south of Bahia, especially in the territories of identity Irecê, Old Chico and south coast of Bahia, being that the latter meso-region is a major producer of cocoa in Brazil.
Figure 7 - Spatial distribution of trends in the number of very wet days (R20), in days, for the states of Bahia and Sergipe.
Figure 6 - Spatial distribution of trends in the number of wet days (R10), in days, for the states of Bahia and Sergipe.
values, and that the PRCPTOT index in 37 stations presented patterns in the trend growth. Likewise, Prudencio et al. (1999) investigating 32 rainfall stations in the state of Santa Catarina, with period of availability of data ranging from 1961 to 1995,
found a signiicant increase in total annual rainfall. In turn,
Haylock et al. (2005) noted increased PRCPTOT to South America, and Alexander et al. (2006) for the entire globe. The lack of studies involving rainfall in other areas of the Brazilian Northeast prevents other comparisons here.
For moderate rainfall rates (R10) and strong (R20), is observed by Figures 6 and 7, which was an increase in the number of days when rainfall was 10 mm and 20 mm, respectively. It appears that these rates have raised in virtually all areas of the two States, therefore, showed positive trends in 19
(of 20) and 16 (of 19) of which showed statistical signiicance,
respectively. The trend data show an increase in moderate rain (R10) and strong (R20) throughout the state of Sergipe and Bahia in large part, with occasional exceptions for R10, the Corrente River watershed which belongs to the meso-region of the far western of Bahia, and R20, the western Bahia, Irecê, and South Coast This indicates that while these territories there is a decrease in the frequency of these events, moderate and heavy rains in other areas analyzed have become more frequent during the 45-year period considered.
Positive trends were also obtained for the R95p index (Figure 8) in nearly every area covering two states, therefore, observed negative values of R95p in a few areas along the valley of San Francisco. While for R99p (Figure 9) showed negative rates in the northwest and northeast of Bahia. The R95p and R99p indices are related to extreme rainfall that characterize the
amount of rain in concentrated rainfall events that are indicative
of rains that produce looding of rivers and reservoirs. These
are the sum total rainfall in a year of 5% and 1% respectively of the rainiest days, that is, hard and extremely humid day, 15 (of 18) values for R95p positive trends, while, R99p offered
ive positive trends and seven negative trends. Since the R99p index showed only 12 signiicant values, any inference about
will be lacking in reason or argument that can diagnose a propensity to decay or not this event for the study area. But for R95p can say that much of the study area, especially the coast, experienced increase, and trends show spatial coherence with the index R50mm in relation to regions of the Old Chico, Corrente River basin and part of the interior of San Francisco, which belong to the meso-region of San Francisco Valley and cento-north of Bahia.
The trends mentioned above agree with those obtained by Haylock et al. (2005) who investigated the behavior of extreme rainfall in the period 1960-2000 for Brazil, Paraguay, Uruguay,
northern and central Argentina, inding wetter conditions for
the region and suggesting that the southeastern region of South America experienced increases in intensity and frequency of days with heavy rain, a result also found by Groissman et all (2005) for the same region, and consistent with those obtained in this research.
The ratio between the amount of total annual rainfall of rainy days and the number of rainy days, ie, the intensity index
Simple daily, showed the largest amount of signiicant igures, 35 in total, 30 of which were positive. By Figure 10, we ind an
Figure 9 - Spatial distribution of trends in extremely wet days (R99p), mm, for the states of Bahia and Sergipe.
Figure 8 - Spatial distribution of trends in very wet days (R95p), mm, for the states of Bahia and Sergipe.
Figure 10 - Spatial distribution of trends in daily intensity index Simple (SDII), mm / day, for the states of Bahia and Sergipe.
the Old Chico and the Wilderness of San Francisco and the region of Centro-south of Bahia, including the Chapada Diamantina and Jacuípe Basin.This does not set the same way for the index PRCPTOT the contrary, as the meso extreme south and west of Bahia which indicated a decrease in intensity daily experienced an increase in total annual precipitation, so these meso-regions to the total precipitation has increased, however there was a sharp increase in the frequency of rainy days per year, while for the rest of the region accompanied by increased precipitation decreased frequency of rainy days, so more intense daily predominant.
The two indices that express the intensity of maximum event, and Rx1day Rx5day, maximum amount of rainfall in one day (Figure 11) and 5 days (Figure 12) consecutive,
respectively, exhibit spatial coherence between them. The irst
index showed 9 (of 15) positive trends, while the second, third (from 11), which agrees with the patterns obtained for CWD negative trends, which saw much of a negative trend values (24) therefore decrease substantially consecutive wet days, while maximum rainfall events occasionally occur, as can be seen in the spatial index SDII. It was observed that the negative trends for the index Rx1day concentrated only in the regions of the northeast, south and central parts of western Bahia. Like the
sum of the locations of signiicant observed for the R99p index
(12), it is not possible to state categorically that the trends of the index Rx5day (11) represent faithfully such rainfall events for the study area.
According to studies by Prudencio et al. (1999) and Berlato et al. (1995), it appears that many of climate changes have a regional or local nature, not related directly to global climate change. Has knowledge that: increasing urbanization, paving streets, concentration of industries, factories, steel mills, along with other factors, give rise to so-called “heat islands” that are local and regional effects, and may favor an increase in positive surface temperature and thus the atmosphere. Given this, following these precepts, we cannot state categorically that the trends observed in this study to the states of Bahia and Sergipe are tied to global climate change, however, a
possible set of elements, such as ires, rampant deforestation,
Figure 11 - : Spatial distribution of trends in the Maximum amount of rainfall in one day (Rx1day) in mm for the states of Bahia and Sergipe.
Figure 12 - Spatial distribution of trends in the Maximum amount of rainfall for ive consecutive days (Rx5day) in mm for the states of Bahia and Sergipe.
are observed trends of opposite sign, thus demonstrating that there is a predominance of the same conduct. Although they are found an increase in precipitation for the two states, a result also reported by Santos and Brito (2007) for the states of Paraiba and Rio Grande do Norte, research in neighboring states and to Pernambuco showed a decrease in precipitation (De Paula and Brito, 2008). Like most indices do not show trends mainly of the same sign, it follows that they are more linked to regional or local climate variability, however, is not ignoring global
inluence.
Importantly, there were profound changes in local ecosystems of the study area. According to Carvalho Junior (1999), the ravages of the years 50 and 60, such as that caused
the extinction of the jacaranda in southern Bahia, the ires in
the Chapada Diamantina region in 80 years, and deforestation of the cerrado vegetation in western Bahia to make way for expansion of agricultural production, mainly from soybeans, are factors that make reference to environmental degradation. In Recôncavo, fertile black clay soils, navigable rivers and possible climate, crop growth of cane sugar, tobacco and cassava. This area, from the 1950s, began to undergo profound changes, due to the expansion of the activities of Petrobras, linked to oil exploration, which began with the installation of Landulpho Alves, Mataripe, followed by the deployment of Aratu Industrial Center - CIA in 60 years, and the Northeastern Complex - COPEC at the end of 70 years, this has contributed to the rapid formation of condensation nuclei due to excessive release of solid particles in the atmosphere, increasing precipitation (Diniz, 1996). Therefore, these factors are indicative of anthropogenic climate changes that produce
local and that can have negative effect on the local environment with actions produced by greenhouse gases, deforestation and mismanagement of ecosystems.
3.2 Relationship between climatic indices and SST’s
The Brazilian Northeast has its climate variability associated with patterns of variation on a global scale. Such patterns are associated with thermal oscillations of
the Paciic and Atlantic Oceans. In the Paciic Ocean, the
climate phenomenon El Niño causes periodic variations and
luctuations in seasonal and interannual scales, resulting from
the interaction between the ocean and atmosphere. In turn, the tropical Atlantic Ocean is characterized by strong seasonal cycle which is mainly manifested by the displacement of the southern Intertropical Convergence Zone (ITCZ). The period of evolution and characteristics of the ITCZ and the seasonal sea surface temperature (SST) depend on the dynamic coupling between them and the contrasts between land-sea that are not yet fully understood.
Having founded on the relevance of the association between climate and the thermal behavior of the northeast
Paciic and Atlantic oceans, it is important to quantify and
evaluate the relationship between climate indices, as found, with the anomalies (positive and negative) SST. Aiming to achieve this goal, we proceeded to a correlation between the six most
signiicant climate indices for the region studied (CDD, CWD,
PRCPTOT, R10, Rx5day, SDII) and SST anomalies in the
regions: Niño 1 +2, Niño 3 , Niño 3.4, Niño 4 on the Paciic ,
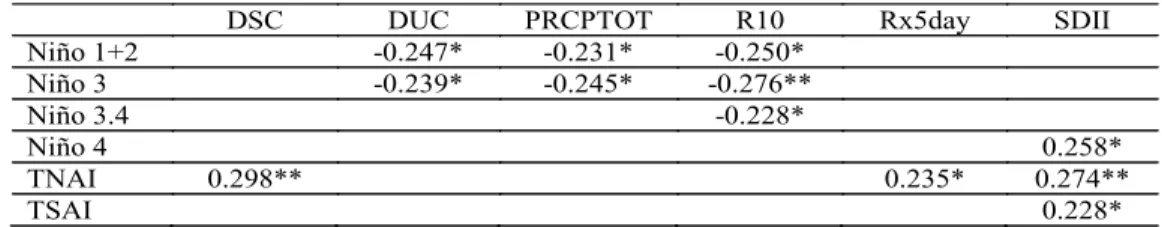
Table 4 - Correlations between rainfall and SST anomalies.
(*) Statistical Signiicance de 90% (p<0.01) (**) Statistical Signiicance de 95% (p<0.05)
DSC DUC PRCPTOT R10 Rx5day SDII
Niño 1+2 -0.247* -0.231* -0.250*
Niño 3 -0.239* -0.245* -0.276**
Niño 3.4 -0.228*
Niño 4 0.258*
TNAI 0.298** 0.235* 0.274**
TSAI 0.228*
It is noteworthy that there is no correlation was obtained between the climate indices (CDD, CWD, PRCPTOT, R10,
Rx5day, SDII) and indices of SST anomalies in the Paciic and Atlantic regions less than 99% statistical signiicance.
As Table 4 shows the CDD index showed signiicant
correlation only for the Atlantic region, trends showing the highest
correlation with the conditions of TNAI (95% signiicance).
However, the CWD index showed statistically significant
correlations only for the Paciic region, with the conditions of the Niño 1 +2 (90% signiicance) and Niño 3 (90% signiicance).
As in the CWD index, indexes PRCPTOT and R10
showed negative correlations to the Paciic Niño 1+2 (90% signiicance for both) and Niño 3 (90% and 95% signiicance,
respectively). Besides these, the R10 index also showed a
negative correlation to the Niño 3.4 region (90% signiicance).
In Table 4, the indices that represent extremes of rainfall and rainfall intensity, Rx5day and SDII, respectively, showed positive correlations with the region TNA, Atlantic (90% and
95% signiicance, respectively). For index SDII signiicant
correlations were obtained with the south-north thermal gradients in the Atlantic Ocean and the Niño 4 area of the
Paciic. Strangely, the correlation is positive both among and
between SDII and TSAI and SDII and between TNAI (Table 4), as well as between SDII and Niño 4 area, because in general we
expect a dipole ield coniguration of correlations between the
precipitation Northeast and the SST anomalies in the tropical
Atlantic (Moura and Shukla, 1981; Philander, 1990; Hastenrath
e Greischar, 1993. However, most of the work on the subject at hand used as input data the rains of the northern portion of the Northeast. In this work we used information from the south, the rainy season which occurs in the time of the year other than
the north. This can lead to conlicting results, since most of the
rainfall in Bahia depends on the penetration of southern frontal systems, which may have its spread toward the sub-equatorial region facilitated the ITCZ being positioned farther north.
Good correlations with a signiicance level equal to
95% for the indexes that represent the number of consecutive dry days (CDD) and intensity of daily rainfall (SDII) for the North Atlantic region, as well as the good correlation of 95%
signiicance level for the index R10 Niño 3 region of the Paciic
can be explained by SST anomalies in these regions, with the performance of ENSO, for example. Philander (1990) and
Moura et al. (2000) showed the great inluence of ENSO on
climate in different parts of the globe, including the Tropical Atlantic Ocean and the NEB.
Figures 13 to 24 represent the temporal variability of
the indices and the regions of the Paciic and Atlantic. It is noteworthy that, as shown in igures, was chosen as the lower limit time of the year 1950, due to insuficient reliable data older,
the period of analysis for the indices is 42 years, ie 1950 to 1991, while that is for the ocean regions from 1950 to 2005, this is due to lack of data updated daily rainfall for the area studied, and research interest is the possible correlation between variables
concomitant data, in addition, the correlation coeficients are
presented within the limits of Table 4 and are added to each graph the respective trend lines.
Figure 13 shows the temporal variability of the index TNAI and the index CDD and according to the same, one can
observe a positive correlation (r = 0,298), identifying that an
increase in positive anomaly of SST in the Tropical North Atlantic contributes to increased the number of consecutive dry days, because heating the Tropical North Atlantic Ocean favors the displacement of the ITCZ and the frontal systems to the south by inhibiting the formation of rain over the study area, increasing the number of consecutive dry days.
In Figures 14 and 15 shows the temporal variability index
CWD with two distinct regions of the Paciic Ocean, the regions
Niño 1+2 and Niño 3, respectively. For each of the correlations,
That the index quantiies the number of consecutive wet days Showed negative correlation coeficients for the two regions, r = -0,247, for region the Niño 1+2, r = -0,239 for region the
Niño 3, this shows that the these temperature rises the oceanic regions, the implicit decrease in the number of days consecutive that tt rains over 1mm in the study area.
For index PRCPTOT was identified statistically
signiicant correlations only for the regions of the Paciic, were negative in the Niño regions 1+2 (r = -0231) and Niño 3 (r =
Figure 13 - Temporal variability indices TNAI and CDD (r = 0.298).
Figure 14 - Temporal variability index CWD and anomalies Niño 1 +2 (r = -0.247).
Figure 15 - Temporal variability index CWD and anomalies Niño 3 (r = -0.239).
Figure 17 - Temporal variability index PRCPTOT and anomalies Niño 3 (r = -0.245)
Figure 18 - Temporal variability index R10 and anomalies Niño 1 +2 (r = -0.250). Similarly, the R10 index reveals signiicant negative
correlations for the same regions of the Paciic, Niño 1+2 (r = -0,250) and Niño 3 (r = -0,276), and the Niño 3.4 region (r =-0,228) represented in Figures 18, 19 and 20, respectively.
These correlations that identify such relationships are inversely proportional in these regions have a direct relationship in rainfall above 10 mm over the study area, which is positive
thermal variation in the Paciic Ocean, causes a decrease in
moderate rainfall events, and therefore the amount total annual precipitation.
On the other hand, for indices Rx5day and SDII, revealed a better correlation with the Atlantic Ocean. While the index
that quantiies the accumulation of rainfall in ive days showed statistically signiicant correlations with the region TNA (r =
Figure19 - Temporal variability index R10 and anomalies Nino 3 (r = -0.276).
0,235) as can be seen in Figure 21, the daily intensity index also showed correspondence with the regions to the north Atlantic
and south, TNA (r = 0,274) and TSA (r = 0,228), respectively
shown in Figures 22 and 23. SDII index still indicates a
correlation with the Niño 4 region (r = 0,258) of the Paciic
Ocean as shown in Figure 24.
4. CONCLUSIONS
The approach of this study was the statistical analysis of observations of rainfall from daily data rates, aiming at the detection of possible climate change in the area searched.
Figure 20 - Temporal variability index R10 and anomalies Niño 3.4 (r = -0.228).
Figure 21 - Temporal variability index Rx5day and TNAI, (r = 0.235).
Figure 22 - Temporal variability index SDII and TNAI, (r = 0.274).
(I) climate change occurred in the states of Bahia and Sergipe, as indicated by the trends in behavior of the total daily rainfall, due to variations in local climate, regional and
possibly global;
(II) in general, a decrease of CWD predominates, there was increase in the number of days with rain, and those with greater intensity can be calculated as a daily increase in number of days when rainfall was above 10 mm, 20 mm and 50 mm and therefore increase the amount of annual rainfall. Areas with
increased CWD are practically conined to the west of Bahia and in isolated clusters in the northeast of Bahia;
(III) climate change occurring in the area surveyed, with respect to the variable weather precipitation, suggest that are due to changes in global climate, however, claim that injunction can not validate it categorically, since many localities showed
positive trends or negative for all indices examined, therefore,
these are also linked to regional aspects;
(IV) the tendency of consecutive dry days showed
signiicant correlations with the conditions of the northern
tropical Atlantic, as well as indexes that represent the
accumulated rainfall in ive days and the daily intensity of
rainfall. However, to compute the indexes that consecutive wet days, the amount of annual rainfall and moderate rain, showed
statistically signiicant correlations with the regions of Niño 1 +2, Niño 3 and Niño 3.4 in the Paciic. The daily intensity index also showed a correlation Niño 4 (Paciic) and northern (Atlantic). This highlights the inluence of SST in the Atlantic and Paciic Oceans on precipitation in the studied region, thus
identifying that the role of ENSO and the dipole of the Atlantic
Figure 23 - Temporal variability index SDII and TSAI, (r = 0.228).
Figure 24 - Temporal variability index SDII and anomalies Niño 4 (r = 0.258).
5. ACKNOWLEDGMENTS
Thanks to CAPES for financial support, and the anonymous reviewers for their contribution to the work.
6. REFERENCES
ALEXANDER, L. V., X. ZHANG, T. C. PETERSON, J. CAESAR: Global Observed changes in daily climate extremes of temperature and precipitation, Geophys. Res Letters, 33, L03706, doi: 10.1029/2005GL024954, 2006. AYOADE, J. O. Introduction to Climatology for the Tropics.
9 th ed. Rio de Janeiro: Bertrand Brazil, 2003.
BERLATO, M. A., FONTANA, D. C., BONO, L. Time trend in annual rainfall in the state of Rio Grande do Sul. Brazilian Journal of Agrometeorology, Santa Maria, v.3, p.111-113, 1995.
CARVALHO JÚNIOR, C. V.; V. A. COUTO FILHO; G. B. MACHADO: News, views and challenges for rural areas of Bahia. In: Superintendent of Economic and Social Studies of Bahia. Bahia 2000. Salvador: SEI, 1999. p.23-77. DE PAULA, R. K., J.I.B BRITO: Indicators of climate
change, surface vegetation, Drought and Desertiication: A
Case Study for the State of Pernambuco. In: V Congress on Scientific Initiation UFCG of Campina Grande. PROCEEDINGS: CD-ROM, Campina Grande, 2008. DINIZ, C. C., M. A. CROCCO: Economic restructuring and
regional impact: the new map of the Brazilian industry. New Economy, Belo Horizonte, v.6, n.1, jul. 1996.
GROISMAN, P., KNIGHT, R., EASTERLING, D., KARL, T., HEGERL, G., RAZUVAEV: Trends in intense precipitation in the climate record. In Press, Journal of Climate. v.4, n.8, p.45-51, 2005.
HASTENRATH, S., L. GREISCHAR: Further work of Northeast Brazil rainfall anomalies, Journal Climate, v.6, n.12, p.743-758, 1993.
HAYLOCK R. M., T. PETERSON, J. ABREU DE SOUSA R., ALVES L. M., T. AMBRIZZI: Trends in total and extreme South American rainfall 1960-2000 and links with sea surface temperature. Journal of Climate, v.19, p.1490-1512, 2005.
INTERGOVERNMENTAL PANEL ON CLIMATE CHANGE (IPCC). Climate change 2007: the physical science basis summary for policymakers. [S.l.], 2007a. Contribution of Working Group I to the Fourth Assessment Report of the Intergovernmental Panel on Climate Change.
MOURA, A. D., J. SHUKLA: On the dynamics of droughts in Brazil northeats: Observation, theory, and numerical experiments with a general circulation model. Journal Atmospheric Sci, v.38, p.2653-2675, 1981.
MOURA, G. B., J. O. R ARAGON, F. F. LACERDA, J. Z. PASSAVANT: O. Relationship between rainfall in the eastern sector of the Northeast of Brazil and Surface
Agricultural and Environmental Engineering, v. 4, No 2, p. 247-251, 2000.
PHILANDER, S. G.: El Niño, La Niña, and the Southern Oscillation. Academic Press. San Diego, 311p., 1990. PRUDENCIO, R. S., R. GEREMIA, R. W. V. STAG: Analysis of
rainfall rate from the coast of Santa Catarina. In: CONGRESS INTERNATIONAL OF THE AGROMETEOROLOGY, 11., 1999, Florianópolis. Proceedings ... Florianópolis: Brazilian Society of Agrometeorology, P. 1055-1063, 1999. SENTELHAS, P. C., PEREIRA, A. R., ANGELOCCI, L. R. Agricultural meteorology, 3rd edition, Piracicaba: Escola Superior de Agricultura Luiz de Queiroz, 2000.
SANTOS, C. A. C. Estimates and Trends Index Climate Change Detection based on rainfall in Rio Grande do Norte and Paraíba, 2006, p. 98, Dissertation (Masters in Meteorology), Federal University of Campina Grande, Campina Grande, 2006.