T. Michalski
This article analyses the natural popula-tion increase (decrease) in the post-commu-nist part of Baltic Europe (the federate state of Mecklenburg-Western Pomerania, West Pomeranian, Pomeranian, and Warmian-Ma-surian Voivodeships, Lithuania, Latvia, Esto-nia, the Kaliningrad and Leningrad region, and the federal city of Saint Petersburg) in 2002—2011. The study uses standard me-thods of demographic analysis, the data pro-vided by national statistical services and Eurostat. All regions analysed are characte-rised by a low stationary phase of the demo-graphic transition model (DTM). The situa-tion proves to be unfavourable in the Polish regions under consideration and highly un-favourable in the remaining area.
Key words: Baltic Europe, natural inc-rease/decrease
Introduction
Political transformations in Central and Eastern Europe [3; 4; 10; 56], econo-mic transition [5; 8; 12; 42; 46; 49] and social changes [1; 7; 22; 48] had a consi-derable impact on the demographic [18; 28; 32; 35; 37; 38; 45] and health condi-tion [35; 36; 41; 56] of the residing popu-lation. The system transformation pro-cess, following the disintegration of the communist system, can be divided into two stages.
The first period covers the years 1990 to 2003 (from the establishment of the first non-communist government in this part of Europe to the accession of the first eight post-communist countries1 to the European Union).
The second period covers the years from 2003 to contemporary times.
The study analyses similarities in the rate of natural increase (RNI) in the se-cond period of transformation. The ana-lysis refers to the southern and south-east
1
Passing over the fact of Federal Republic of Germany absorbing the German De-mocratic Republic.
NATURAL INCREASE IN THE BALTIC SOUTH AND SOUTH-WEST
T. Michalski
**
University of Gdańskq
1A, Jana Bażyńskiego, Gdansk, Poland
Submitted on March 7, 2014.
coast of the Baltic Sea, which used to be part of the socialist system. The di-vision of the area into NUTS-2 in the case of European Union countries was considered best suitable for the study and similar size units were adopted for the Russian Federation. In effect 10 regions were identified (fig. 1):
One region in Germany (Federation of Lands: Mecklenburg-Western Pomerania 2 (earlier — part of the German Democratic Republic).
Three regions in Poland (Voivodships3: West Pomerania, Pomerania, Warmian-Masurian — this administrative division has been in force since the beginning of 1999.
Three independent states, with the entire population embraced by the study (Lithuania, Latvia, Estonia — were in the past part of the Union of Soviet Socialist Republics (USSR).
Three regions in the Russian Federation (two oblasts: Kaliningrad and Le-ningrad and one federal city Saint Petersburg4 — in the past — part of the USSR). The study covers a period of 10 years: starting from 2002 (i.e. the last year before the accession of Poland, Lithuania, Latvia, Estonia to the Euro-pean Union) to the year 2011 (the last year for which full statistical data we-re available).
0 100 200 400 km
GERMANY:
1 - Mecklenburg-Western Pomerania
POLAND:
2 - West Pomeranian Voivodship 3 - Pomeranian Voivodship 4 - Warmian-Masurian Voivodship
6 - LITHUANIA
7 - LATVIA
8 - ESTONIA
RUSSIAN FEDERATION: 5 - Kaliningradskaya Oblast 9 - Leningradskaya Oblast 10 - Sankt-Petersburg
Russian Federation
Poland Germany
Finland
Denmark Belarus
1 2
3 4
5 6
7 8
9 10
Fig. 1. Area under study Source: Own study.
2
We can also come across a German liaised name: Mecklenburg-Vorpommern.
3
This is a direct translation from the Polish language, we can also come across the term: provinces.
4
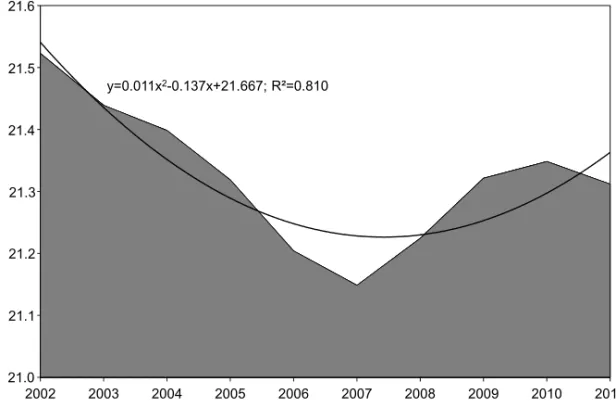
The statistical data used in the study came from three websites [13—15]. The average population in the Baltic Europe post-communist countries co-vered by the study reads 21324 thousand5. The period 2002—2011 showed minor fluctuation6 with the greatest oscillation in Latvia (%RSD=3.51%), and the smallest in Estonia (%RSD=0.48%). Figure 2 presents these changes. We can see that a clear population drop was noted in the period 2002—2007 (from 21523 thousand to 21149 thousand) followed by a slight rising trend reaching its maximum in 2010 (a population of 21348 thousand). These changes can be accurately described by the equation: y=0.011x2 – 0.137x+
+21.667 (R2=0.810).
y=0.011x2-0.137x+21.667; R²=0.810
21,0 21,1 21,2 21,3 21,4 21,5 21,6
2002 2003 2004 2005 2006 2007 2008 2009 2010 2011 21.1
21.6
21.5
21.4
21.3
21.2
21.0
Fig. 2. Changes in population in the studied area in the years 2002—2011
Source: Own study based on dispersed data.
Changes in the rate of natural increase
The arithmetic average rate of natural increase in the years 2002—2011 fluctuates from 2.6% in the Pomeranian Voivodship to 10.2% in the Leningrad Oblast. As figure 3 shows, the average positive rate of natural increase is noted only in the Polish regions with a negative rate in the remaining area. This reflects the situation when viewed in terms of countries and not regions. Only in Poland (as a whole) the average rate of natural
5
This is the arithmetic mean of the years 2002—2011.
6
increase in the years 2002—2011 was positive, whereas Germany and the Russian Federation (and the states of the Baltic Assembly) experienced a na-tural decrease. In terms of stability the greatest fluctuation in nana-tural increase rate appeared in Estonia and in the Russian regions.
Fig. 3. Average natural increase [per 1000 persons] in the years 2002—2011
Source: Own study based on dispersed data.
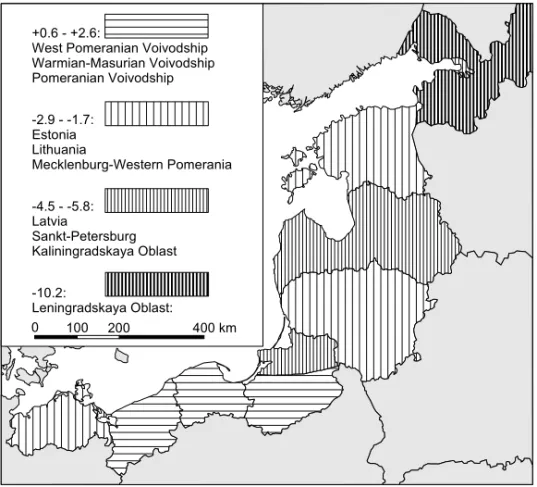
By applying Hellwig’s critical gap method [23] the analysed group of re-gions was divided into four groups varying in terms of the natural increase rate in the period 2002—2011. The results of the classification are given in fig. 4.
Looking at the map (fig. 4) no clear spatial regularities can be noted. Though in the areas dominated by Poles the natural increase rate was positive and in the areas inhabited by Russians the situation was the worst (three re-gions in the Russian Federation and Latvia inhabited by a numerous Russian diaspora), the latter should not be interpreted as the major cause of this state.
0 100 200 400 km +0.6 - +2.6:
West Pomeranian Voivodship Warmian-Masurian Voivodship Pomeranian Voivodship
-2.9 - -1.7: Estonia Lithuania
Mecklenburg-Western Pomerania
-4.5 - -5.8: Latvia
Sankt-Petersburg Kaliningradskaya Oblast
-10.2:
Leningradskaya Oblast:
Fig. 4. Average natural increase [per 1000 persons] in the years 2002—2011 — spatial dimension
Source: Own study based on dispersed data.
Leningradskaya Oblast West Pomeranian Voivodship Warmian-Masurian Voivodship
Lithuania Latvia
Mecklenburg-Western Pomerania
Estonia
Kaliningradskaya Oblast
Pomeranian Voivodship Sankt-Petersburg
type A type B
type C
type D
Fig. 5. Similarities in natural increase changes in the years 2002—2011.
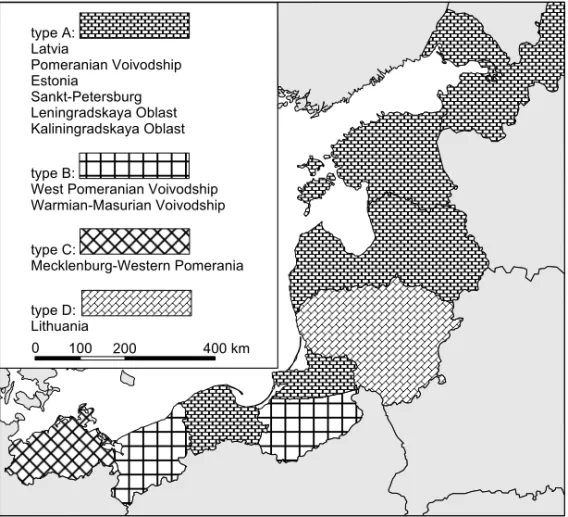
The next three figures present the population trends expressed by regres-sion analysis, according to three types attributed to the studied regions. The regressions analysis was not calculated when the coefficient of determination fell below 0.800.
0 100 200 400 km type A:
Latvia
Pomeranian Voivodship Estonia
Sankt-Petersburg Leningradskaya Oblast Kaliningradskaya Oblast
type B:
West Pomeranian Voivodship Warmian-Masurian Voivodship
type C:
Mecklenburg-Western Pomerania
type D: Lithuania
Fig. 6. Similarities in natural increase changes in the years 2002—2011 — spatial dimension
Source: Study based on fig. 5.
Regions classified as type A (fig. 7) featured slow gradual growth in na-tural increase. Looking at the variability of nana-tural increase rates we can note that in the Pomeranian Voivodship and Latvia the increase was poor, sliding down in 2008 to a weak falling trend. In the case of three regions which are part of the Russian Federation, we can see a clear rising trend. The inter-mediate state between these two subgroups in the regions classified as type A is represented by Estonia showing a rising trend which is slowly dying out (in 2011 compared to 2010 we can even see the signs of a falling tendency).
Estonia: y=-0.0405x2+0.910x-5.105;
R²=0.97
Kalininigradskaya Oblast: y=0.061x2+0.246x-9.538; R²=0.91
Leningradskaya Oblast: y=0.067x2+0.072x-13.138; R²=0.97
Sankt-Petersburg: y=0.062x2+0.186x-8,682;
R²=0.99
-14 -12 -10 -8 -6 -4 -2 0 2 4 6
2002 2003 2004 2005 2006 2007 2008 2009 2010 2011
Latvia Pomeranian Voivodship
Fig. 7. Changes in natural increase [per 1000 persons] in regions classified as type A in the years 2002—2011
Source: Own study based on dispersed data.
-1 0 1 2 3
2002 2003 2004 2005 2006 2007 2008 2009 2010 2011 West Pomeranian Voivodship
Warmian-Masurian Voivodship
Fig. 8. Changes in natural increase [per 1000 persons] in regions classified as type B in the years 2002—2011
Source: Own study based on dispersed data.
In Lithuania the natural increase change process seems to be the most complicated. The initial period did not note any changes in the natural in-crease rate but was followed by a drop that that in 2007 showed strong growth, next followed by a decrease in the population rate.
Mecklenburg-Western Pomerania (type C): y=-0.020x2+0.125x-2.873; R²=0.82
-5 -4 -3 -2 -1 0
2002 2003 2004 2005 2006 2007 2008 2009 2010 2011
Lithuania (type D)
Fig. 9. Changes in natural increase [per 1000 persons] in regions classified as type C and D in the years 2002—2011
Source: Own study based on dispersed data.
Table 1 presents the results of an earlier study based on average natural increase rate (Hellwig’s method [23]) and changes in natural increase (according to Mc Quitty’s method [52]). Figure 10 shows the spatial aspect of the results.
Table 1
Synthetic assessment of natural increase rate in the years 2002—2011
Types of changes in natural increase rate Natural
increase level A B C D
Positive Pomeranian Voivodship
West Pomeranian Voi-vodship,
Warmian-Masurian Voivodship
Negative Estonia
Mecklenburg-Western Pomerania
Lithuania
Very negative Latvia,
Saint Petersburg, Kaliningrad Oblast Extreme
negative
Leningrad Oblast
0 100 200 400 km Natural increase/decrease:
+0.6‰ - +2.6‰
-2.9‰ - -1.7‰
-4.5‰ - -5.8‰
-10.2‰
Types of changes: ... A
A
A
A
A
A A
B
B C
D
Fig. 10. Synthetic assessment of natural increase rate in the years 2002—2011
Source: Own study based on dispersed data.
Summary
Thus, we can see that the natural increase rate in most of the studied areas was not favourable. Though the transformation of the natural increase rate fits to the theory of second demographic transition [53; 55], the changes are much more detrimental in the entire area than the model indicated, with the exception of the Polish regions.
The reason underlying the situation may be related to the negative impact on the population of the system transformation costs [39]. The impact of these costs is twofold. The entire studied area shows a drop in the number of live births. This phenomenon is typical for all European post communist countries and results from changing traditions [11; 17; 45; 51]. Furthermore, the Russian part of the studied area experiences higher death rate resulting from the adopted life style and lower medical care standards [9; 43; 54; 58].
and the Baltic Assembly States (emigration of Russian speaking population to Russia) [6; 19; 20; 21; 26; 29; 50]. But following European expansion in 2003 migration covered almost the entire area changing both the direction and cause of migrating. The migration dominating today is economy driven and targets at the countries of the “old” European Union [60]. However, the present economic crisis induces initiatives towards inhabiting the internal free flow of people in the European Union [30]. The direction of migration in the Russian part of the studied area differs from that of the other regions. This is because the south and south east regions of Baltic Europe, which be-long to the European Union, are among its poorest parts. Whereas the south and south east parts of Russian Baltic Europe are among the richest in the Russian Federation.
The consequences of the negative demographic transformation, inclu-ding the falling natural increase rate mean ominous changes in the demogra-phic situation of the population inhabiting the analysed region, expressed by, among others, progressively aging society. Demographic forecasts project further population decrease in the majority of the regions. For example, the demographic forecasts for Estonia assume that in 2050 the population will read approx. 993.5 thousand7 [31]. An exception to this rule is the Pomera-nian Voivodship with forecasts for the year 2035 of up to 2262.8 thousand compared to 2210.9 thousand in 2007, which means a growth rate of 102.4% compared to 2007 [47].
These adverse trends may in the near future inhibit economic develop-ment of the studied regions due to shortage of labour force on one hand and financial burdens of aging society on the other.
References
1. Ágh, A. 1999, Processes of democratization in the East Central European and Balkan states: sovereignty-related conflicts in the context of Europeanization, Com-munist and Post-ComCom-munist Studies, Vol. 32, p. 263—279.
2. Anisiewicz, R. 2006, Changes in fertility and nuptiality in the post-soviet part of Baltic Europe, In: Michalski, T. (ed.) The Geographical Aspects of the Transfor-mation Process in Central and East-Central Europe, Gdynia; Pelplin, p. 45—57.
3. Antoszewski, A. (ed.), 2006, Systemy polityczne Europy rodkowej i Wschod-niej. Perspektywa porównawcza, Wrocław.
4. Antoszewski, A., Herbut, R. (eds.), 1997, Demokracje Europy rodkowo-Wschodniej w perspektywie porównawczej, Wrocław.
5. Bąk, M. 2006, Europa rodkowa i Wschodnia wobec wyzwania transforma-cyjnego, Gdańsk.
6. Bauls, A. 1998, Changes in the migration of the population in Latvia over 1991—1996. In: Szymańska, D. (ed.), Ruchliwo ć przestrzenna ludno ci w okresie przemian ustrojowych, Toruń, p. 165—170.
7. Borowik, I., Babiński, G. (eds.), 1997, New Religions Phenomena in Central and Eastern Europe, Kraków.
7
8. Cipko, A. 2004, Razmyšleniâ o prirode i pričinah kraha postsovetskogo libe-ralizma, Vestnik Analityki, no. 3(17), p. 4—24.
9. Cockerham, W. C. 2000, Health lifestyles in Russia, Social Science & Medi-cine, no. 51, p. 1313—1324.
10. Complak, K. (ed.), 2002, Europa Wschodnia — Ameryka Łacińska. Pozycja jednostki i system rządu, Wrocław.
11. Cubbins, L. A., Szaflarski, M. 2001, Family effects on self-reported health among Russian wives and husbands, Social Science & Medicine, no.53, p. 1653— 1666.
12. Dubauskas, G. 2003, Euro Atlantic Integration and Foreign Banks in Transi-tional Economies, Tiltai, no. 4 (25), p. 13—22.
13. European health for all database (HFA-DB) at World Health Organization Regional Office for Europe, available at: http://www. euro. who. int/en/home (ac-cessed: 12.01.2014).
14. Eurostat database, available at: http://epp.eurostat.ec.europa.eu/portal/page/ portal/eurostat/home/ (accessed: 12.01.2014).
15. Federal State Statistics Service Russian Federation database, available at: <http://www.gks.ru/> (accessed: 12.01.2014).
16. Fiedorow, G. M., Kornirjewiec,W. S., Zwieriew, J. M. 2007, Uwarunkowa-nia fizycznogeograficzne o społeczno-ekonomiczne rozwoju Obwodu Kaliningrad-zkiego Federacji Rosyjskiej, Uwarunkowania rozwoju rosyjskiej i polskiej czę ci Euroregionu „Bałtyk”. Published series: Regiony Nadmorskie. 13, Gdynia-Pelplin, p. 63—151.
17. Frejka, T. 2008, Overview Chapter 5: Determinants of family formation and childbearing during the societal transition in Central and Eastern Europe // Demo-graphic Research, Vol. 17, p. 139—170.
18. Górecka, S. 2006, Demographic changes in the Central and East Europe on the turn of the 20th and 21th century, Bulletin of Geography (socio-economic series), no 6, p. 67—76.
19. Grzelak-Kostulska, E., Hołowiecki, M., Szymańska, D. 1998, Permanent migrations in the period of constitutional transformations, Polish Population Re-view, no.13, p. 87—92.
20. Gubrynowicz, A. O. 2005, Estonii i Łotwie nieortodoksyjnych uwag kilka, Międzynarodowy Przegląd Polityczny, no.12, p. 123—138
21. Heiland. F. 2004, Trends in East-West German Migration from 1989 to 2002, Demographic Research, Vol. 11, p. 173—194.
22. Helanrski, S. (ed.), 2001, Nacjonalizm. Konflikty narodowo ciowe w Euro-pie rodkowej i Wschodniej, Toruń,.
23. Hellwig, Z. 1968, Zastosowanie metody taksonomicznej do typologicznego podziału krajów ze względu na poziom ich rozwoju oraz zasoby i strukturę wyk-walifikowanych kadr, Przegląd Statystyczny, R. 15, z. 4, p. 307—327.
24. Jankevics, J. 1998, Depopulation in Latvia, Polish Population Review, no.13, p. 11—19.
25. Jankevics, J. 1998, Depopulation in Latvia. In: Szymańska, D. (ed.). Ruch-liwo ć przestrzenna ludno ci w okresie przemian ustrojowych, Toruń, p. 9—16.
26. Jankevics, J. 2000, Change in the population of Latria due to migration. In: Szymańska, D. (ed.). Procesy i formy ruchliwo ci przestrzennej ludno ci w ok-resie przemian ustrojowych, Toruń, p. 21—23.
28. Katus, K. 2003, Post-transitional fertility development: new perspectives introduced by Central and East European nations. In: Kotowska, I. E., Jóźwiak, J. (eds.). Population in Central and Eastern Europe: Challenges and Opportunities. Statisti-cal Publishing Establishment, Warsaw, 2003, 117—138.
29. Kõre, J. 2000, Political system transformations and changes in population behavior case of migration behavior Estonian population. In: Szymańska, D. (ed.). Procesy i formy ruchliwo ci przestrzennej ludno ci w okresie przemian ustrojowych, Toruń, p. 9—11.
30. Kuptsch, Ch. 2012, The Economic Crisis and Labour Migration Policy in European Countries, Comparative Population Studies — Zeitschrift für Bevölke-rungswissenschaft, Vol. 37, no.1—2, p. 15—32.
31. Maamägi, A. 2007, Eesti võimaik rahvaarv ja vanuskoosseis aastani 2050, 2005—2006. In: Population prognosis and age distribution in Estonia, Rahvastik, Tallin, p. 68—96.
32. Macura, M., MacDonald, A. L. 2003, Fertility and fertility regulation in Eas-tern Europe: from the socialist to the post-socialist era, In: Kotowska, I. E., Jóźwiak, J. (eds.). Population in Central and Eastern Europe: Challenges and Opportunities. Statistical Publishing Establishment, Warsaw, p. 35—90.
33. Michalski, T. 2001, The main demographic and health problems of the for-mer Soviet part of Baltic Europe. In: Wendt, J. (ed.). Baltic Europe on the Eve of Third Millenium. Published series: Coastal Regions 3, Gdańsk, p. 113—119.
34. Michalski, T. 2001, Procesy demograficzne w Europie Bałtyckiej w połowie lat dziewięćdziesiątych. In: Pacuk, M. (ed.). Europa Bałtycka. Rozwój koncepcji. Opracowanie dedykowane Profesorowi Jerzemu Zaleskiemu w pięćdziesięciolecie pracy naukowej, Gdańsk, p 83—92.
35. Michalski, T. 2005, Changes in the Demographic and Health Situation Among Post-Communist Members of the European Union, Pelplin.
36. Michalski, T. 2010, Sytuacja zdrowotna w europejskich krajach postkomuni-stycznych w dobie transformacji, Gdańsk.
37. Michalski, T. 2012, Przemiany w liczbie ludno ci i ruchu rzeczywistym w Europie rodkowej i rodkowo-Wschodniej w okresie transformacji, Pelplin.
38. Michalski, T. 2012, Przemiany w umieralno ci w Europie rodkowej i rod-kowo-Wschodniej w okresie transformacji, Pelplin.
39. Mìhal`skì, T. 2007, Depopulâcìâ w êwropejskih posktkomunìsitičnih derža-wah âk plata za transformacìjnì procesi. In: Ŝablìj, O. (ed.). Teoretičnì ta medo-logìčnì problemy suspil`noї geografìї. Zbìrnik naukowih prac po po anu Zasluženo-go profesora L`wìwskoZasluženo-go nacìol`noZasluženo-go unìwersitetu ìmenì Ìwana Franka Olega a-blìâ, L`wìw, p. 255—264.
40. Molodikova, I. N., Nozdrina, N. N. 2000, Migratory flows to Russia and their effect on the territorial distribution of the population. In: Szymańska, D. (ed.). Procesy i formy ruchliwo ci przestrzennej ludno ci w okresie przemian ustrojowych, Toruń, p. 71—76.
41. Moon, G. 1994, Health Trends in Eastern Europe: a Comparative Analysis. In: Vaishar, A. (ed.).Health, Environment and Development, Brno, p. 61—79.
42. Muzlova, G. D. 2002, Vnišnââ torgovlâ stran central´no-vostočnoj Europy: regional´nye tendencji 1990-h godov, Izvestiâ Rosijskoj akademii nauk. Seriâ gegra-fičeskaâ, no.2, p. 63—70.
43. Nikolai, S. 1998, Geography of modern population processes in Russia: main features, tendencies, problems, Polish Population Review, no. 13, p. 19—32.
45. Philipov, D., Kohler, H.-P. 2001, Tempo Effects in the Fertility Decline in Eastern Europe: Evidence from Bulgaria, the Czech Republic, Hungary, Poland and Russia, European Journal of Population, Vol. 17, p. 37—60.
46. Pojaková, D. 1999, Štrukturálne a prestorowé zmieny priemyslu pod vply-vom socioekonomickiej transformácie, Ročnik 32, Folia Geographica 3, FHPH PU, Prešov, p. 116—122.
47. Prognoza ludno ci na lata 2008—2035, 2009, Departament Badań Demo-graficznych GUS. Warszawa, available at: <http://www.stat.gov.pl/cps/rde/xbcr/ gus/L_prognoza_ludnosci_na_lata2008_2035.pdf> (accessed: 5.01. 2014).
48. Puchnarewicz, E. (ed.). 2003, Organizacje pozarządowe w krajach rozwija-jących się i Europie Wschodniej, Instytut Krajów Rozwijających się Wydział, Warszawa.
49. Radics, Z. 2006, The change of external economic contacts in Central Euro-pe between 1989 and 2003 in the resEuro-pect of studying the CEFTA. In: Süli-Zakar, I., Horga. I. (eds.).Regional development in the Romanian-Hungarian cross-border spa-ce — from national to European perspective, Debrespa-cen, p. 137—142.
50. Rauglaudre. P. De, 1999, Russophones in Latvia: a geopolitical approach, Multicultural Regions and Cities. Region and Regionalism, no. 4, p. 56—62.
51. Rudeliūnienė, I. 2003, Moters vaidmens ir šeimos demografinės radios transformacija XX—XXI a, Tiltai, no.4 (25), p. 49—56.
52. Runge, J. 2006, Metody badań w geografii społeczno-ekonomicznej — ele-menty metodologii, wybrane narzędzia badawcze, Katowice.
53. Rychta íková, J. 1999, In Eastern Europe experiencing a second demogra-phic transition? Geographica, no. 34(1), p. 19—44.
54. Shokolnikov, V. M., Corina, G. A., Leon, D. A. et al. 1998, Causes of the Russian Mortality: Evidence and Interpretation, World Development, no.26, p. 1995—2011.
55. Sobotka, T. 2008, Overview Chapter 6: The diverse faces of the Second De-mographic Transition in Europe, Demographic Research, Vol. 19, p. 171—224.
56. Staşac, M., Michalski, T., Palmowski, T. 2002, Przemiany umieralno ci w Europie rodkowej, Biuletyn Geograficzny, no.1, p. 23—33.
57. Swiaczny, F. 2010, Demographic change in Germany and reversal of spatial ageing patterns, Baltic Region, no.4 (6), p. 37—47.
58. Vallin, J., Andreev, E., Meslé, F. et al. 2005, Geographical diversity of cause-of-death patterns and trends in Russia, Demographic Research, Vol. 12, p. 232—380.
59. Wojnicki, J. 2005, Kształtowanie systemów wielopartyjnych Europy rod-kowowschodniej 1989—2000, Pułtusk.
60. Yemelyanova, L. L. 2010, International cross-border migration in South-East Baltic: factors, structure, consequences, Baltic Region, 4(6), p. 55—64.
About the author
Dr hab. Tomasz Michalski, Professor, Department of Regional Development Geography, University of Gdańsk, Poland.

![Fig. 3. Average natural increase [per 1000 persons] in the years 2002—2011](https://thumb-eu.123doks.com/thumbv2/123dok_br/18129305.325143/4.892.151.746.274.717/fig-average-natural-increase-persons-years.webp)
![Fig. 7. Changes in natural increase [per 1000 persons]](https://thumb-eu.123doks.com/thumbv2/123dok_br/18129305.325143/7.892.152.747.116.524/fig-changes-natural-increase-persons.webp)
![Fig. 9. Changes in natural increase [per 1000 persons]](https://thumb-eu.123doks.com/thumbv2/123dok_br/18129305.325143/8.892.149.737.242.620/fig-changes-natural-increase-persons.webp)

