Lattice Gas with Nearest-Neighbor Exclusion in a Shear-Like Field
Fabricio Q. Potiguar and Ronald Dickman
Departamento de F´ısica, ICEx, Universidade Federal de Minas Gerais, 30123-970, Belo Horizonte, MG, Brazil
Received on 7 September, 2005
We present Monte Carlo simulations of the lattice gas with nearest-neighbor exclusion and Kawasaki (hop-ping) dynamics (hard square lattice gas), under the influence of a nonuniform drive, on the square lattice. The drive, which favors motion along the +xaxis and inhibits motion in the opposite direction, varies linearly in they direction. Our lattice has rigid walls at the end points in theydirection and periodic boundaries along the drive. We find that this model has transition to a sublattice-ordered phase at a density of about 0.298, lower than in equilibrium (ρc≃0.37), but somewhat higher than in the uniformly driven case at maximal bias (ρc≃0.272). For smaller global densities (ρ≤0.33), the ordering occurs with particle accumulation in the low-drive re-gion. Above this density we observe a surprising reversal in the density profile, with particles migrating to the high-drive region.
Keywords: Nearest-neighbor exclusion; Monte Carlo; Non-equilibrium lattice gas; Shear drive
I. INTRODUCTION
The lattice gas with nearest-neighbor exclusion (NNE) is the infinite repulsion limit of the ordinary repulsive lattice gas. Here, particles are forbidden to occupy the same or neighbor-ing sites. Its equilibrium version, in the square lattice, has a continuous order-disorder phase transition at the critical den-sityρc≈0.37 [1–5] which belongs to the Ising universality class. This model is also known as the hard square lattice gas. The square lattice, like other bipartite lattices, may be divided into two sublattices, A and B, such that the neighbors of all sites in A belong to B and vice-versa. For densities aboveρc the two sublattices have unequal densities.
More recently, nonequilibrium versions of the NNE model were studied [6, 7]. It was found [6] that the critical den-sity varies with drive intenden-sity: the higher the drive, the lower the critical density. The transition is continuous for low bias but becomes first order if the bias strength is≥0.75. Above the transition density, the system separates into regions of low and high local density, with the high-density region essentially frozen. Szolnoki and Szab´o [7] extended the dynamics to in-clude next-nearest-neighbor (diagonal) hops, and observed a similar variation of the critical density with drive strength, but with a homogeneous stationary state. Continuous phase tran-sitions in this version of the model fall in the Ising class, as the equilibrium case. These driven lattice gases are known as driven diffusive models (DDS) [8, 9].
Here we consider a hard-core DDS with nearest-neighbor hopping dynamics, in which the drive isnonuniform. Specif-ically, the probability for a particle atyto attempt a jump to the right (x→x+1) is given by:
Pr(y) = 1 4
µ
1+y−1 L−1
, (1)
fory=1, 2,...,L, on a square lattice ofL2sites (a jump to the left occurs with probabilityPl(y) =1/2−Pr(y)). Jumps in the ±ydirection occur with probability 1/4. We present numerical results from Monte Carlo (MC) simulations of the model.
Our main objective is to obtain the critical properties of the model. To determine the critical density, we study the
behav-ior of the order parameter and the stationary current as func-tions of global density. Of particular interest are the current and the density profiles as functions of ywhich show how the system organizes under the influence of the drive. In the following section (II) we detail the model and simulation pro-cedure. In Section III, we present numerical results and dis-cussions. Final considerations are reserved for section IV.
II. SIMULATIONS
We consider a square lattice of lengthL(L2 sites) withN particles (N<L2/2). (Most of our studies use L=100.) The initial configuration is prepared via random sequential adsorption (RSA) [10, 11] of particles, always respecting the excluded-volume condition. The dynamics consists of ran-dom selection of particles and assignment of a new (trial) po-sition at one of the nearest neighbor sites with the probabil-ities introduced above. If the trial position does not violate the exclusion constraint, the move is accepted. Each MC time unit corresponds toNattempted moves. We perform averages over 106MC time units in the stationary state. Twenty values
of the densityρ=N/L2, ranging fromρ=0.01 toρ=0.37 are studied.
III. RESULTS
The order parameter is defined as the difference in sublat-tice occupancies per particle,
hφi=h|NA−NB|i
N , (2)
whereNA(B)is the number of particles in sublatticeA(B)and hiindicates an average over realizations. The stationary cur-rent is defined as the difference between the number of jumps along the drive less the number contrary to it, per site and unit time.
in the order parameter and the associated maximum in its vari-ance signal a continuous transition to an ordered phase. The data suggest a critical density ofρc=0.298, although a pre-cise determination will require studies of larger systems. In any case, it is clear that the critical density is lower than that for the equilibrium transition [2]. The apparently continuous transition in the presence of a nonuniform drive is likely to be due the fact that the system does not order all at once.
0.25 0.275 0.3 0.325 0.35 0.375
ρ 0
0.2 0.4 0.6 0.8 1
<
φ> 0.25 0.3 0.35 ρ 0 0.005 0.01 0.015 0.02
<
∆φ
2 >
FIG. 1: Order parameter (circles) versus overall density, L=100. The inset shows its variance. The peak in
∆φ2®
is aroundρ=0.298.
In Fig. 2, we show the stationary current for several sys-tem sizes. This quantity displays the same behavior as in the uniformly driven case: it increases at small densities (reflect-ing the increas(reflect-ing number of carriers) and decreases for larger densities (due to the reduction in available space for move-ment). The maximum value ofhj(t)ifalls at roughly in the same density as in the uniform drive case [6]. Interestingly, the phase transition nearρ=0.298 is associated with a plateau in the current (see inset of fig. 2).
0 0.1 0.2 0.3 0.4
ρ 0
0.005 0.01 0.015 0.02
<j>
L = 70 L = 80 L = 90 L = 100
0.29 0.3 0.31 0.0106
0.0108 0.011 0.0112 0.0114
FIG. 2: Average stationary current versus density forL=100, 90, 80 and 70. The inset shows a detail of the plateau region around the critical density,ρc=0.298.
The order parameter and the stationary current present strong fluctuations for densities aboveρ=0.32. The evolution of these quantities typically displays sudden jumps between the ordered and the disordered state, a fact already observed in the uniformly driven case. In these cases, the relaxation time to the stationary state is on the order of 107MC steps. When the global density approaches the maximal value we studied here, this slow relaxation is suppressed due to the quick for-mation of a jammed region in the high-field portion of the lattice (see below the results for the profiles and the configu-ration snapshots). The drive provokes formation of organized structures while their thermal motion provides a mechanism for breaking such clusters. We will see that such behavior may find a parallel in actual physical systems.
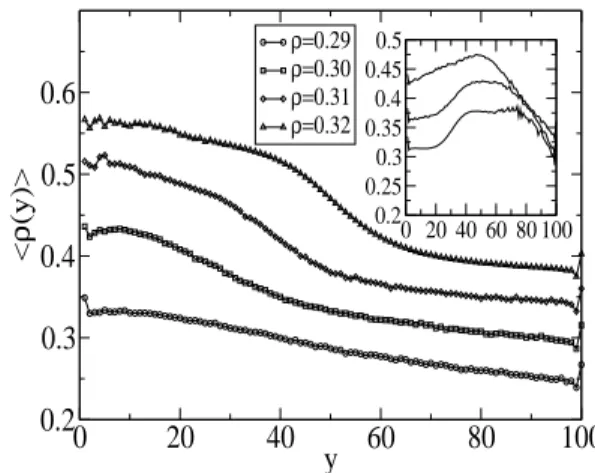
Of interest is how the system organizes as the global den-sity increases. To understand this, we determine the stationary density and current profiles,ρ(y)andj(y), respectively. These quantities are shown in Figs. 3 and 4.
0
20
40
60
80
100
y
0.2
0.3
0.4
0.5
0.6
<
ρ
(y)>
ρ=0.29 ρ=0.30 ρ=0.31 ρ=0.32
0 20 40 60 80 100 0.2
0.25 0.3 0.35 0.4 0.45 0.5
FIG. 3: Stationary density profileρ(y)for various global densities. The curves for the three denser states are shifted upwards by 0.15, 0.1 and 0.05, respectively. Inset: same quantity for densities 0.33, 0.34, and 0.35 (from top to bottom). The first two curves are shifted upwards by 0.1 and 0.05.
Particles concentrate first, as the global density increases, in the low field region (this concentration is observed at den-sities as low as 0.20). This is surprising given the finding that a strong drive favors order [6]. On this basis one might ex-pect particles to concentrate first in thehigh-drive region. In fact just the opposite occurs: for a global densitiesρ≤0.32, the density profileρ(y)(Fig. 3) is highly skewed to the re-gion around y=1. Note that the local density is ≥0.37 in this region (forρbetween 0.30 and 0.32), that is, greater than or equal toρcin equilibrium. The density profile decays monotonically with increasingy(except for small density os-cillations induced by the wall aty=1). Forρ=0.33, the local density instead increases withy, reaching a peak neary=47, after which it decays in an approximately linear fashion until y=L.
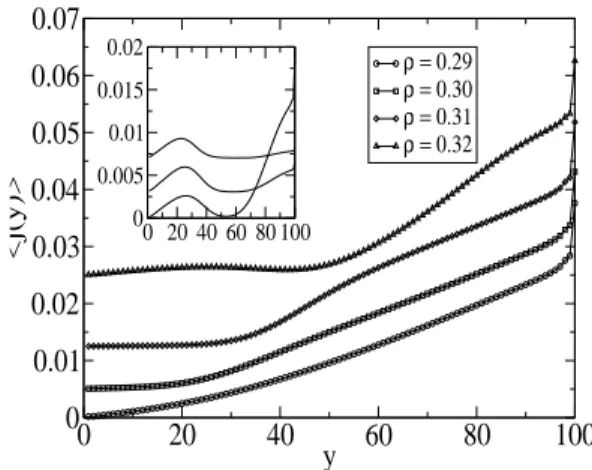
This accumulation is due to excluded volume effects [12] that entropically favor enhanced densities at rigid surfaces. The ef-fect of this accumulation shows up in the current profile (Fig. 4), as a sharp peak aty=L.
0 20 40 60 80 100
y 0
0.01 0.02 0.03 0.04 0.05 0.06 0.07
<j(y)>
ρ = 0.29 ρ = 0.30 ρ = 0.31 ρ = 0.32
0 20 40 60 80 100 0
0.005 0.01 0.015 0.02
FIG. 4: Stationary current profile j(y)for global densities as indi-cated. The data forρ=0.32, 0.31 and 0.30 data are shifted upwards by 0.025, 0.0125 and 0.005 respectively. Inset: average stationary current for densities (top to bottom): 0.35, 0.34 and 0.33. The top curve is shifted upwards by 0.007, the second one, by 0.003.
The observations made in the density profiles have re-flections at the current profiles (Fig. 4). The current is much smaller in the small-yregion (low-bias) and increases monotonically withy. It clearly shows that ordering occurs in the low-drive region for densities between 0.30 and 0.32, as described above. Note also that the current in the high-drive region is close to zero forρ≥0.35, signaling a greater accu-mulation of particles in this part of the lattice.
A possible explanation for the surprising reversal of the density and current profiles with increasing global density is related to the formation of a jammed region, as observed in the uniformly driven system [6]. We term a region “jammed” when all particles in this region have their movement severely reduced due to aggregation induced by the field, leading to a vanishing diffusion coefficient and mobility. When the global density is too low for such a region to form, particles tend to collect in the low-drive region because a strong drive tends to destroy the local correlations needed for particles to pack to high density, even if such packing does not result in long-range order. The depletion of the high-drive region appears to be the reason for the plateau in the current observed around ρ=0.30 in Fig. 2. Fig. 3 shows that as the global density increases, the local density in the high-drive region remains nearly constant, so the global current hardly varies, since its main contribution comes from particles in the high-field re-gion.
When, on the other hand, the global density is sufficiently high, an irreversible accumulation of particles happens in the high-field region, so that the low-drive region has fewer par-ticles than at lower global densities, for which there is no jammed region.
We may now identify two factors leading to the continuous variation of the order parameter with density shown in Fig. 1. One reason is that ordering begins in the low-bias region. Studies of the uniformly driven system show that the transition is continuous under a weak bias [6]. The second reason is that the width of the ordered region grows continuously with increasing density.
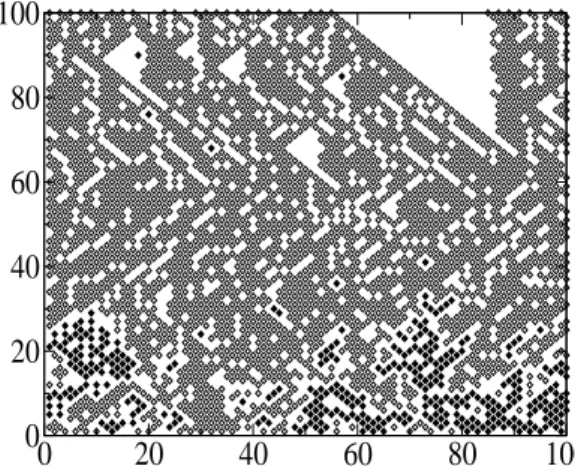
To illustrate these ideas, we show in Fig. 5 a configura-tion forρ=0.31 andL=100. As expected, the low-drive region is very dense and contains few mobile particles. In the uniformly driven system (at maximum bias) one observes, at this density, formation of “herringbone” pattern of diagonal stripes, pointing along the drive, with particles in this structure essentially frozen. In the present case the low-drive region is highly ordered, with almost all particles in the same sublattice, but there is no sign of the herringbone pattern. The high-drive region is disordered, permitting the high currents and lower densities reported above. Several clusters of particles exist in the high-drive region, but they are not large enough to cause jamming.
0
20
40
60
80
100
0
20
40
60
80
100
FIG. 5: Particle configuration at densityρ=0.31, after 106MC steps (system sizeL=100). Open and filled symbols represent particles in different sublattices. The drive is directed to the right and increases in the vertical direction.
exclusion constraint. In this configuration, such particles are blocked by others, providing a virtually infinite lifetime to this structure. The large number of voids in the high-bias region of fig. 6 results from the formation of the jammed structure during the early stages of the dynamics (confirmed by the his-togram of displacements inyduring thermalization, not shown here, [13]).
0
20
40
60
80
100
0
20
40
60
80
100
FIG. 6: Particle configuration at densityρ=0.35, after 106 steps (L=100).
To study correlations between the particles, we determine the radial distribution function, g(r) in the high- and low-drive regions (Fig. 7). This function is proportional to the probability of finding a pair of particles separated by a dis-tancer, and is normalized so thatg→1 asr→∞. For pur-poses of determining g(r), the low-drive region is taken as the strip 6≤y≤14, while the high-drive region comprises 86≤y≤94.
1
2
3
4
5
r
0
1
2
3
4
5
6
7
8
g(r)
ρ=0.31, high
ρ=0.31, low
ρ=0.35, high
ρ=0.35, low
FIG. 7: Radial distribution function for the high- and low-drive re-gions, for densitiesρ=0.31 andρ=0.35. The error bars are the same size or smaller than the symbols.
Theg(r)curves for global densityρ=0.31 show that the high- and low-drive structures are markedly different. In the
low-bias region the peaks are much larger due to the sublattice ordering associated with packing of particles (as evidenced by the configuration in Fig. 5), and is compatible with the exis-tence of long-range order. The high-drive region shows little structure; the oscillations ing(r)decay rapidly with distance. The picture forρ=0.35 is quite different. The sharpness of the peaks in the curve forρ=0.35 in the high-bias region re-flects the very different sublattice densities, as does the fact thatg≃0 for r=3, √13 and√17. The radial distribution function in the low-drive region, for this density, exhibits less structure, indicating the more equal sublattice occupancies.
A final question is whether all the observed ordering is somehow induced by the rigid walls. We studied a system with periodic boundaries inydirection and a symmetric drive profile and found essentially the same results for the current and density profiles [13].
IV. CONCLUSIONS
We studied a lattice gas with nearest-neighbor exclusion driven by a nonuniform, shear-like drive, on the square lat-tice, under nearest-neighbor hopping dynamics. The problem is of interest as an example of the surprising behavior to be found in a simple nonequilibrium system. We find that the model undergoes a continuous order-disorder transition at a critical density of aboutρc=0.298. This is unlike the uni-formly driven model, in which the transition is discontinuous for a bias≥0.75. The stationary current follows roughly the same trends as in the uniformly driven case, but exhibits a plateau in the neighborhood of the phase transition.
Our results show that this transition is due to the concentra-tion of particles at the low-bias region, for global densities be-tweenρ=0.30 and 0.32. Remarkably, the nonuniform drive induces a highly nonuniform density profile, expelling parti-cles from the high-bias region. The effect is sufficiently strong to induce sublattice ordering in the low-bias region. Thus the drive favors a class of configurations that, on the basis of en-tropy maximization, are extremely unlikely. Note that at these densities there is no jamming, i.e., the system is ergodic. Mi-gration of particles to the low-bias region appears to derive from the destruction of short-range correlations (required for efficient packing), by the drive.
For higher densities, we observe a completely inverted pic-ture, with formation of jammed structures in the high-drive region, while particles outside this region remain mobile. The jammed region is characterized by a dense (ρ≥0.37) strip of particles; at higher global densities this region displays long diagonal chains of particles associated with voids. Other vari-ants of the model, with different drive geometries [14] show similar effects.
simi-lar effect to the slow relaxation observed here. They studied suspensions at several densities under the influence of shear. The suspension presents shear-thickening at intermediate den-sities, where a small vibration drives the system back to a fluid state. At higher densities, after shear is applied, the suspen-sion forms a paste, becoming trapped in this jammed state. In our case, thermal motion, or vibration, is always present, as well as shear, so we do not observe the breakdown of the jammed state at intermediary densities, but a slow relaxation towards a denser state. In a granular system, which is, by definition, athermal, effects analogous to those of thermal ag-itation can be produced by shaking. This raises the possibility that the behavior identified in the sheared lattice gas might
also be observed in a sheared packing if, besides the shear drive, continuous shaking were applied to the grains. This suggests that the model studied here can be extended to study the dynamics of certain complex fluids, a subject we intend to explore in future work.
Acknowledgments
We thank the Brazilian agencies CAPES, CNPq and Fapemig for support.
[1] D. S. Gaunt and M. E. Fisher, J. Chem. Phys.43, 2840 (1965). [2] F. H. Ree and D. A. Chesnut, J. Chem. Phys.45, 3983 (1966). [3] L. K. Runnels and L. L. Combs, J. Chem. Phys. 45, 2482
(1966).
[4] D. S. Gaunt and M. E. Fisher, J. Chem. Phys.46, 3237 (1967). [5] R. J. Baxter, I. G. Enting, and S. K. Tsang, J. Stat. Phys.22, 465
(1980).
[6] R. Dickman, Phyr. Rev. E64, 16124 (2001).
[7] A. Szolnoky and G. Szab´o, Phys. Rev. E65, 47101 (2002). [8] B. Schmittmann and R. K. P. Zia, Statistical Mechanics of
Driven Diffusive Systems, vol. 17,Phase Transitions and Criti-cal Phenomena(Academic Press, London, 1995).
[9] J. Marro and R. Dickman,Nonequilibrium phase transitions in lattice models(Cambridge University Press, Cambridge, 1999).
[10] P. Meakin, J. L. Cardy, E. Loh, and D. J. Scalapino, J. Chem. Phys.86, 2380 (1987).
[11] R. Dickman, J.-S. Wang, and I. Jensen, J. Chem. Phys.94, 8252 (1991).
[12] R. Dickman, P. Attard, and V. Simonian, J. Chem. Phys.107, 205 (1997).
[13] F. Q. Potiguar, R. Dickman, submitted to Phys. Rev. E (cond-mat/0507114).
[14] Studies of a system with half zero and half maximum drive, and a driven system with variable density are in progress.