Article
Printed in Brazil - ©2012 Sociedade Brasileira de Química0103 - 5053 $6.00+0.00
A
*e-mail: [email protected]
Method Development for
234U and
230Th Determination and Application to Fossil
Deep-Water Coral and Authigenic Carbonate Dating from the Campos Basin - Brazil
Ronaldo J. Vivone,a Maria Luiza D. P. Godoy,a José Marcus Godoy*,a,b and Guaciara M. Santosc
aInstituto de Radioproteção e Dosimetria, Comissão Nacional de Energia Nuclear,
CP 37750, Barra da Tijuca, 22643-970 Rio de Janeiro-RJ, Brazil
bDepartamento de Química, Pontifícia Universidade Católica do Rio de Janeiro,
Rua Marquês de São Vicente 225, Gávea, 22453-900 Rio de Janeiro-RJ, Brazil
cKeck-CCAMS Facility, Earth Systems Science, B321 Croul Hall,
University of California, Irvine, CA 92697-3100, USA
Foi desenvolvido um método para determinação de 234U e 230Th empregando uma separação
por extração cromatográfica seguida por medidas com ICP-MS quadrupolar (ICP-QMS). Para carbonatos autigênicos, uma segunda etapa de separação, por cromatografia de troca-iônica em meio nítrico, foi incluída. Esses métodos foram aplicados a sete amostras de fósseis de corais de águas profundas e duas amostras de carbonato autigênicos do talude continental da Bacia de Campos. As idades determinadas para as amostras de fósseis de corais variaram entre 9-202 kanos com uma incerteza de 1%, consistente com os valores determinados pela datação com 14C, bem como com
as idades 230Th/234U determinadas por FIAS-ICP-QMS. Uma das amostras de carbonato autigênico
analisada apresentou uma idade de aproximadamente 80 kanos. A outra amostra apresentou uma razão 230Th/234U próximo do equilíbrio e fora da faixa de aplicação do método.
A 234U and 230Th determination method based on an extraction chromatographic separation
followed by ICP-MS with quadrupole (ICP-QMS) was developed. For authigenic carbonates, a second separation step with ion exchange chromatography in a HNO3 solution was added. These
methods were applied to seven fossil deep-water coral and two authigenic carbonate samples from the continental slope of the Campos Basin - Brazil. The ages determined for the fossil corals samples from the same sediment core ranged from 9 to 202 ky with a 1% uncertainty, consistent with the values determined by 14C dating and with those determined by 230Th/234U using flow
injection coupled to an ICP-QMS. One of the authigenic carbonates analyzed presented an age of approximately 80 ky. The other sample exhibited a 230Th/234U activity ratio close to equilibrium
and out of the application range of the method.
Keywords: 230Th/234U dating, ICP-MS, fossil deep-water corals, authigenic carbonates
Introduction
The Brazilian continental margin contains substantial hydrocarbon reserves and thus has been the subject of research related to biostratigraphy, paleoecology and paleoceanography. Sequences of appearing and disappearing fossil deep-water corals have been found in sediments sampled from the Campos Basin continental slope.1
Deep-water fossil corals could serve as records with high temporal resolution for the reconstruction of rapid changes in past ocean circulation.2 The earth’s climate
changes rapidly on the geological time scale, and the bottom
of the sea plays an important role as a paleoceanographic record.3,4 Some authors have suggested that the
deep-water corals are well suited to the study of rapid climate change.2,5,6 Past deep circulation patterns have been
reconstructed using high-resolution records of deep-water corals obtained by 14C or U/Th dating.
According to Miller,7 seabed hydrocarbon seeps have
Over the past few years, several studies on the underwater environment and fossil records rocks have emphasized the importance of carbonate formation associated with the age of hydrocarbon seepage and microbial activity.8 Because
authigenic carbonate precipitation most commonly results from anaerobic methane oxidation, its carbon source is petrogenic and thus conventional 14C dating is not
applicable. However, several studies have demonstrated the applicability of the 230Th/234U method for these purposes.9-11
Depending on the sample age, the 230Th activity can be
low, which causes a high uncertainty in age determination by radiochemical methods, even after long counting times. Thus, 230Th/234U in these samples (corals and authigenic
carbonates) can be determined using mass spectrometry.12-15
In this work, the 230Th/234U determination method by
ICP-MS was performed by the Institute for Radioprotection and Dosimetry/Brazilian Nuclear Commission (IRD/CNEN), using on-line chemical separation (FIAS) employing UTEVA cartridges (Eichrom Co.).16 The method had to be
adapted for application to samples of authigenic carbonates, because low chemical yields were observed, probably due to large amounts of iron.
The aim of the present work is to develop an analytical method for 230Th/234U dating of authigenic carbonate
and deep-water coral samples with improved precision and accuracy over the on-line separation (FIAS) method currently used by the IRD/CNEN. The calculated ages were compared with values obtained by other techniques, such as 14C dating by mass spectrometry coupled to a particle
accelerator (AMS) by the Laboratory of the University of California (USA) and 230Th/234U dating with a flow injection
system coupled to an ICP-QMS method by the Institute for Radioprotection and Dosimetry (Brazil).
Experimental
The seven fossil coral and two authigenic carbonate samples, which originated from the continental slope of the Campos Basin - Brazil, were obtained from Petrobras.
To remove the U and Th fractions on the coral samples carried by the Fe-Mn coatings and clay particles, mechanical cleaning was first performed, followed by ultrasonic washing with 1 mol L-1 HNO
3 for 20 min.
A second chemical cleaning procedure adapted from
Lomitschka and Mangini12 was then performed. One gram
of cleaned coral sample was ground in an agate mortar and dissolved in 30 mL of 3 mol L-1 HNO
3. When some residue
remained, it was dissolved completely with an acid mixture composed by HNO3 plus HF, evaporated to eliminate HF,
and the obtained residue re-dissolved with 3 mol L-1 HNO 3
and reserved for its U and Th content determination by ICP-QMS. These results were used to correct the 234U and 230Th
values on the carbonate phase for the detritic contribution by applying the 232Th concentration on the carbonate phase
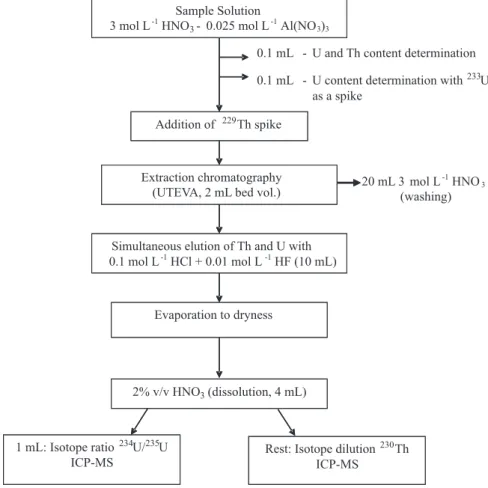
and the U/Th ratio on the residual phase. Thorium-230 and 234U concentrations on the leaching solution were
determined according to the method illustrated in Figure 1. The 230Th, 234U and 238U values, corrected for the detritic
contribution, were used to calculate the coral ages according to equation 3.
The external layer of the authigenic carbonate samples was removed, and the remaining part was ground in an agate mortar and sieved into four fractions < 170, 170-80, 80-42 and 42-24 mesh. One gram of each fraction was leached with 7 mol L-1 HNO
3 in order to yield the carbonate phase. The
remaining residual fraction was totally dissolved with HNO3
plus HF mixture, and then 238U and 232Th were determined
by ICP-QMS. The 230Th, 232Th, 234U and 235U results on
the carbonate phase were used to construct both Rosholt and Osmond isochrones17 and to obtain the 230Th/234U and 234U/238U activity ratios. The results obtained using these two
different approaches were applied to equation 3.
The uranium and thorium elemental and isotope determinations were performed using a Perkin-Elmer ELAN 6000 ICP-QMS instrument using the conditions described in Table 1. The 233U and 229Th spikes used are
traceable to BIPM and were diluted according to the Radionuclides Metrology Section of the Institute for Radioprotection and Dosimetry (SEMRA/IRD).
Mass bias was corrected by applying equation 1, where
β was determined from NIST CRM U020A (1 ng mL-1)
analysis and equation 2:18
(1)
(2)
To reduce the mass discrimination effect, the 234U/235U
isotope ratio was measured instead of the 234U/238U isotope
ratio. To calculate the 234U/238U isotope ratio, the measured 234U/235U isotope ratio was multiplied by the 235U/238U
isotope ratio (0.0072526). To calculate the 230Th/234U
mass concentration ratio, the obtained 230Th concentration
was divided by the product of the 234U/238U isotope ratio
multiplied by the 238U mass concentration. To obtain the 230Th/234U activity ratio, the calculated mass concentration
ratio was multiplied by the ratio of the specific activities of the isotopes in question.
The 234U/238U and 230Th/234U activity ratios were
calculated. Based on the obtained values, the ages were determined according to equation 3,19
(3)
where λ230 is the
230Th decay constant and, λ
234 is the 234U
decay constant.
The developed methods were tested for 234U and 230Th
determinations of the NIST SRM 4357 standard reference ocean sediment material. Three 2 g aliquot samples were used for each method.
Table 1. Instrument and data acquisition settings for Perkin-Elmer ELAN 6000 ICP-MS
Instrument settings
RF power 1.05 kW
Nebulizer Ultrasonic with membrane desolvator (USN)
Cross flow (CFN)
Sampler cone Nickel, 1.1 mm orifice diameter
Skimmer cone Nickel, 0.9 mm orifice diameter
Argon flow rates
Plasma gas 15 L min-1
Auxiliary gas 1.2 L min-1
Nebulizer gas 1.02 L min-1 (CFN) 1.21 L min-1 (USN)
Ultra-sonic nebulizer settings
Sample uptake rate 1.5 mL min-1
Heating temperature 140 oC
Cooling temperature 3 oC
Membrane desolvator heating temperature
160 oC
Sweep gas flow rate 2.0 L min-1
Data acquisition settings
Acquisition mode Peak hopping
Read delay 40 s (USN) 30 s (CFN)
Atom ratio measurements
Monitored isotopes 234U, 235U 233U, 238U 229Th, 230Th
Sweeps/replicates 400 60 100
Replicates 3 6 6
Dwell time 75 ms/50 ms 50 ms/50 ms 25 ms/25 ms
Total time of analysis 150 s 36 s 30 s
Concentration measurements
Monitored isotopes 238U and 232Th
Sweeps/replicates 20
Replicates 3
Dwell time 50 ms
Total time of analysis 3 s
Results and Discussion
For accurate 234U and 230Th determination in the fossil
coral and authigenic carbonate samples, a separation procedure was needed to eliminate the main matrix elements and to obtain a sample solution with a chemical composition similar to that of standards.20 An off-line
separation procedure was applied based on extraction chromatography with 2 mL UTEVA (Eichrom Co.) columns21-26 (Figure 1). The elution curves of U and Th
with 0.1 mol L-1 HCl, 0.1 mol L-1 HCl + 0.1 mol L-1 HF,
and 0.1 mol L-1 HCl + 0.01 mol L-1 HF, were tested. The
feed solution (40 mL of 3 mol L-1 HNO
3 + 0.025 mol L-1
Al(NO3)3)was added to 1000 ng of Unat and 1000 ng of Thnat.
Based on the obtained results (Figure 2), 10 mL of 0.1 mol L-1
HCl + 0.01 mol L-1 HF was used as the U and Th eluent to
avoid higher HF concentrations and to obtain 100% recovery for both elements. This condition ensures that Th and U are quantitatively retained and eluted during separation from the matrix. The U and Th decontamination factors (DF) from Ca, Fe, Al, Mg and Sr, which are representative of the major matrix elements, are shown in Table 2. The obtained decontamination factors are considered satisfactory, because they are equal to or greater than 103.27
Due to the low thorium chemical yield obtained, the initial tests with authigenic carbonate samples revealed the need for a matrix separation step before chromatographic extraction with the UTEVA column (Figure 3). Based on previous work (Godoy et al.28), ion
exchange chromatography with DOWEX 1X8 was tested. Using 40 mL of 7 mol L-1 HNO
3 + 0.025 mol L-1 Al(NO3)3
as feed solution containing 1000 ng of U and 1000 ng of thorium, the elution curves of Th with 6 mol L-1 HCl +
0.26 mol L-1 HF, 1 mol L-1 HCl + 0.26 mol L-1 HF and
0.1 mol L-1 HCl + 0.26 mol L-1 HF were determined.
Based on the obtained results (Figure 4), 25 mL of 6 mol L-1 HCL + 0.26 mol L-1 HF was chosen as the Th
eluent. Thorium was strongly adsorbed, whereas uranium was not retained by the DOWEX 1X8 resin and instead was distributed between the feed and washing solutions. Both solutions were collected together for U determination, followed by a second separation step with UTEVA columns similar to that applied for the coral samples.
The obtained 234U and 230Th concentrations for the NIST
SRM 4357 certified reference marine sediment sample using both methods are shown in Tables 3 and 4. The results are within the confidence interval for both isotopes. For these samples, the 230Th achieved accuracy (2.8 and 2.2%),
Figure 2. Uranium and thorium elution curves from 4 cm UTEVA columns: a) 0.1 mol L-1 HCl, b) 0.1 mol L-1 HCl + 0.1 mol L-1 HF, c) 0.1 mol L-1 HCl +
Table 2. Achieved decontamination factors
Element Decontamination factor
Ca 5.7 × 10³
Fe 3.8 × 10³
Al 3.1 × 10³
Mg 9.9 × 10²
Sr 4.3 × 10³
Figure 3. Method for 234U and 230Th determination - authigenic carbonate samples.
by applying this off-line separation method are better than those obtained by Godoy et al.,16 whose values were above
10%, but within the 95% confidence interval of the certified value. The 230Th precisions (1.9 and 3.1%) are similar to that
(1.5%) reported by Godoy et al.16 Although 234U does not
have a certified reference value, the precision and accuracy values for this isotope using the proposed method were similar to those using on-line methods.16
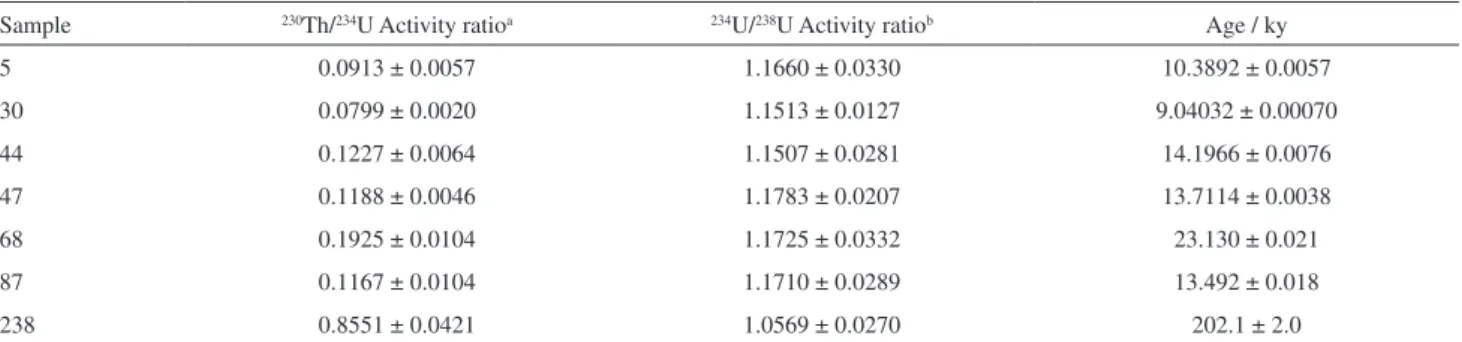
For the fossil deep-water corals samples from Campos Basin, the 230Th/234U and 234U/238U activity ratios as well
as the calculated ages are shown in Table 5. Taking into account the peak areas, the residual fraction contribution and the uncertainty related to the spikes, the uncertainties
Table 3. 230Th and 234U activity values for NIST SRM 4357 certified reference marine sediment sample using the method for coral samples
Radionuclide Reference Value / (Bq kg-1) CIa (95%) / (Bq kg-1) Meanvalueb / (Bq kg-1) Precision / % Accuracy / %
234U 12c 9-15 12.79 ± 0.82 6.4 6.6
230Th 12.0 9.6-14.4 12.33 ± 0.45 3.6 2.8
aConfidence interval. bData represent the average ± 1.96 SD of three replicates. cValue not certified.
Table 4. Authigenic carbonate samples
Radionuclide Reference Value / (Bq kg-1) CIa (95%) / (Bq kg-1) Meanvalueb / (Bq kg-1) Precision / (%) Accuracy / (%)
234U 12 c 9-15 12.29 ± 0.86 7.2 2.4
230Th 12.0 9.6-14.4 12.27 ± 0.74 6.2 2.2
a Confidence interval. b Data represent the average ± 1.96 SD of three replicates. c Value not certified.
Table 5. 230Th/234U and 234U/238U activity rations and calculated ages of the fossil coral samples
Sample 230Th/234U Activity ratioa 234U/238U Activity ratiob Age / ky
5 0.0913 ± 0.0057 1.1660 ± 0.0330 10.3892 ± 0.0057
30 0.0799 ± 0.0020 1.1513 ± 0.0127 9.04032 ± 0.00070
44 0.1227 ± 0.0064 1.1507 ± 0.0281 14.1966 ± 0.0076
47 0.1188 ± 0.0046 1.1783 ± 0.0207 13.7114 ± 0.0038
68 0.1925 ± 0.0104 1.1725 ± 0.0332 23.130 ± 0.021
87 0.1167 ± 0.0104 1.1710 ± 0.0289 13.492 ± 0.018
238 0.8551 ± 0.0421 1.0569 ± 0.0270 202.1 ± 2.0
aData represent the average ± 4.30 SD of three ICP-MS readings. bData represent the average ± 4.30 SD of three ICP-MS readings.
Table 6. Ages of fossil corals based on different methods
Coral Sample
Age / ky
This work ICP-MS (batch)
IRD ICP-MS (flow injection)
Univ. California
14C-AMS
5 10.39 10.91 10.93
30 9.04 8.4 11.14
44 14.20 14.87 14.98
47 13.71 14.71 11.12
68 23.13 26.07 22.97
87 13.49 13.13
238 202.1
associated with coral were about 1%. Table 6 shows the fossil coral ages determined using the proposed method, with the previous method based on flow injection, and by
14C AMS dating at the University of California, Irvine,
United States. To verify if there were statistically significant differences between the obtained results by the three methods, ANOVA tests were applied, as shown in Table 7. Because the calculated F (0.50) value was lower than the critical F (3.89) value, no significant differences were found among the three methods.
The authigenic carbonate samples contained detritic contamination not only at the surface, but throughout
the entire sample. Therefore, usual cleaning procedures, such as mechanical and chemical removal of the surface layers, did not generate a final sample with a low 232Th
content, as observed for the coral samples (range of ng g-1). The procedure described by Ku29 was applied
with sample fractionation by size to generate independent sub-samples. Based on the obtained results, two different isochrons were constructed: 230Th/232Th vs.234U/232Th and 234U/232Th vs. 238U/232Th for the Rosholt plots (Figure 5)
and 230Th/238U vs. 232Th/238U and 234U/238U vs. 232Th/238U
for the Osmond plots (Figure 6). The 230Th/234U and 234U/238U activity ratios were obtained using the slopes
of the Rosholt plots and the intercepts of the Osmond plots. The obtained values were statistically equivalent: (0.542 ± 0.014) 230Th/234U and (1.1004 ± 0.0028) 234U/238U
and (0.564 ± 0.046) 230Th/234U and (1.0976 ± 0.0036) 234U/238U for the Osmond and Rosholt plots, respectively.
Applying these results to equation 3, the age of this authigenic carbonate sample was (83.6 ± 0.1) ky according to the Osmond plot and (88.8 ± 0.1) ky based on the Rosholt plot. According to Ludwig,17 the Osmond plot provides a
more realistic value for samples with a high 232Th content.
Furthermore, because 232Th and 234U each appear in both of
Table 7. Test and least significant difference between the methods at 95% confidence level
This work (1) IRD flow injection (2) Univ. California- Irvine AMS (3) 1-2 2-3 1-3
10.39 10.91 10.93 -0.52 -0.02 -0.54
9.04 8.4 11.14 0.64 -2.74 -2.10
14.20 14.87 14.98 -0.67 -0.11 -0.78
13.71 14.71 11.12 -1.00 3.59 2.59
23.13 26.07 22.97 -2.94 3.10 0.16
13.49 13.13 Mean -0.67 0.76 -0.54
SD 1.16 2.6 1.56
GM -0.05
SSF 6.92 2
SSE 45.7 12
MSF 3.46
MSE 3.81
Fcalc 0.5 Fcrit 3.89
LSDa 3.82
aLSD = Least Significant Difference.
Figure 5. Rosholt plots for authigenic carbonate.
Figure 6. Osmond plots for authigenic carbonate samples.
in a complex way. However, these correlations are never taken into account when calculating the ages or age-errors. Therefore, a simultaneous solution using all three of the ratios for the modified Osmond ratios is needed to generate
a regression for an isochron line in three dimensions. The calculated age, determined using Isoplot 3.7 software,17
used to construct the 3D 232Th/238U-230Th/238U-234U/238U
The other authigenic carbonate sample yielded a 230Th/234U value close to one. Consequently, the
corresponding age was not calculated, indicating that it is close to or older than 300 ky.
Conclusions
Two 234U and 230Th determination methods based on
extraction chromatographic separation followed by ICP-QMS measurements were developed. These methods were validated for fossil deep-water corals and authigenic carbonates by using certified reference marine sediment.
Samples of fossil corals from the same sediment core and from authigenic carbonates were analyzed and dated. The obtained fossil coral ages agree with other values determined using 230Th/234U flow injection separation
coupled to ICP-QMS and with 14C-AMS.
The developed methods are equivalent in terms of precision and more accurate than the previously applied method based on flow injection separation coupled to an ICP-QMS. In addition, the proposed method has the following advantages: final solution free of salts and with a chemical composition similar to ICP-QMS standard solutions, less accumulation of salts in the interface of the equipment (skimmer and sampler cones) and applicability to more complex matrices, such as authigenic carbonates.
Acknowledgments
The authors are particularly grateful to Dennis Miller and Renato Kowsmann (CENPES/Petrobras) for the fossil coral and the authigenic carbonate samples and to Kenneth Ludwig (Berkeley Geochronological Center) for the Isoplot software copy.
References
1. Mangini, A.; Godoy, J. M.; Godoy, M. L.; Kowsmann, R. O.; Santos, G. M.; Ruckelshausen, M.; Schroeder-Ritzrau, A.; Wacker, L; Earth Planet. Sci. Lett. 2010, 293, 269.
2. Schroder-Ritzrau, A.; Mangini, A.; Lomitschka, M.; Earth Planet. Sci. Lett. 2003, 216, 399.
3. Wilson, R. C. L.; Drury, S. A.; Chapman, J. L.; J. Quaternary Sci. 2000, 15, 843.
4. Alley, R. B.; Marotzke, J.; Nordhaus, W. D.; Overpeck, J. T.; Peteet, D. M.; Pielke Jr., R. A.; Pierrehumbert, R. T.; Rhines, P. B.; Stocker,T. F.; Talley, L. D.; Wallace, J. M.; Science 2003, 299, 2005.
5. Adkins, J. F.; Cheng, H.; Boyle, E. A.; Druffel, E. R. M.; Edwards, R. L.; Science 1998, 280, 725.
6. Goldstein, S. J.; Lea, D. W.; Chakraborty, S.; Kashgarian, M.; Murrell, M. T.; Earth Planet. Sci. Lett. 2001, 193, 167. 7. Miller, D. J.; MSc Dissertation, COPPE/UFRJ, Rio de Janeiro,
Brasil, 2010. (http://capesdw.capes.gov.br/capesdw/resumo.ht ml?idtese=200679431001017028P0).
8. Camoin, G. F.; Sediment. Geol. 1999, 126, 1.
9. Aharon, P.; Schwarcz, H. P.; Roberts, H. H.; Geol. Soc. Am. Bull. 1997, 109, 568.
10. Watanabe, Y.; Nakai, S.; Hiruta, A.; Matsumoto, R.; Yoshida, K.; Earth Planet. Sci. Lett. 2008, 272, 89.
12. Lomitschka, M.; Mangini, A.; Earth Planet. Sci. Lett. 1999, 170, 391.
11. LaMont, S. P.; Hall, G.; J. Radioanal. Nucl. Chem. 2005, 264, 423. 13. Pin, C.; Joannon, S.; J. Anal. At. Spectrom. 2001, 16, 739. 14. Pons-Branchu, E.; Hillaire-Marcel, C.; Deschamps, P.; Ghaleb, B.;
Sinclair, D. J.; Geochim. Cosmochim. Acta 2005, 69, 4865. 15. Watanable, Y.; Nakai, S.; Microchim. Acta 2007, 156, 289. 16. Godoy, M. L. D. P.; Godoy, J. M.; Kowsmann, R.; Santos, G. M.;
Cruz, R. P.; J. Environ. Radioact. 2006, 88, 109.
17. Ludwig K. R.; Isoplot version 3.7, User’s Manual, Berkeley Geochronology Center Special Publication 4, 2008.
18. Ingle, C. P.; Sharp, B. L.; Horstwood, M. S. A.; Parrish R. R.; Lewis, D. J.; J. Anal. At. Spectrom. 2003, 18, 219.
19. Ivanovich, M.; Latham, A. G.; Ku, T. L. In Uranium-series Disequilibrium; Ivanovich, M.; Harmon, R.S., eds.; Clarendon
Press: Oxford, 1992, ch. 3.
20. Hill, S. J.; Fisher, A.; Foulkes, M. In Inductively Coupled Plasma Spectrometry and its Application; Hill, S. J., ed.;
Blackwell Publishing Ltd.: Oxford,2007, ch. 3.
21. Horwitz, E. P.; Chiarizia, R.; Dietz, M. L.; Diamond H.; Anal. Chim. Acta 1992, 266, 25.
22. Adriaens, A. G.; Fasset, J. D.; Kelly, W. R.; Simons D. S.; Adams, F. C.; Anal. Chem. 1992, 64, 2945.
23. Yokoyama, T.; Makishima, A.; Nakamura, E.; Anal. Chem. 1999, 71, 135.
24. Bool, R. A.; Schweitzer, G. K.; Garber, R. W.; J. Radioanal. Nucl. Chem. 1997, 220, 201.
25. Maxwell, S.L.; Nichols, S.T.; Radioact. Radiochem. 2000, 11, 46.
26. Ketterer, M. E.; Jordan, J. A.; Szechenyi, S. C.; Hudson, D. D.; Layman, R. R.; J. Anal. At. Spectrom. 2000, 15, 1569. 27. Grate, J. W.; Egorovi, O. B.; Fiskum, S. K.; Analyst 1999, 124,
1143.
28. Godoy, M. L. D. P.; Godoy, J. M.; Roldão, L. A.; Tauhata, L.; J. Environ. Radioact. 2009, 100, 613.
29. Ku, T-L. In Quaternary Geochronology: Methods and Applications; Noller, J. S.; Sowers, J. M.; Lettis, W. R., eds.;
AGU Reference Shelf 4, 2000, ch.5.
Submitted: July 10, 2011