Article
J. Braz. Chem. Soc., Vol. 26, No. 2, 365-372, 2015. Printed in Brazil - ©2015 Sociedade Brasileira de Química 0103 - 5053 $6.00+0.00
A
*e-mail: [email protected]
Non-Targeted Electrospray Mass Spectrometry-Based Metabolic Fingerprinting
and PLS-DA-Based Classification of Brazilian “Malvas”
Cleverson A. F. Martins,a Mário S. Piantavini,a Rômulo P. Ribeiro,a Erika Amano,b Bruna V. Dal Práb and Roberto Pontarolo*,a
aDepartamento de Farmácia, Universidade Federal do Paraná, 81531-990 Curitiba-PR, Brazil
bDepartamento de Botânica, Universidade Federal do Paraná, 80210-170 Curitiba-PR, Brazil
Malva sylvestris, popularly known as “malva” in Brazil, is a medicinal plant used for its antiinflammatory effects. However, multiple plants are known as “malvas” in Brazil; these species include Sida cordifolia (“malva-branca”) and Pelargonium graveolens (“malva-cheirosa”). In this work, electrospray mass spectrometry metabolic fingerprints from these species were obtained by direct infusion of extracts of commercial samples, purchased as crushed dried leaves. The spectral data were used to classify these species using a partial least squares discriminant analysis method. The identities of all samples were confirmed by morphological analyses, emphasizing the trichomes morphology. While over 80% of the samples were labeled as M. sylvestris or “malva”, in the present study only 37% of these samples were classified as M. sylvestris species. Approximately 50% of these samples were classified as S. cordifolia, whose consumption may be dangerous for patients with cardiovascular diseases. Thus, these analytical and chemometric procedures worked as a fast and simple method for classifying species of “malvas”.
Keywords:Malva sylvestris, Sida cordifolia, Pelargonium graveolens, ESIMS, PLS-DA
Introduction
Traditionally, several medicinal plants have been used for the treatment and management of various inflammatory conditions. Among these plant species, Malva sylvestris L. Malvaceae has been used medicinally throughout the world since 3000 B.C.1 M. sylvestris is effective against mouth and throat diseases and can reduce and relieve swelling, toothaches, thrush, gum inflammation and periodontitis.2,3 Although it is a non-native plant, the Brazilian Public Health System promotes the use of M. sylvestris (popularly known as “malva”) by encouraging the planting, marketing, dispensing and consumption of this species.4 Furthermore, both the macro and microscopic characteristics of this plant are described in the Brazilian Pharmacopoeia.5
However, according to the local name, approximately 21 additional medicinal plants are also known as “malvas”. In addition to M. sylvestris, the species Sida cordifolia L. Malvaceae (“malva-branca”) and Pelargonium graveolens
L’Hér Geraniaceae (“malva-cheirosa”) are widely used and possess antiinflammatory properties. Thus, due to similarities and ambiguities in nomenclature, it is necessary
to develop accurate identification methods to prevent multiple distinct species from being miscategorized as
M. sylvestris. Additionally, the commercially available forms of these plants are limited, consisting of either crushed leaves or powders, which complicates the use of morphological evaluation as a means of distinguishing among species.
S. cordifolia, a plant common to several regions of the country,6,7 is a species rich in sympathomimetic amines such as ephedrine and pseudoephedrine, and alkaloids with cardiovascular effects such as vasicine and vasocinone. Thus, the consumption of this plant can be dangerous in patients with central nervous system diseases, including anxiety and behavioral disorders6,8 and can lead to serious cardiovascular problems, like heart attacks and strokes.7,8
P. graveolens is also well acclimatized throughout Brazil, but despite its antibacterial, antifungal, antioxidant and anti-diabetic effects are well established, it is mainly used to treat stomach and bladder inflammatory disorders.9
throughput alternative to morphological identification is electrospray mass spectrometry (ESIMS) with direct sample injection. By analyzing the unique mass fingerprint of each sample, this technique provides rapid characterization of complex phytochemical matrices without the requirement of time-consuming sample preparation steps or prior chromatographic separation. When used in combination with chemometric analyses, ESIMS-based fingerprinting can be a useful method for species recognition.10-12 Among existing supervised pattern recognition techniques, partial least squares-discriminant analysis (PLS-DA) has been successfully employed to classify samples. The PLS-DA classification is achieved by correlating matrices containing instrumental variable dataset and class affiliations of each sample, and decomposing the two matrices using an algorithm to obtain maximum separation between classes.11 PLS-DA classification coupled with different analytical methods can be useful for quality control purposes of herbal products, such as storage duration and stability prediction,13 distiction of herbs collected from different geographical regions14 and identification of genuine and fake products.15
The aim of this study was to use an ESIMS-based metabolic fingerprinting method alongside a PLS-DA-based supervised pattern recognition method to classify commercial samples of “malvas” and to distinguish canonical M. sylvestris from other similar species.
Experimental
Chemical reagents
Methanol (HPLC grade) and formic acid (88%) were purchased from J. T. Baker Chemicals BV (Deventer, Netherlands). Ultrapure water was purified using a Milli-Q purification system from the Millipore Corporation (Bedford, MA, USA).
Sample collection and acquisition of commercial samples
The three species used in this study were collected from different regions of Brazil and their corresponding voucher information was deposited in the herbarium of the Museu Botânico de Curitiba (MBM, Curitiba, Paraná). These collected samples were used as reference standards for morphological analyses and confirmation of all commercial samples. M. sylvestris (voucher number MBM384458) was collected in February 2013 in Ponta Grossa, Paraná (25°05’01.24”S; 50°12’10.84”W); S. cordifolia (voucher number MBM388190) was collected in Dourados, Mato Grosso do Sul (22°12’04.12”S; 54°54’34.26”W) in August 2013 and P. graveolens (voucher number MBM381610)
was collected in Curitiba, Paraná (25°18’45.87”S; 49°0’29.48”W) in April 2013.
Commercial samples (dried leaves) of “malvas” (n = 60) were purchased in 2012-2013 from different suppliers (herb stores and public markets) in bulk and industrialized bags. These samples were originally labeled as M. sylvestris
or “malva” (n = 49), S. cordifolia or “malva-branca” (n = 7) and P. graveolens or “malva-cheirosa” (n = 4). All samples were analyzed prior to their expiration dates. Once purchased, no additional drying was performed to preserve the original characteristics and chemical composition. All samples were maintained at a controlled temperature (20.0 ± 0.2 °C) and humidity (45-55%).
Sample preparation
All samples were milled and passed through a sieve (707 µm, Endecotts Ltd., England). The resulting powder (1 g) was resuspended in 25 mL of a methanol/water/formic acid solution (69:30:1 v/v/v) and was incubated for 90 min in an ultrasonic bath. The mixture was filtered using a 0.22 µm membrane filter (Millipore, Billerica, MA, USA), and the extract (50 µL) was diluted with the same solvent to a final volume of 1 mL prior to injection into the mass spectrometer.
Mass spectrometry analysis
Mass spectrometry experiments were performed on an Applied Biosystems MDS Sciex API 3200 Triple Quadrupole Mass Spectrometer (Toronto, Canada) equipped with an ESI source. A Harvard 22 Dual Model syringe pump (Harvard Apparatus, South Natick, USA) with a flow rate of 10 µL min−1 was used for direct infusion
of samples into the mass spectrometer. The ESI source was operated in positive ion mode with the following ion-source parameters: ion spray voltage (IS), 4500 V; curtain gas (CUR), 10 psi; nebulizer gas (GS1), 15 psi; declustering potential (DP), 40 eV; and entrance potential (EP), 6 eV. High-purity nitrogen was produced using a nitrogen generator from PEAK Scientific Instruments (Chicago, USA) and was used as both the CUR and GS1. Mass spectra were acquired over a scan range of 100 to 900 Daltons by accumulating 100 scans of 3 seconds each (totaling 8000 per data point). Data acquisition was performed using an MS workstation running Analyst 1.4 software (ABI/Sciex).
Chemometric analysis
principal component analysis (PCA) method to perform an exploratory analysis. The same data set was used to build classification models using PLS-DA method. All pre-processing and subsequent data analyses were performed using PLS Toolbox 2.0 (Eigenvector Research, Wenatchee, WA, USA) operating in Matlab 7.0.1 (Mathworks, Sherborn, MA, USA). The DUPLEX16 algorithm was used to split the spectrometric data into a representative training set of 40 samples (2/3 for each species) and a test set of 20 samples (1/3 for each species) for PCA and PLS-DA analysis. The classes used in PLS-DA were assigned based on the morphological identifications.
Morphological analysis
To examine the morphologies of trichomes, stomata and cuticles, leaf surface images were obtained using a Phenom scanning electron microscope (SEM) (FEI, Hillsboro, Oregon, USA) at a resolution of 30 nM. Samples of crushed or powdered dried leaves were fixed using metallic copper tape and were coated with gold for imaging using a Balzers Union SCD 030 FL 9496 (Balzers, Liechtenstein) device. Additionally, leaf cross sections (15 µm) were embedded in polyethylene glycol 1500 (PEG-1500) and sectioned using a rotary microtome (Leica Microsystem, Germany). The material was stained with solution 1% Astra blue for microscopy (Sigma-Aldrich, St. Louis, USA) and solution 1% safranin O (Merck Millipore, Billerica, USA), and semi-permanent slides were mounted using glycerin gelatin. Photomicrographs were taken using the Cell F image capture software on an Olympus DC300 digital camera coupled to an Olympus BX40 microscope (Olympus, Southall, Middlesex, UK). The morphological analyses comprised evaluation of trichomes, mesophyll (parenchyma composition) and the abaxial and adaxial cuticles, along with the identification and evaluation of druse and mucilaginous epidermal cells.
Results and Discussion
Mass spectrometry analysis
In this work, extracts of commercial samples of “malvas” were directly injected for ESIMS analysis, and the ability of this method to distinguish M. sylvestris, S. cordifolia
and P. graveolens species from each other using a non-targeted metabolic fingerprinting method was assessed by chemometric analysis. Metabolic fingerprinting is a rapid, high throughput and global screening method that allows sample classification in situations where quantification and metabolic identification are generally not employed.17 Moreover, sample preparation, separation and detection
should be as fast and as simple as possible. Direct injection ESIMS analysis meets these criteria. Although both positive and negative ionization modes were tested, the ESI source was operated solely in positive ion mode to ionize a larger number of compounds. Furthermore, the use of positive ion mode facilitated the comparison of the results of this study with prior studies, as positive ion mode is frequently used in plant metabolomic studies.11 Mass spectra were acquired from m/z 100 to 900, which is a range encompassing the masses of a majority of secondary metabolites (alkaloids, terpenoids and phenolic compounds) and metabolite derivatives present in plant leaves.18,19 Figure 1 shows
ESI mass spectra indicating the relative intensities (%) of metabolite ions present in the extracts of each plant species.
The use of a soft ionization source, such as ESI, generally reduces the fragmentation of molecules prior to mass analysis. Therefore, a single metabolite (M) might be represented multiple times in a positive ion mode mass list due to the formation of adducts such as [M + H]+, [M + Na]+, and [M + K]+. Additional mass peaks also result from the presence of isobaric ion species and atomic isotopes.20 The lack of chromatographic separation that is often coupled to high-resolution and high-accuracy mass determination, and the absence of fragmentation profiles obtained by MSn analysis, further complicate the detection and characterization of target metabolites in complex mixtures such as plant extracts.17,21,22 Alternatively, analyses can be performed using Fourier transform ion cyclotron mass spectrometers (FT-ICR-MS) to reduce the ion suppression effects that occur during ESI.22 In light of these challenges, non-targeted MS-based metabolic fingerprinting coupled with chemometric analysis is an emerging analysis method with applications in determining the composition of herbal products,23 evaluating the safety and quality of plant-derived food,24 discriminating among species and examining potentially defective products,25 etc.
Although the commercial samples investigated in this study were harvested at different times, in different seasons, and were kept under non-identical storage conditions, few differences were observed in the resulting mass spectra, in particular for the M. sylvestris and S. cordifolia
samples. Excluding ions with relative intensities lower than 10% of the base peak intensity, it was possible to observe the following ion patterns (m/z): 104, 110, 118, 129, 156, 189, 219, 249, 317, 333 and 351 for M. sylvestris; 104, 112, 118, 129, 156, 189, 205, 219, 277, 317, 333 and 351 for
S. cordifolia; and 104, 110, 118, 156, 189, 233, 357, 371, 401, 415, 445, 459 and 489 for P. graveolens.
A literature review revealed that several metabolites have previously been identified in these “malvas” species within
this m/z range. These metabolites include the flavonoids malvidin 3,5-diglucoside ([M]+ m/z 655), malvidin 3-glucoside ([M]+ m/z 493), malvidin ([M]+ m/z 331), genistein ([M]+ m/z 270), myricetin ([M]+ m/z 318), delphinidin ([M]+ m/z 303), apigenin ([M]+ m/z 270), quercetin ([M]+m/z 302) and kaempferol ([M]+m/z 286); terpenoids, phenolic derivatives (hydroxy and methoxybenzoic acid derivatives, ferulic acid), scopoletin ([M]+ m/z 192), fatty acids/sterols in M. sylvestris;26 flavonol glycosides, alkaloids ephedrine and pseudo-ephedrine ([M]+m/z 165), quinazoline alkaloids vasicine ([M]+m/z 189), vasicinol ([M]+m/z 205) and vasicinone ([M]+m/z 203) and several saponins, steroids and tannins derivatives in S. cordifolia;6,27,28 and flavonol, flanonoids such as myricetin, quercetin, kaempferol and isorhamnetin ([M]+ m/z 316), rhamnose sugars, monoterpenes, sesquiterpenes and essential oils citronellol ([M]+m/z 156) and geraniol ([M]+m/z 154) in P. graveolens.9
Chemometrics analysis
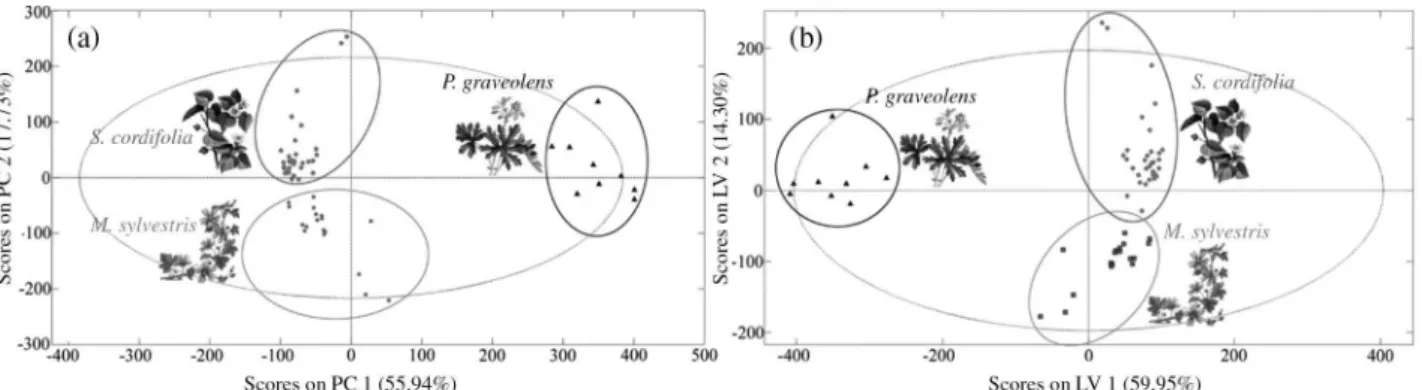
Initially, a PCA model was employed to assess chemometric separation among these species because it allows both the determination and comparison of the main features of each spectrum and highlights links among descriptive variables.25 This method reduces the dimensionality of original data matrix and permits the visualization of clusters within large sets of samples.29
The samples were used as variables for PCA modeling and are described in the PCA score plot (Figure 2a). The matrix X (60 × 8000), which represents the relative intensity (%) of the ions within the evaluated range, was mean centered and the separation of the three species occurred along the first two principal components (PC), which together account for 75.25% of the total variance (60.00% and 15.25%) and provide the most relevant information for species separation. Although the degree of dispersion reflects the difference between species,
the proximity between the cluster of M. sylvestris and
S. cordifolia can be attributed to the fact that both species belong to the Malvaceae family.
The three ions with the highest absolute values for the two principal components and their corresponding ion intensities are listed as follows: 104.2 (0.173), 116.1 (0.135) and 120.2 (0.117) for PC1+; 118.2 (−0.153), 189.1 (−0.045) and 156.3 (−0.026) for PC1−; 189.1 (0.236), 129.0 (0.120)
and 109.9 (0.116) for PC2+; and 116.1 (−0.119), 117.8 (−0.099) and 156.3 (−0.096) for PC2−. These ions are the
most important features for chemometric differentiation within this dataset, and can be used as markers to differentiate among these three species. According to the PCA plot, it can be inferred that ions with m/z ratios of 116.1, 117.8 and 156.3 are correlated with M. sylvestris, ions with m/z ratiosof 104.2, 189.1 and 116.1 are correlated with S. cordifolia samples, and ions with m/z ratios of 118.2, 189.1 and 129.0 are correlated with P. graveolens.
An additional chemometric analysis was performed using the PLS-DA classification method. This technique identifies the latent variables that allow the greatest discrimination between two separate groups of samples based on their spectra (X matrix) and according to their maximum covariance with a target class established in the Y matrix.25 Given that the responses of the Y matrix should be taken into account for the construction of the components, PLS-based methods are called supervised in contrast to, e.g., PCA, which does not use the response for the construction of the new components. This feature explains why PLS-based methods usually performs better than PCA in prediction problems.30 Additionally, while PCA reveals adequate separations between groups only when within-group variability is sufficiently less than between-within-group, PLS-DA is a method that guides a transformation informed by between-group variability to reveal a better clustering.31
Several models were tested, considering the use of different ranges of m/z and pre-processing. The best model was obtained using all acquired relative intensity (%) data (m/z 100-900) and mean-centered pre-processing (Figure 2b). Two latent variables were chosen through venetian blind cross-validation, which accounted for 74.25% of the total variability for the X block and 78.88% for the Y block.
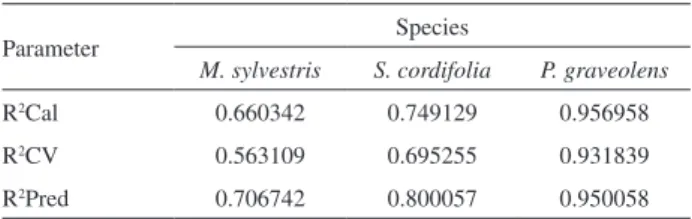
The statistical parameters used to evaluated the PLS-DA model performance on prediction were the squared correlation coefficient of calibration (R2Cal), cross validation (R2CV) and prediction (R2Pred). This values were described in the Table 1.
For the M. sylvestris and S. cordifolia species, although the correlation coefficients ranged from 0.56 to 0.80, the model did not present problems of classification or
prediction. The species P. graveolens showed the best results of correlation coefficient, with a cross-validated predictive ability greater than 93%, for example.
All samples used for calibration and validation were correctly classified, i.e., the sensitivity and specificity values were both close to 1.00 (Figure 3). The classification among species was based on the estimated class value obtained by the PLS-DA model and the discrimination thresholds were determined based on Bayesian statistic. If the estimated class value presented a value higher than the discrimination threshold of the specific PLS-DA model, the sample was classified as belonging to the discriminated class (specie). Thus, samples plotted above the upper dashed line belonged to the species M. sylvestris (Figure 3a), S. cordifolia
(Figure 3b) and P. graveolens (Figure 3c), while the samples whose points are below the upper dashed line belonged to other species. The results obtained by PLS-DA analysis were corroborated by morphological evaluation (Figure 4). Model parameters can also be used to compute indices, which reflect the relative importance of each predictor in the definition of the model itself. In particular, the variable importance in projection (VIP) is a measure of the contribution of each individual variable to the definition of both the X- and the Y-spaces in PLS-modeling.32 Variables were assessed using VIP analysis and the variables with the three highest VIP values were regarded as the most relevant for classification. The three highest m/z values and intensities were 189.1 (835.6), 104.2 (93.94) and 156.3 (76.29) for M. sylvestris; 189.1 (519.4), 104.2 (157.2) and 118.2 (93.5) for S. cordifolia; and 104.2 (250.6), 118.2 (191.3) and 116.1 (131.8) for P. graveolens.
Morphological analyses
The identities of all commercial samples were confirmed by morphological analyses that compared the samples with reference standards whose voucher material was deposited in the MBM herbarium. In a comparative analysis (Figure 4), the most important diagnostic characteristic in leaf morphology of M. sylvestris,
S. cordifolia and P. graveolens is the trichome type. Occurring in all three species, nonglandular trichomes
Table 1. Results for PLS-DA model using ESIMS spectra with mean-centered pre-processing
Parameter Species
M. sylvestris S. cordifolia P. graveolens
R2Cal 0.660342 0.749129 0.956958
R2CV 0.563109 0.695255 0.931839
are simple in P. graveolens, but branched in the other two species. M. sylvestris has a nonglandular trichome with two to four branches, while S. cordifolia has trichomes with four to seven branches. Glandular trichome morphology also differs among species; M. sylvestris
has sessile glandular trichomes with four-cell heads,
P. graveolens presents a glandular trichome with a unicellular stalk and a unicellular head, and S. cordifolia
has sessile glandular trichomes with unicellular heads.
Commercial samples classification
Table 2 shows the percentage of commercial samples originally labeled as M. sylvestris or “malva”, S. cordifolia
or “malva-branca”, P. graveolens or “malva-cheirosa” and the classification results obtained by PLS-DA and morphological analyses. Although more than 80% of the purchased samples were commercially labeled as
M. sylvestris, only approximately 37% of these samples truly belonged to this species according to chemometric and morphological analyses. This observation may be because this species is readily found in several regions of Europe, Asia and North Africa,26 and although it is well adapted to the Brazilian climate, it is not native to Brazil. Thus, the “true” M. sylvestris is a rarer and more valuable species than similar native plants and is therefore susceptible to inaccurate or falsified identification for profit. In Brazil, concern over the proper use of medicinal plants is increasing, and species misidentification is a current problem.4 M. sylvestris is categorized as an officially recommended species by the Brazilian Public Health System and is in great demand by the population. Approximately 50% of “malvas” purchased under the name
M. sylvestris in fact belonged to the S. cordifolia species, which is a native species and is readily found in various
Figure 3. Evaluation of predictability of the PLS-DA model in the classification of the three species of “malvas”. Samples from (a) M. sylvestris ( calibration; validation), (b) S. cordifolia
( calibration; validation) and (c) P. graveolens ( calibration;
validation) falling above the upper dashed line were considered to belong to the species modeled.
regions across Brazil. Interestingly, every sample labeled as S. cordifolia or “malva-branca” was correctly classified. This result indicates pre-existing knowledge of the morphology and folk medicine applications of S. cordifolia, which is a species that is native to Brazil and has been used for over 100 years.33 Species misidentification also occurred in commercial samples labeled as P. graveolens, of which 25% were identified to be S. cordifolia. Although relatively few studies examining the medicinal use of P. graveolens
exist, this plant is used to treat inflammatory disorders of the stomach and bladder, primarily in southern regions of Brazil.34
Conclusions
A non-targeted ESIMS-based metabolic fingerprinting method using direct sample injection shows potential as a rapid method of discriminating among the three main species known as “malvas” in Brazil. The ESIMS spectral data combined with supervised pattern recognition methods based on PLS-DA indicated phytochemical similarities among the three species, yet also allowed identification of distinct sample clusters representing individual species. Species identity assessment of commercial samples (obtained by morphological analyses) showed that although almost 80% were labeled as
M. sylvestris or “malva”, only approximately 37% were indeed M. sylvestris. Approximately half of these samples belonged to the S. cordifolia (“malva-branca”) species, whose consumption can be dangerous due to the presence of specific metabolites that may affect the central nervous and the cardiovascular systems. Overall, the analytical and chemometric procedures demonstrated in this work represent a simple and efficient method for differentiating among “malvas” species and preventing the misclassification of different species as M. sylvestris.
Acknowledgments
The authors are grateful to the Centro de Microscopia Eletrônica-UFPR for the SEM images and to CAPES and CNPq for financial support.
References
1. Henry, A. G.; Piperno, D. R.; J. Archaeol. Sci. 2008, 35, 1943. 2. Loi, M. C.; Poli, F.; Sacchetti, G.; Selenu, M. B.; Ballero, M.;
Fitoterapia2004, 75, 277.
3. Passalacqua, N. G.; Guarrera, P. M.; De Fine, G.; Fitoterapia
2007, 78, 52.
4. Oliveira, S. G. D.; de Moura, F. R. R.; Demarco, F. F.; Nascente, P. S.; Del Pino, F. A. B.; Lund, R. G.; J. Ethnopharmacol. 2012,
140, 428.
5. Farmacopeia Brasileira, 4ª ed.; Atheneu: São Paulo, 2005. 6. Franzotti, E. M.; Santos, C. V.; Rodrigues, H. M.; Mourão,
R. H.; Andrade, M. R.; Antoniolli, A. R.; J. Ethnopharmacol.
2000, 72, 273.
7. Marchei, E.; Pellegrini, M.; Pacifi, R.; Zuccaro, P.; Pichini, S.;
J. Pharm. Biomed. Anal.2006, 41, 1633.
8. Khurana, N.; Gajbhiye, A.; Neurotoxicology2013, 39, 57. 9. Boukhris, M.; Nasri-Ayachi, M. B.; Mezghani, M.; Boukhris, M.;
Ind. Crop. Prod.2013, 50, 604.
10. Goodacre, R.; York, E. V.; Heald, J. K.; Scott, I. M.;
Phytochemistry2003, 62, 859.
11. Schiozer, A. L.; Cabral, E. C.; de Godoy, L. A. F.; Chaves, F. C. M.; Poppi, R. J.; Riveros, J. M.; Eberlin, M. N.; Barata, L. E. S.; J. Braz. Chem. Soc. 2012, 23, 409.
12. Rodrigues, C. M.; Rinaldo, D.; dos Santos, L. C.; Montoro, P.; Piacente, S.; Pizza, C.; Hiruma-Lima, C. A.; Brito, A. R. M. S.; Vilegas, W.; Rapid Commun. Mass Spectrom.2007, 21, 1907. 13. Uarrota, V. G.; Moresco, R.; Coelho, B.; Nunes, E. C.; Peruch, L. A. M.; Neubert, E. O.; Rocha, M.; Maraschin, M.; Food Chem. 2014, 161, 67.
14. Wu, E. Q.; Liang, C.; Chen, J.; Tran, M. N.; Hong, C. H.; Jang, Y.; Park, K. L.; Bae, K.; Kim, Y. H.; Kang, J. S.; Food Chem. 2011, 127, 755.
15. Versari, A.; Laurie, V. F.; Ricci, A.; Laghi, L.; Parpinello, G. P.;
Food Res. Int. 2014,60, 2.
16. Snee, R. D.; Technometrics1977, 19, 415.
17. Dunn, W. B.; Ellis, D. I.; TrAC, Trends Anal. Chem. 2005, 24, 285.
18. Plazonic, A.; Bucar, F.; Males, Z.; Mornar, A.; Nigovic, B.; Kujundzic, N.; Molecules2009, 14, 2466.
19. Wüst, M.; Rexroth, A.; Beck, T.; Mosandl, A.; Chirality1998,
10, 229.
20. Hagel, J. M.; Facchini, P. J.; Phytochem. Rev.2008, 7, 479. 21. Wolfender, J. L.; Rudaz, S.; Choi, Y. H.; Kim, H. K.; Curr. Med.
Chem.2013, 20, 1056.
Table 2. Chemometric and morphological analysis of the commercial samples of “malvas”
Commercial samples labelsa / % Chemometric and morphological
analysis / %
M. sylvestris or
“malva” 81.8 M. sylvestris S. cordifolia P. graveolens 36.8 51.0 12.2
S. cordifolia or
“malva-branca” 11.6 M. sylvestris S. cordifolia P. graveolens 0.0 100.0 0.0
P. graveolens or
“malva-cheirosa” 6.6 M. sylvestris S. cordifolia P. graveolens 0.0 25.0 75.0
22. Dettmer, K.; Anorov, P. A.; Hammock, B. D.; Mass Spectrom. Rev.2007, 26, 51.
23. Commisso, M.; Strazzer, P.; Toffali, K.; Stocchero, M.; Guzzo, F.; Comput. Struct. Biotechnol. J. 2013, 4, 1.
24. Oms-Oliu, G.; Odriozola-Serrano, I.; Belloso-Martín, O.; Food Res. Int.2013, 54, 1172.
25. Bassbasi, M.; De Luca, M.; Ioele, G.; Oussama, A.; Ragno, G.;
J. Food Comp. Anal.2014, 33, 210.
26. Gasparetto, J.C.; Martins, C. A. F.; Hayashi, S. S.; Otuky, M. F.; Pontarolo, R.; J. Pharm. Pharmacol.2012, 64, 172.
27. Franco, C. I. F.; Morais, L. C. S. L.; Quintans-Junior, L. J.; Almeida, R. N.; Antoniolli, A. R.; J. Ethnopharmacol. 2005,
98, 275.
28. Momin, M. A. M.; Bellah, S. M.; Rahman, S. M. R.; Rahman, A. A.; Murshid, G. M. M.; Emran, T. B.; Asian. Pac. J. Trop. Biomed.2014, 4, 18.
29. Brereton, R. G.; Chemometrics: Data Analysis for the Laboratory and Chemical Plant, 1st ed.; Wiley: New York, 2003.
30. Boulesteix, A. L.; Strimmer, K.; Briefings Bioinf.2007, 8, 32. 31. Worley, B.; Halouska, S.; Powers, R.; Anal. Biochem. 2013,
433, 102.
32. Marini, F.; Chemometrics in Food Chemistry, 1st ed.; Elsevier:
Amsterdam, Netherlands, 2013.
33. Breitbacha, U. B.; Niehues, M.; Lopes, N. P.; Faria, J. E. Q.; Brandão, M. G. L.; J. Ethnopharmacol.2013, 147, 180. 34. De Souza, G. C.; Haas, A. P. S.; Von Poser, G. L.; Schapovalc,
E. E. S.; Elisabetsky, E.; J. Ethnopharmacol.2004, 90, 135.