Article
Printed in Brazil - ©2017 Sociedade Brasileira de Química0103 - 5053 $6.00+0.00
*e-mail: [email protected]
Methylene Violet 3 RAX Dye as a New Reagent for the Determination of Nitrite in
Cured Meats and Vegetables
Caroline O. da Rocha, João Flávio S. Petruci* and Arnaldo A. Cardoso
Departamento de Química Analítica, Universidade Estadual Paulista, 14800-970 Araraquara-SP, Brazil
In this contribution we propose, for the first time, the use of Methylene Violet 3 RAX dye for the detection and determination of nitrite in cured meats and vegetables. Quantification is based on the decrease in absorbance of the dye, which is proportional to the nitrite concentration. The proposed method presents linear response (r > 0.99) in the range from 1.8 to 9 µmol L-1 of nitrite,
with a limit of detection of 0.14 µmol L-1. Satisfactory accuracy with the official Association of
Official Agricultural Chemists (AOAC) method was achieved, and the method was successfully applied to a wide range of cured meats and vegetables. The proposed method offers similar or superior performance to other optical methods used for the determination of nitrite in different matrices, with advantage in terms of reduction of chemical waste for each analysis, by minimizing amounts of reagents and products.
Keywords: nitrite, food analysis, cured meat, spectrophotometry, Methylene Violet 3RAX
Introduction
Nitrite was first recognized as an active component in the meat curing process at the end of the 19th century.1
The presence of nitrite as an impurity in salt resulted in an attractive red color in cured meats such as bacon, ham, and sausages, and also enhanced the flavor.2 Moreover, nitrite is
widely recognized to protect against Clostridium botulinum spores, assisting in the prevention of botulism.3 In
addition to cured meats, nitrogen species occur naturally in vegetables consumed by humans. The nitrate ion is the main species present, because plants take up nitrogen from the soil in this form. Nitrates can be reduced to nitrites due to the action of bacteria.4
It is well known that once in the stomach, nitrite can react with secondary and tertiary amines to form N-nitroso compounds.5 Exposure to N-nitrosamines shows a strong
association with increased risk of gastric and esophageal cancer.6 In addition, nitrite ions oxidize iron atoms in the
hemoglobin of red blood cells, forming methemoglobin, resulting in decreased oxygen carrying capacity of the blood and leading to the disease known as methemoglobinemia.7
High concentrations of nitrite in drinking water can be hazardous to health, especially in the case of infants and pregnant women.8
Due to these toxic effects, agencies worldwide regulate the nitrite content of foods. An acceptable daily intake (ADI) for nitrite of 0-0.07 mg kg-1 body weight per day was
established by the Joint FAO/WHO Expert Committee on Food Additives (JECFA).9 The Brazilian National Health
Surveillance Agency (ANVISA), the federal regulatory agency responsible for the monitoring of food additives in Brazil, has established a concentration limit for nitrite in cured meats of 150 mg kg-1.10
Analytical methods have been developed for the monitoring of nitrite in a wide range of matrices, including cured meats and vegetables.11 According to the official
Association of Official Agricultural Chemists (AOAC) method reported in the literature,12 nitrite is determined
by diazotization with sulfanilic acid and coupling with N-(1-naphthyl)-ethylenediamine dihydrochloride (NED) to form a highly colored azo dye (λMAX = 540 nm). However,
this method is time-consuming (total reaction time of 30 minutes) and requires two reaction steps. Moreover, for each single nitrite analysis is spent about of 87 and 27 µmol, for sulfanilic acid and NED, respectively. Different methods such as KMnO4 oxidation, TiO2-photocatalysis
and photo-Fenton reaction have been employed for the degradation of wastes from this nitrite determination.13
Other analytical techniques reported in the literature include spectrophotometry,7,14-17 chromatography,18
electrochemistry.6 Separation techniques (i.e., high
performance liquid chromatography and capillary electrophoresis) provide suitable sensitivity, however they are usually time-consuming, laborious and require bulkiness and expensive instruments. Electrochemical methods generally suffer interference from the matrix, causing decrease of accuracy in the results.
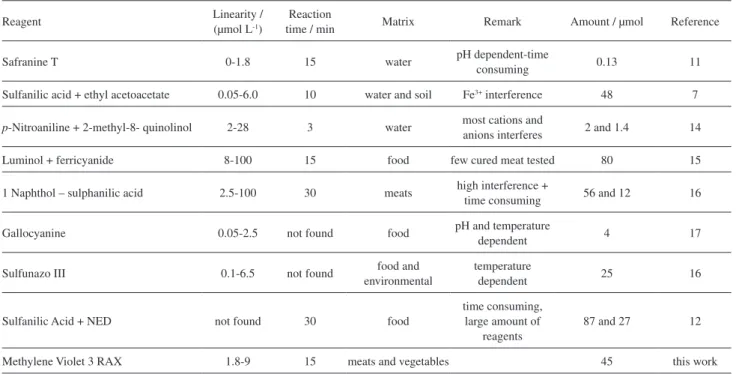
Optical methods, based on absorbance or fluorescence, are most widely employed for nitrite determination. In the last decades, a large number of new compounds have been developed and applied for the detection of nitrite (Table 1). However, only a few methods have been developed and tested for the determination of nitrite in a wide range of foods and vegetables, and there is still a need for improved analytical methods suitable for quality control purposes.
The present work describes the use of Methylene Violet 3 RAX dye (3-amino-7-(diethylamino)-5-phenylphenazinium chloride; MV 3 RAX; CAS Number: 4569-86-2) to determine nitrite in different matrices (cured meats and vegetables). The reaction between the dye and nitrite in an acid medium leads to a decrease in absorbance intensity that is inversely proportional to the concentration of nitrite in the solution. The method offers features including high sensitivity and selectivity, no use of toxic reagents, ease of operation, no interference from other components present in complex food matrices and using reduced quantity of reagent compared to the official AOAC method.
Experimental
Materials and methods
Spectrophotometer
Measurements of absorbance spectra and intensities employed a Hitachi Model U-2000 spectrophotometer fitted with a 10 mm quartz cuvette.
Reagents and standard solutions
All reagents were analytical grade and solutions were prepared using ultrapure water obtained from a Milli-Q system (Direct-Q® UV, Millipore, USA). Stock solutions of
4.5 mmol L-1 nitrite (NaNO
2, Merck, Darmstadt, Germany)
and 4 mmol L-1 Methylene Violet 3 RAX (Sigma-Aldrich,
St. Louis, USA) were prepared by dissolving appropriate amounts of the corresponding salts in water. A few drops of chloroform were added to the nitrite solution in order to inhibit bacterial growth. Working solutions were prepared daily by appropriate dilution of the stock solutions. The sulfanilic acid reagent was prepared by dissolving 600 mg of sulfanilic acid in 50 mL of hot water. After cooling, a 20 mL volume of glacial acetic acid was added and the mixture was diluted to 100 mL with deionized water. The NED reagent was prepared by dissolving 20 mg of N-(1-naphthyl)-ethylene diammonium dichloride in 20 mL of glacial acetic acid and diluting to 100 mL with deionized water.
Table 1. Comparison of the analytical performance of spectrophotometric nitrite determination
Reagent Linearity / (µmol L-1)
Reaction
time / min Matrix Remark Amount / µmol Reference
Safranine T 0-1.8 15 water pH dependent-time consuming 0.13 11
Sulfanilic acid + ethyl acetoacetate 0.05-6.0 10 water and soil Fe3+ interference 48 7
p-Nitroaniline + 2-methyl-8- quinolinol 2-28 3 water most cations and anions interferes 2 and 1.4 14
Luminol + ferricyanide 8-100 15 food few cured meat tested 80 15
1 Naphthol – sulphanilic acid 2.5-100 30 meats high interference +
time consuming 56 and 12 16
Gallocyanine 0.05-2.5 not found food pH and temperature
dependent 4 17
Sulfunazo III 0.1-6.5 not found environmentalfood and temperature dependent 25 16
Sulfanilic Acid + NED not found 30 food
time consuming, large amount of
reagents
87 and 27 12
Sample preparation
Meat products and vegetables were acquired from local supermarkets. Sausage, pork sausage, bologna, pepperoni, bacon, salami and ham samples were cut into pieces and homogenized manually using a mortar and pestle. Lettuce, spinach, and cabbage samples were first washed with deionized water. Approximately 20 g of the sample was homogenized using a high shear mixer (ULTRA-TURRAX Q252-K28, Quimis, Brazil) operated at 6000 rpm for 3 min at room temperature (23 °C). A representative amount (5.0 g) of each homogenized sample was weighed out and placed in a Falcon tube. The sample was mixed with 30 mL of deionized water at 80 ºC, then stirred for 2 min and heated at 80 ºC for 1 h. After cooling to room temperature, the sample was filtered (Whatman 41, GE Healthcare Life Sciences, USA) and the volume was adjusted to 50.0 mL with deionized water. An aliquot of 2.0 mL was transferred to a volumetric flask and the volume was adjusted to 10.0 mL with deionized water.
Design of experiments (DoE)
The optimum conditions of the nitrite determination were obtained by using the design of experiments with a full factorial design (two-levels and two-factors) and surface response analysis. All the data were evaluated using Statistica 7.0 package software.
Nitrite determination
Aliquots of 11.25 mL of Methylene Violet 3 RAX working solution (45 µmol), 2 mL of HCl (1 mol L-1), and
830 µL of sample extract solution were transferred to a 25.0 mL volumetric flask and the volume was completed with deionized water. The flask was kept at room temperature for 15 min. The solution was then transferred to a cuvette and the absorbance (λ = 555 nm) was measured
against a blank.
Nitrite determination by the AOAC method (973.31)
A 5 mL aliquot of the sample extract solution was transferred to a 25.0 mL volumetric flask, followed by addition of 2.5 mL of sulfanilic acid reagent (87 µmol). The mixture was homogenized and then left to stand for 15 min at room temperature, followed by addition of 2.5 mL of NED reagent (27 µmol) and adjustment of the volume to 10.0 mL. After 15 min, the absorbance was measured at 540 nm.
Results and Discussion
Reaction between nitrite and Methylene Violet 3 RAX dye
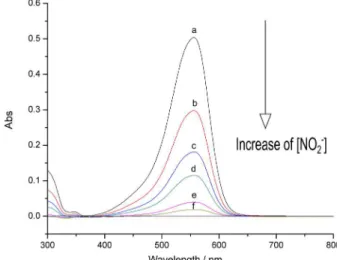
The structure of the Methylene Violet 3 RAX molecule includes an amino group that can react with nitrous acid (generated from reaction between nitrite and a strong acid), which results in the formation of diazonium salts(Figure 1). The absorbance spectrum of the dye solution showed maximum absorbance at 555 nm (Figure 2).
The reaction causes a decrease in absorbance intensity that is proportional to the amount of nitrite present in the solution. The analytical procedure was optimized in order to establish the best conditions for the reaction between the dye and nitrite, maximizing the analytical signal.
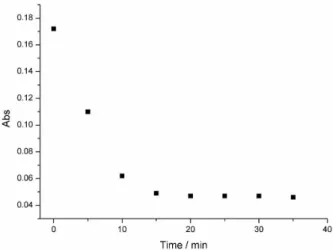
Effect of reaction time
The time necessary to the reactants to reaction equilibrium, thus producing a stable absorbance to be measured was evaluated. As shown in Figure 3, the absorbance decreased with reaction time, becoming
Figure 2. Absorbance spectra of Methylene Violet 3 RAX in aqueous solution with increasing nitrite concentration: (a) blank; (b) 1.8; (c) 3.6; (d) 5.4; (e) 7.2; (f) 9 µmol L-1.
stable after 15 min up to at least 60 min. Therefore, in all subsequent experiments, the absorbance was measured after 15 min.
Optimization of experimental conditions
Herein, a design of experiments was used to obtain the best conditions of the nitrite-dye reaction and, consequently, resulting in maximization of the analytical signal. Firstly, a full factorial design in two levels (+1 and –1) of two factors (concentration of Methylene Violet 3RAX and HCl) was performed. Upper (+1) and lower (–1) levels were selected for each variable. In order to account for all possible combinations of factor levels, four independent experiments were randomly performed using two replicates, corresponding to a total of eight assays.
A Pareto chart is a graphical representation of the estimated effects of the variables. In this chart, the bars (variables) that exceed the significance line indicate a statistically significant influence on the result. In this case, the most significant effect was found for the Methylene Violet concentration (graph not shown). Despite having lower relative significance, an effect of the acid concentration was also observed.
Based on this evidence, these variables were studied in more detail using response surface analysis. The variables were analyzed at five levels, with one central point and the other levels located on a circumference of radius √2 from the central point (which was coded as zero). Table 2 lists the variables and levels used. The optimized conditions obtained using the response surface analysis experiments were established as 9 µmol L-1 of Methylene Violet 3 RAX
and 80.0 mmol L-1 of HCl. In terms of volume, these
corresponded to 11.25 and 2 mL of the dye and acid working solutions, respectively.
Evaluation of interferences
Investigation was made of possible interferences in the analytical signal caused by the presence of ions other than nitrite. The influences of SO42−, NO3−, CO32−, Cl−,
PO43
−
, SCN−
, C2O6
−
, Cu2+, Fe3+, Na+, K+ and Mg2+ on the
determination of 5 µmol L-1 of nitrite were investigated
using different proportions of the interfering ion (1:1, 1:5, and 1:10). Interference was considered whether the foreign ions produced deviation in the analytical signal superior than 2%. The results showed that the ions evaluated did not interfere in the determination of nitrite based on the reaction with Methylene Violet 3 RAX.
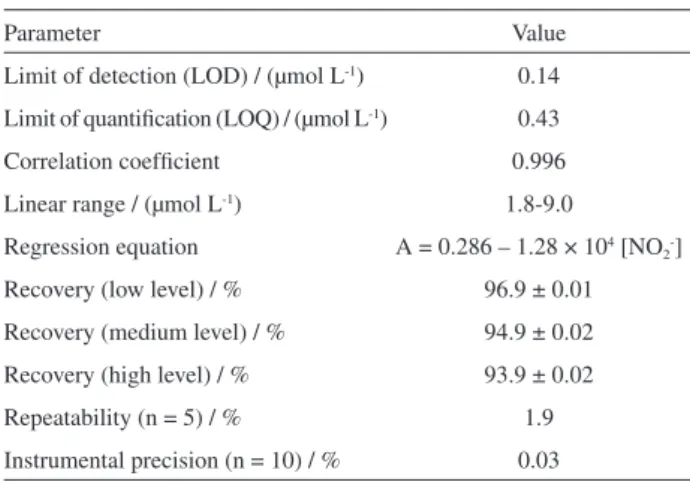
Analytical figures of merit
For quantitative purposes, a calibration function was obtained from a plot of the absorbance of the dye solution at 555 nm against nitrite concentrations in the range from 1.8 to 9.0 µmol L-1. For each concentration, the mean
value of three replicate measurements was calculated. The proposed method showed excellent linearity over this concentration range. The calculated limits of detection (LOD) and quantification (LOQ), considered as three and ten times the standard deviation of the blank signal, were 0.14 and 0.43 µmol L-1, respectively.
The accuracy of the method was evaluated in terms of recovery, using sausage as an example food matrix. Samples were spiked with known amounts of nitrite and then submitted to the extraction procedure. Recoveries were calculated by comparing the absorbances obtained for samples spiked before and after the extraction. The mean recoveries revealed excellent accuracy, with values ranging from 93 to 97%. All the analytical results are summarized in Table 3.
Application using real samples
Samples of sausage, pork sausage, bologna, pepperoni, bacon, salami, ham, lettuce, spinach, and cabbage were
Figure 3. Change in absorbance as a function of time after nitrite addition.
Table 2. Experimental variables considered in the surface analysis experiment for conditions optimization
Level Variable
MV 3RAX / (µmol L-1) HCl / (mmol L-1)
–√2 4.00 20
–1 5.16 30
0 8.00 60
1 10.8 90
√2 12.0 100
analyzed by the proposed methodology and compared to the standard method for nitrite determination. For each sort of sample, a mean of three replicates was used to concentration calculation. The results (Table 4) obtained using Methylene Violet 3 RAX were consistent with those obtained by the AOAC method, in terms of both precision and accuracy, as confirmed by F-test and t-test calculations (all values fell below the critical values for t of 2.98, and for Fof 19.0, at p = 0.05). Therefore, the results obtained by the new and the official method are no statistical distinguishable at the 95% confidence level. It suggests that the proposed approach might be employed to monitoring of nitrite in cured meat and vegetable samples with suitable accuracy.
Conclusions
In this study, we propose the use of a new reactant for the sensitive and selective spectrophotometric
determination of nitrite in cured meats and vegetables. The proposed method is based on the reaction between Methylene Violet 3 RAX and nitrite in aqueous media, resulting in a decrease in the absorbance measured at 555 nm that is proportional to the nitrite concentration. The experimental conditions were optimized using factorial design, enabling a limit of detection of 0.14 µmol L-1 to
be achieved. Compared to other methods described in the literature, this new method offers similar or superior performance in terms of reaction time, sensitivity, and range of food applications. We emphasize that this nitrite determination method uses about one-third mol of organic molecules than the Griess method. This means that the generation of waste is much smaller and consequently less potential to cause pollution.
Acknowledgments
The authors thank FAPESP (São Paulo Research Foundation) (No. 2013/22995-4), CAPES (Coordination for the Improvement of High Level Personnel), and CNPq (National Council for Scientific and Technological Development) for financial support.
References
1. Pereira, E. A.; Petruci, J. F. S.; Cardoso, A. A.; Food Anal.
Methods2012, 5, 637.
2. Heaton, K. M.; Cornforth, D. P.; Moiseev, I. V.; Egbert, W. R.; Carpenter, C. E. M.; Meat Sci.2000, 55, 321.
3. Stalikas, C. D.; Konidari, C. N.; Nanos, C. G.; J. Chromatogr. A
2003, 1002, 237.
4. Huang, K.-J.; Wang, H.; Guo, Y.-H.; Fan, R.-L; Zhang, H.-S.;
Talanta2006, 69, 73.
5. Merusi, C.; Corradini, C.; Cavazza, A.; Borromei, C.; Salvadeo, P.; Food Chem. 2010, 120, 615.
6. Yilmaz, Ü. T.; Somer, G.; J. Electroanal. Chem. 2008, 624, 59. 7. Sreekumar, N. V.; Narayana, B.; Hegde, P.; Manjunatha, B. R.;
Sarojini, B. K.; Microchem. J.2003, 74, 27. 8. Butt, S.; Talanta2001, 55, 789.
9. Jimidar, M.; Hartmann, C.; Cousement, N.; Massart, D. L.;
J. Chromatogr. A1995, 706, 479.
10. http://portal.anvisa.gov.br/documents/33916/391619/Portaria %2Bn%25C2%25BA%2B1004%252C%2Bde%2B11%2Bde% 2Bdezembro%2Bde%2B1998.pdf/41e1bc8f-b276-4022-9afb-ff0bb3c12c0c accessed in January 2017.
11. Viñas, P.; Cordoba, M. H.; Pedreno, C. S.; Int. J. Environ. Anal.
Chem.1987, 32, 279.
12. Association of Official Analytical Chemists (AOAC); Methods
of Analysis. 973.31 Nitrites in Cured Meat. Colorimetric
Method; AOAC: Rockville, 1996; Association of Official
Table 3. Analytical performance of the proposed method for nitrite determination
Parameter Value
Limit of detection (LOD) / (µmol L-1) 0.14
Limit of quantification (LOQ) / (µmol L-1) 0.43
Correlation coefficient 0.996
Linear range / (µmol L-1) 1.8-9.0
Regression equation A = 0.286 – 1.28 × 10⁴ [NO 2-]
Recovery (low level) / % 96.9 ± 0.01
Recovery (medium level) / % 94.9 ± 0.02 Recovery (high level) / % 93.9 ± 0.02
Repeatability (n = 5) / % 1.9
Instrumental precision (n = 10) / % 0.03
Table 4. Comparison of the proposed and AOAC method12 for the
determination of nitrite in meat and vegetables
Matrix Proposed method /
(mg kg-1)
AOAC method / (mg kg-1)
Sausage 133 ± 3 127 ± 2
Ham < LOD < LOD
Bacon 15 ± 7 14 ± 8
Salami < LOD < LOD
Pork sausage < LOD < LOD
Pepperoni 36 ± 10 38 ± 10
Bologna < LOD < LOD
Cabbage < LOD < LOD
Spinach 36 ± 5 38 ± 6
Lettuce < LOD < LOD
Analytical Chemists (AOAC); Methods of Analysis. 993.03
Nitrate in Baby Foods. Spectrophotometric Method; AOAC: Rockville, 1993.
13. Chowdhuri, A.; Gupta, V.; Sreenivas, K.; Sens. Actuators, B
2003, 93, 572.
14. Nair, J.; Gupta, V. K.; Anal. Chim. Acta1979, 111, 311. 15. He, D.; Zhang, Z.; Huang, Y.; Hu, Y.; Food Chem.2007, 101,
667.
16. Nouroozi, S.; Mirshafian, R.; Talanta2009, 79, 1149. 17. Ensa, A. A.; Kazemzadeh, A.; Anal. Chim. Acta1999, 382, 15. 18. Ferreira, I. M. P. L. V. O.; Silva, S.; Talanta2008, 74, 1598.
Submitted: December 9, 2016