A
r
ti
c
le
*e-mail: [email protected]
Mercury Adsorption on Natural and Organofunctionalized Smectites -
Thermodynamics of Cation Removal
Denis L. Guerra, Maria R. M. C. Santos and Claudio Airoldi*
Instituto de Química, Universidade Estadual de Campinas, CP 6154, 13083-970 Campinas-SP, Brazil
Uma amostra natural de esmectita oriunda do estado do Piauí, Brasil, foi organofuncionalizada com 3-mercaptopropiltrimethoxissilano e 3-aminopropiltriethoxissilano. O espaçamento basal da argila natural é de 0,99 nm e área superficial 48 m2 g-1. Houve um aumento no espaçamento
basal para 1,84 e 2,01 nm e o aumento da área específica para 781 e 795 m2 g-1 para as argilas
quimicamente modificadas, respectivamente. A argila natural e a argila quimicamente modificada adsorveram cátions mercúrio em solução aquosa em pH 3,0 e 298 ± 1 K. Os modelos de isotermas de adsorção de Langmuir, Redlich-Peterson e Toth foram aplicados para ajuste dos dados experimentais com aproximação não linear. Para as interações cátion/centros básicos para cada esmectita na interface sólido/líquido foi utilizada metodologia calorimétrica e foram obtidas as constantes de equilíbrio e os efeitos térmicos exotérmicos. Considerando o número interativo de moles para cada cátion e as constantes de equilíbrio, a entalpia, ∆intHo (−11,98 a −13,93kJ mol-1) e a energia livre
de Gibbs negativa, ∆intG
o (−22,4 ± 0,1 a −23,9 ± 0,1kJ mol-1) foram calculadas, o que permitiram
a determinação da entropia positiva ∆intS
o (51 ± 01 a 55 ± 2J K-1 mol-1). As interações cátion/
centros básicos são de natureza espontânea como demonstram os valores de energia livre de Gibbs, dando o conjunto de dados favoráveis como expressam a entalpia exotérmica e a entropia positiva, mostrando que a esmectita natural e as quimicamente modificadas têm habilidade em complexar mercúrio. Logo, esses materiais são úteis na remoção de mercúrio em um ecossistema.
A natural smectite clay sample from Piauí State, Brazil, was organofunctionalized with 3-mercaptopropyltrimethoxysilane and 3-aminopropyltriethoxysilane silyating agents. The basal spacing of 0.99 nm and surface area of 48 m2 g-1 for natural clay increased to 1.84 and 2.01 nm, and
781 and 795 m2 g-1 for modified clays, respectively. The natural and chemically immobilized clay
samples adsorb mercury cations from aqueous solutions at pH 3.0 at 298 ± 1 K. The Langmuir, Redlich-Peterson and Toth adsorption isotherm models were applied to fit the experimental data with a nonlinear approach. From the cation/basic center interactions for each smectite at the solid-liquid interface, by using calorimetry methodology, the equilibrium constant and exothermic thermal effects were obtained. By considering the net interactive number of moles for each cation and the equilibrium constant, the enthalpy, ∆intH
o (−11.98 to −13.93kJ mol-1) and negative free
Gibbs energy, ∆intG
o (−22.4 ± 0.1 to −23.9 ± 0.1kJ mol-1) were calculated. These values enabled
the determination of positive entropy, ∆intSo (51 ± 01 to 55 ± 2J K-1 mol-1). The cation-basic center
interactions are spontaneous in nature as demonstrated from favorable enthalpic and entropic results. Natural and anchored smectites have the ability to complex mercury, acting as useful materials for removal of this hazardous metal from an ecosystem.
Keywords: smectite, adsorption, mercury, thermodynamic
Introduction
Smectite is one of the most important clay minerals with a diversity of industrial applications, favored by its versatility in modifying the original properties for diverse
uses.1 The methodology of surface modification includes,
in principle, intercalation inside the well-organized lamellar arrangement, where new species such as enzymes, as reported for lipase, were successfully immobilized. Other chemical modifications can be obtained after including
inorganic pillars in the free lamellar spaces,3,4 which increase
the available surfaces for use in organofunctionalization
processes.5 As expected, intercalation followed by
results in changing the amount of reactive acidic and basic sites on the internal and external surfaces, which represents
a fertile research field.1-4
The potentiality of the organosilane compounds in the chemical organofunctionalizing process has been widely explored for many inorganic polymeric natural or synthetic surfaces, such as those recently described for
layered natural smectitesilicates.1,6 Thus, the synthetic
organoclay products have been successfully applied as
electrode for electrochemical use as biosensors,7 support for
enzyme immobilizations,8 in hybrid compounds,9 antifugal
compounds10 and in polymeric nanocomposites.11
Taking into account the pristine smectite chemical composition with original acidic or basic active functions, useful for surface chemical modification, through inclusion of some other active groups, then, the possibility of applications is increased significantly, for example, those related to cation removal from waters, specially when
these are simulated wastewater effluents.12 For this purpose
mercury was chosen in the present investigation due to the fact that this metal can be discharged to the environment, arising, for instance, from paint production, pharmaceutical and other industrial chemical processes, to cause damage
to soil, aquatic media, fauna and flora.10 To eliminate these
undesirable poisons from an ecosystem, several methods have been proposed, such as electrodeposition, solvent extraction, membrane separation, and adsorption on
activated or/and chemically modified clays.11-15
The aim of the present investigation is focused on the retention capacity and thermal effects of a smectite from the northeast region of Brazil, Piauí state, as received and when chemically modified, for adsorbing divalent mercury. To explore its availability, the natural clay was organofunctionalized with the silylating agents 3-mercaptopropyltrimethoxysilane and 3-aminopropyltriethoxysilane. The adsorption process was fitted to Langmuir, Redlich-Peterson and Toth models for nonlinear regression methods. The unmodified and chemically modified matrices were used for divalent mercury adsorption processes investigated at pH 2.0 at room temperature. The energetic effect caused by mercury/ nitrogen and sulfur basic centers on smectite interaction at the solid/liquid interface was determined through a calorimetric titration procedure.
Experimental
Raw material
The sampled (S) clay from northeast region of Brazil, Piauí state, with particle size less than 2 µm, was separated
by sedimentation. The cation-exchange capacity (CEC) was measured in order to evaluate its potential use for intercalation and also organofunctionalization. The exchange property was determined by the ammonium
acetate methodology, using a concentration of 2.0 mol dm-3
ammonium acetate at pH 8.0, to give 1.25 mmol g-1 on an
air-dried basis.1
Sample preparation
Thenaturalclay sample was ground and sieved through
a USS 200 mesh (75 µm) sieve, dried in an oven at 333 K to reach humidity between 12 and 15%, followed by thermogravimetric technique. A preliminary X-ray powder diffractometry analysis was used to confirm the presence of the smectite clay fraction through conventional sample preparation procedures, such as air-dried, ethylene glycol
solvated and heated as required at 573 and 773 K.16
Chemical modification
The organofunctionalization consisted in suspending
two portions of 5.0 g of the dried clay in 100 cm3 of dry
toluene with stirring, which was followed by individual
addition of 5.0 cm3 of 3-mercaptopropyltrimethoxysilane
(MPS) or 3-aminopropyltriethoxysilane (ASP) silylating agents to the suspension. The mixture was allowed to react under continuous stirring and a dry nitrogen atmosphere at the solvent ebullition temperature for 3 h. The suspension was filtered through sintered glass, washed with toluene, acetone and dried under vacuum for 12 h, to give the
products SMPS and SAPS, respectively.
Adsorption
The batch methodology was used to concentrate mercury cation from solution in order to obtain the isotherm. For this procedure, a series of samples of about 25.0 mg of each synthesized smectite were suspended in
20.0 cm3 of aqueous mercury chloride solution at different
concentrations, varying from 0.50 to 15.00 mmol dm3.
The samples were mechanically shaken at 298 ± 1 K for
12 h,a time that was previously established from identical
experiments, where constant masses were shaken for
variable times,13-15 after which the solid was separated
The same procedure for the isotherms of time and concentration was used to calculate the number of moles
of the metallic cation adsorbed per gram (Nf), which is
given by the difference between the initial (Ni) and the
remaining number of moles of metal in the supernatant
(Ns), divided by the mass (m) of the compound used,17-20
as given in equation 1.
(Ni – Ns)
Nf = ––––––––– m (1)
As expected, the number of moles of cation adsorbed
(Nf) increased with concentration in the supernatant (Cs)
as a function of pH and time (t), until the plateau related to total saturation of the basic centers in the layered structure
was saturated, to give the maximum adsorption.21,22
The most commonly used isotherms are those related to the Langmuir model, which was originally derived for gas adsorption on planar surfaces such as glass, mica
and platinum. Theprocess was successfully extended to
heavy metal ion adsorptions on porous surfaces. For this adsorption model the quantity adsorbed is related to the equilibrium solution concentration of the adsorbate, after
adjusting to KL and b parameters. From this procedure,
the plateau of the isotherm enables KL determination that
reflects the affinity of the active sites on the surface. On the other hand, the b value is the upper limit and represents the maximum adsorption, determined by the number of reactive
surface sites,22 as represented by equation 2:
KLCbS
Nf = ––––––– (2)
1 + CbS
Taking into account the experimental data, Cs/Nf and the
so-called distribution coefficient KLcan be plotted against
the concentration of the supernatant. If the Langmuir equation can be adjusted to the studied system, the measured
data should fall on a straight line, whose slope gives KL
and the intercept the b values, derived from 1/KLb and
1/b, resulting from the angular and linear coefficients,20-22
as represented by equation 3.
CS 1 + CS
––– = –––––– + ––– (3)
Nf = (KLb) + b
Another fitting for the adsorption process is established by the Redlich-Peterson (equation 4) and Toth (equation 5)
equations: 23
Nf = KRPaRPCS/(1 + KRPCSb) (4)
Nf - KTaTCS/(1 + HTCSb)1/b (5)
where KRP and KT are constants related to adsorption
capacity, aRP is the Redlich-Peterson capacity constant, aT is
the Toth capacity constant and b is an affinity constant of the
adsorbent, with 0 < b > 1. Although these equations were
previous employed empirically, they can be derived with the assumption of a continuous variation in thermal effects during the adsorption process. There is no assurance that the derivations of the Redlich-Peterson and Toth equations are unique; consequently, if the collected data can fit to the equations, it is only likely, but not proven, that the surface is heterogeneous. The Redlich-Peterson and Toth models unfortunately predict both infinite adsorption at infinite concentration and a corresponding thermal effect related
to the adsorption at zero coverage.23
Non-linear regression was compared to obtain the optimum kinetic sorption and isothermal parameters. A trial and error procedure was employed for non-linear methods using the solver add-in functions of Microsoft Excel software. In the trial and error procedure, isotherm and thermodynamic parameters were determined by
maximizing the coefficient of determination values.24 The
least squares method was used to analyze the linear forms of the thermodynamic and isotherm models.
Coefficient of determination values (r2) were used in order
to find the fitting degrees of isotherm adsorption models and
thermodynamics by considering the experimental data,24 as
defined by equation 6:
S(NfCAL – N–fEXP)2
r2 = ––––––––––––––––––––––––––––– (6)
S(NfCAL – N
–
fEXP) 2 + S(N
fCAL – NfEXP) 2
where NfEXP (mmol g-1) is the experimental amount of
divalent cations exchanged by the natural and the modified smectite, N–fEXP is the average of NfEXP and NfCAL is the
amount of cations obtained by isotherm models.24
Analytical procedures
The natural S clay sample was analyzed by Inductively Coupled Plasma-Optical Emission Spectrometry (ICP-OES), using a Perkin-Elmer 3000 DV apparatus.
X-ray powder diffraction (XRD) patterns were recorded
with a Philips PW 1050 diffractometer using CuKα
(0.154 nm) radiation in the 2 to 65 o (2q) interval at a speed
of 2o min-1 and a step of 0.050o.
The nuclear magnetic resonance spectra of natural and organofunctionalized smectite samples were obtained on an AC 300/P Bruker spectrometer at room temperature. The measurements were obtained at frequencies of 59.63 and 75.47 MHz, for silicon and carbon, respectively, with a magic angle spinning of 4 Hz. In order to increase the signal-to-noise radio of the solid-stage spectra, the CP/
NMR technique was used. 29Si and 13C CP/NMR spectra
were obtained with pulse repetitions of 3 s for both nuclei and contact time of 1 and 3 ms, respectively.
Thermogravimetric curves were obtained from approximately 15 mg of sample on a thermogravimetric analyzer model TA-2960 in a dynamic atmosphere using dry nitrogen flux, on heating from room temperature up
to 1073 K at a heating rate 0.17 K s-1. The thermal kinetic
parameters were calculated from the Coats-Redfern equation.
The scanning electron microscopy (SEM) images were recorded on a model LEO-ZEISS, 430 Vp at the LNLS/ Brazil, in conditions of analysis using secondary images obtained to 20 kV, with a working distance of 11 mm.
Results and Discussion
Elemental analysis
The elemental analysis of the natural sample S gave results consistent with smectite, with aluminum and iron being the major elemental quantities contained in the well-organized structure, by presenting the chemical
composition 58.3; 16.8; 6.5; 4.2; 0.2; 2.3 and 1.7% of SiO2,
Al2O3, Fe2O3, MgO, Na2O, CaO and K2O respectively, and
10.0% in mass was lost in the ignition process. Thus, the composition of this natural smectite, calculated from the chemical analysis, gives the formula (equation 7):
(Na0.02K0.16Ca0.17) (Al1.25Mg0.42Fe0.32)(Si3.89Al0.11O10) (OH)2 (7)
X-ray and textural analysis
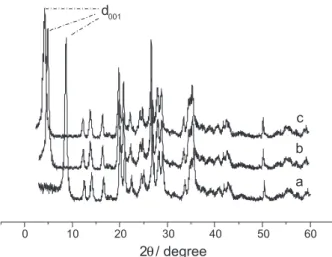
The natural smectite basal distance changed after chemical modification as shown in Figure 1. An increase
in d001 value for natural smectite was clearly observed in
the diffraction patterns, by changing from 0.99 to 1.84 and
2.01 nm for chemically modified SAPS and SMPS samples,
respectively, as listed in Table 1. As expected, the silylating agent is covalently bonded inside the free cavity formed by smectite layers, through the reaction with the available
hydroxyl groups inside the inorganic surfaces.25 Based on
the inorganic tetrahedral-octahedral-tetrahedral smectite
arrangement15 with a layer thickness of 0.89 nm, the
immobilized pendant chains can be accommodated along the original 0.10 nm. From these values, net expansions of 0.95 and 1.12 nm values corresponds to the final arrangements after inserting the silylating agents inside the free cavity space.
The gaseous nitrogen adsorption values for natural and modified smectite samples are also listed in Table 1. The specific surface areas were calculated through the BET method, in order to compare these three matrices. Thus, the BET surface areas demonstrated that organofunctionalization caused mesopore formation as the lamella are expanded in the solid particles, resulting in
higher surface areas, from natural smectite S with 48 m2 g-1
to 781 and 795 m2 g-1 related to S
APS and SMPS,respectively.
The pore size distribution in the micropore region was
obtained by comparing natural and modified samples, applying the BJH method to the nitrogen isotherms at 77 K. The samples contain mostly mesopores, where the
natural smectite S shows a pore volume of 1.7 cm3g-1,
which increased to 2.8 and 3.9 cm3g-1 for S
MPS andSAPS,
respectively. The pore diameters change in the same direction, varying from 0.15 nm for the natural to 0.52 and 0.56 nm for the same sequence of anchored clays.
Table 1. Basal spacing (d001), surface area (SA), micropore area (M), pore volume (P) and pore diameter (PD) for natural and modified smectite samples
Sample d001 / (nm)
SA / (m2g-1)
M / (m2g-1)
P / (cm3g-1)
PD / (nm)
S 0.99 48 9.4 1.7 0.15
SAPS 1.84 781 20.6 2.8 0.52
SMPS 2.01 795 22.7 3.9 0.56
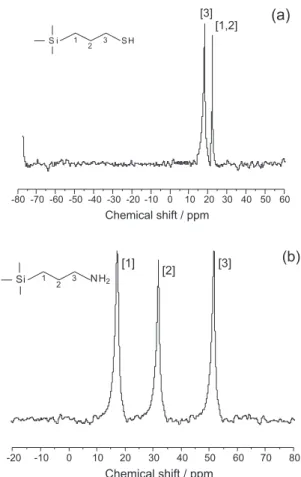
NMR of silicon and carbon nuclei
The spectra of the natural and chemically modified smectite samples for silicon nuclear magnetic resonance are shown in Figure 2. From the structural point of view, the tetrahedral silicon atom is oxygen bridged to the neighboring silicon or other available atoms, whose signals at −92.0 and −99.0 ppm are assigned to
Q2 and Q3, that correspond to (SiO)
2Si[OSi(M)](OH)
and (SiO)3Si[OSi(M)], as shown in Figure 2a. For the
chemically anchored smectite with thiol group, SMPS,
the spectrum gave peaks at −51.0, −65.0, −91.0 and −99.0 ppm. The first two peaks can be attributed to the presence of organosilane groups R incorporated in the
smectite structure as represented by the R-Si*[OSi(M)
3]
form, indicated by T3, and R-Si*[OSi(M)
2](OH) that
corresponds to T2. The other two peaks are related to Q2
and Q3, respectively, as shown in Figure 2b. Identically, for
the smectite containing the amino group, SAPS, the set of
four peaks at 52.0, 66.0, 94.0 and 98.0 ppm were assigned
for Q2, Q3, T2 and T3 peaks, as shown in Figure 2c. These
assignments for Tn species were based on the grafted
silylating agent molecule when bonded directly to the inorganic structure. As previously established, the signals resulting from this same anchored molecule on silica gel appear in the −49.0 to −68.0 ppm range, depending upon
the bonding type.22 For alkyltrichlorosilane grafted on
layered silicates the signals also appeared in the −56.0 to
−65.0 ppm interval.23
13C NMR can be used to confirm the presence of organic
functional groups in the structure of smectite. The spectra shown in Figure 3 illustrate very well the presence of two peaks at 28.4 and 13.1 ppm due to carbon atoms adjacent to the silicon (C1) and central (C2), including one adjacent to the SH group (C3) for the thiol silylating agent. The three-carbon spacer group for smectite chemically modified with 3-aminopropyltriethoxysilane gave distinct signals for carbon bonded to the silicon atom and for the end with the amino functional group, whose peaks related to carbons named as C1, C2 and C3 at 41.0, 26.8 and 10.5 ppm, are shown in Figure 3b.
Thermogravimetry
Thermogravimetric curves for S, SMPS and SAPS are
presented in Figure 4. The original smectite showed only one step of decomposition in the 600 to 1000 K interval with a mass loss of 15%, which is attributed to water due to the condensation of OH groups of the surface. Identical steps of decomposition are also observed in the same interval of temperature, for the chemically modified smectites, to give
9 and 10% of water, respectively, due to the condensation
of the remaining OH group on the surfaces. However, SMPS
and SAPS presented two other steps of mass losses at lower
temperatures: (i) an amount of 1% due to the humidity for
these smectites from room temperature to 370 K and (ii)
the anchored pendant chains are decomposed from 370 to 600 K interval of temperature, to give 17 and 18% of
mass losses.19,22 As observed, the decrease in the amount of
water formation during the heating process for the anchored
smectites, clearly supports the use of OH groups in the original surface for coupling to the silylating agents.
The TG curve data were used to explore the mechanism of the individual stage. The well-characterized decomposition
stages of S, SMPS and SAPS were selected for study of the
kinetic decomposition. The kinetic parameters, activation
energy (Ea) and pre-exponential factor (A), were calculated
using the Coats-Redfern equation.26
(8)
where T is temperature, A is the pre-exponential factor, R is the gas constant (8.314x10⁻³ kJ K-1 mol-1), φ is the heating
rate, and Ea is the activation energy.
The thermal decomposition assignment is based on
the assumption that g(α) form depends on the reaction
mechanism. In the investigation, nine forms of g(α)
enunciate the mechanism of the thermal decomposition in the each stage. Correlation coefficients for all forms were
calculated and the form of g(α) for which the correlation
had a maximum values was selected as the reaction mechanism. For all thermal degradations, the best values of the correlation coefficient for both decompositions
of the matrices were obtained using the function g(α) =
−ln(1−α).26 Thus, the activation energy and pre-exponential
factor entropic values for S, SAPS and SMPS were 158.2, 237.0
and 299.0 kJ mol-1 and 1.20x10⁹, 1.99x10⁹ and 2.70x10⁹,
respectively. Kinetic thermal analysis shows that the Ea
and A values decrease in the order SMPS > SAPS > S. Indeed,
this behavior must be due to the fact that modified smectite samples have lower surface areas than the natural material, resulting in a more difficult decomposition of pendant group attached onto the smectite surface.
Scanning Electron Microscopy (SEM)
SEM images of unmodified (S) and the chemically
modified smectite (SMPS) samples are shown in Figures 5a
and 5b, presenting particles formed by large agglomerates of irregular shapes. The strong tendency toward aggregation and the compact aspect of the material can also be observed. For the organofunctionalized smectite micrograph shown in Figure 5b, the particles are apparently smaller in size and are constituted of disordered, thin sheet particle aggregates. Based on these results, it is reasonable to conclude that the functionalization promotes the formation of disordered and less cohesive aggregates, probably due to reduction of the edge-to-edge and face-to-face interactions. Unlike the hydrophilic natural smectite sample, which formed large
Figure 3.13C MAS NMR for S
MPS (a) and SAPS (b) smectites.
Figure 4. Thermogravimetric curves for natural S (a) and the chemically modified SAPS (b) and SMPS (c) smectites.
sized aggregates after drying, the functionalized samples were hardly dispersed in water (hydrophobic) and easily kept as a powder after drying. This change constitutes an important advantage considering any industrial applications.
Adsorption study
The divalent metal adsorptions on natural and chemically immobilized smectites are shown in Figure 6. The influence of the silylating agent covalently bonded on the inorganic structure is clearly reflected in adsorption isotherms due to different basic center attached to the pendant chains, as outlined by the saturation process. The molecules anchored onto the oxides containing thiol groups on pendant chains favor a metal interaction, mainly of soft cations, due to
the presence of the basic reactive centers.23,24 Based on
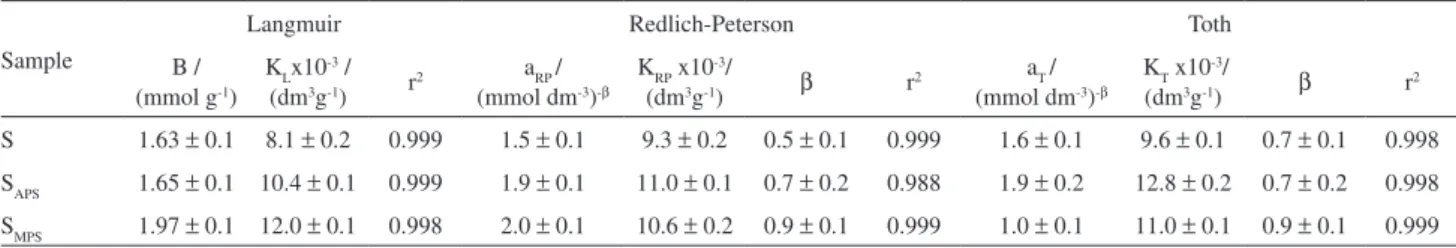
the structural features presented by thiol groups on the natural or modified pillared clay surfaces, the adsorption can be related directly to the available sulfur atoms. The Langmuir, Redlich-Peterson and Toth nonlinear adsorption models were used to explain the significant capacity of these matrices to quantify divalent metal interactions on these polymeric inorganic structures.
The nonlinear Langmuir model presents a significant advantage when used with such experimental data, allowing the determination of the capacity of cations bonded to basic centers and to evaluate the constant related to the binding
energy.26-30 The Redlich-Peterson and Toth models were
similar to the Langmuir model with coefficient r2 over
0.99.31,32 The large capacity of modified smectite samples
was confirmed through constant values obtained with these models in the nonlinear form, whose results gave the best approximation to the experimental data, as illustrated in Figure 6. The values are listed in Table 2. The large capacity of adsorption of the anchored smectite is represented by these constant values, which can be attributed to the immobilization of thiol groups on the pendant chains. Thus, the attached group is the reactive basic center that contributes directly to the adsorption property of the anchored smectites.
The smectite cation adsorption capacity for all these matrices depends on the nature of the complex formed on surface and also on the affinity of the divalent metal for any
particular attached ligand.33,34 The maximum cation adsorption
capacity, Nfmax, for natural and organofunctionalized
smectites is listed in Table 3, with the highest values for the chemically modified surfaces, showing also an increase with temperature. A possible explanation for this enhancement in adsorption with temperature is the activation of the remaining basic centers of original structure on the clay, possibly arising from displacement of water initially hydrogen bonded to the
clay and the modified surfaces.34 These N
f
max values reflect
the good affinity of the sulfur donor atom attached to the inorganic backbone for bonding mercury. A favorable sulfur/ mercury interaction was previously observed for this same
silylating agent when immobilized on phyllosilicate.34
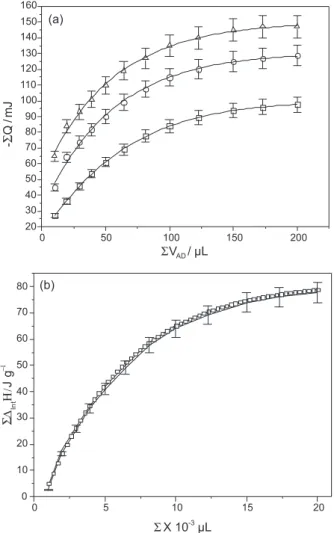
Thermodynamic study
The thermal results for calorimetric titration involving the natural and chemically anchored smectites are shown in Figure 7 and the corresponding thermodynamic data are listed in Table 3. The Gibbs free energy associated with divalent mercury/natural or organofunctionalized smectite adsorptions
can be determined by the Langmuir constant KL.27-34
Table 2. Langmuir, Redlich-Peterson and Toth models applied to divalent metal adsorption on natural and anchored samples, for 3.0 g dm-3 of clay with pH 3.0 at 298 ± 1 K
Sample
Langmuir Redlich-Peterson Toth
B / (mmol g-1)
KLx10 -3 / (dm3g-1) r2
aRP / (mmol dm-3)-b
KRP x10 -3/
(dm3g-1) b r2
aT / (mmol dm-3)-b
KT x10 -3/
(dm3g-1) b r2
S 1.63 ± 0.1 8.1 ± 0.2 0.999 1.5 ± 0.1 9.3 ± 0.2 0.5 ± 0.1 0.999 1.6 ± 0.1 9.6 ± 0.1 0.7 ± 0.1 0.998 SAPS 1.65 ± 0.1 10.4 ± 0.1 0.999 1.9 ± 0.1 11.0 ± 0.1 0.7 ± 0.2 0.988 1.9 ± 0.2 12.8 ± 0.2 0.7 ± 0.2 0.998 SMPS 1.97 ± 0.1 12.0 ± 0.1 0.998 2.0 ± 0.1 10.6 ± 0.2 0.9 ± 0.1 0.999 1.0 ± 0.1 11.0 ± 0.1 0.9 ± 0.1 0.999
Figure 6. Mercury cation adsorption onto natural S () and the chemically modified SAPS () and SMPS () smectite samples, for 1.0 g dm
The enthalpy (∆rh) is related to the thermal effect per
mass for each matrix, ∆inth, which corresponds to the
enthalpy of monolayer formation. ∆inth and KL values can be
determined from coefficients after isotherm linearization.
The molar enthalpy of the interaction process27-34 can be
calculated through equation 9.
∆intH = ∆inth / N
S (9)
where NS is the number of adsorbent moles after reaching
Table 3. Summary of the thermodynamic data for mercury cation adsorption onto natural and modified smectites at 298.15 ± 0.20 K, based on the Langmuir adsorption model (Nfmax = experimental data)
Sample Nf max / (mmol g-1)
−∆hint / (J g-1)
−∆intH o / (kJ mol-1)
−∆intG o / (kJ mol-1)
∆intS o / (J K-1 mol-1) S 1.24 ± 0.11 11.98 ± 0.13 7.36 ± 0.11 22.4 ± 0.1 51 ± 1
SASP 1.57 ± 0.11 12.01 ± 0.13 7.29 ± 0.11 22.7 ± 0.1 54 ± 2 SMSP 1.78 ± 0.11 13.93 ± 0.13 7.08 ± 0.11 23.9 ± 0.1 55 ± 2
thermodynamic equilibrium. From KL values the Gibbs
energy27-34 is calculated by:
∆int G = −RTlnKL (10)
where T is the absolute temperature and the universal
gas constant R =8.314x10⁻³ kJ K-1 mol-1, and the entropy
values27-34 can be calculated by considering:
∆intG = ∆intH−T∆intS (11)
The thermodynamic cycles for this series of natural and immobilized smectites (SM) involving a heterogeneous condition considered the suspension (sp) of these matrices in aqueous (aq) solution, which are calorimetrically titrated
with mercury cation, S∆tith, followed by hydration of each
smectite, S∆hidh, and also the dilution of the cation solution,
S∆dilh, as represented by the following reactions:
SMsp + Hg2+
aq = SM•Hg 2+
sp; S∆tith (12)
SMsp + nH2O = SM•nH
2Osp; S∆hidh (13)
Hg2+
aq + nH2O = Hg
2+•nH
2Oaq; S∆dilh (14)
SM•nH
2Osp + Hg 2+•nH
2Oaq = SM•Hg 2+
sp + 2nH2O; S∆rh (15)
The net thermal effect, S∆rh, can be obtained from
the expression: S∆rh = S∆tith − S∆tith, due to the fact that
the matrix hydration values are null. The corresponding isotherms shown in Figure 7 demonstrate that natural smectite differs from those anchored with nitrogen and sulfur basic atoms attached to the pendant chains.
A summary of the thermodynamic data involving mercury adsorption is listed in Table 3. All Gibbs free energy values are negative in agreement with the spontaneous reaction between the basic centers attached to the pendant chains, on natural and on each chemically modified smectite, with the cation at the solid/liquid interface. From the point of view of enthalpy, all exothermic values indicate that the reactions are also favorable. Again the other favorable contribution for these thermodynamic values comes from the positive entropy. This value can be interpreted by considering the progress of such interaction, in which the cation as well as the basic centers must be free from solvent to interact. However, the mercury cation is originally solvated and identically the available basic centers attached to the pendant chains. As the reaction takes place, the bonded solvent molecules will be free and disturb the original structure of the reaction medium to
Figure 7. The resulting thermal effects of the adsorption isotherms for the mercury cation: S (), SAPS () and SMPS (), for 1.0 g dm
promote disorganization of the system and, consequently,
lead to an increase in entropy,25-29 to yield favorable
thermodynamic data for this system.
Conclusions
A highly stable natural smectite, originally from the northeast region of Brazil, had the surface changed with silylating agents covalently bonded on the inorganic framework, changing the physical-chemical properties.
Thus, the specific area of 48 m2g-1 increased after the
immobilization process to 795 m2g-1. Identically, chemically
modifiedclay samples containing sulfur atoms attached to
the pendant chains increased the capacity for mercury removal, a favorable condition attributed to the available edge sites on the inorganic backbone, to give the order
of affinities of 1.24, 1.57 and 1.78 mmol g-1, for original
smectite and those anchored with nitrogen and sulfur basic atoms, respectively.
Adsorption on natural or modified smectite clay samples increased continuously with the concentration of mercury. The most appropriate condition was pH 2.0 at 298 ± 1 K,
to present a plateau at 360 min. The uptake of cations
was very fast initially for both inorganic supports before reaching the plateau. The Langmuir isotherm yielded good fits with the adsorption data for divalent metal/clay interactions (r2 > 0.99).
The quantitative of metal/reactive center interactions for chemically modified smectite clays were followed through calorimetric titration at the solid/liquid interface to give favorable sets of data, such as exothermic enthalpy, negative Gibbs free energy, and positive entropic values. These thermodynamic data suggest the application of this series of materials, available in Brazil, to improve the environment as cation extraction agents.
Acknowledgments
The authors are indebted to CNPq for fellowships and FAPESP for financial support.
References
1. Guerra, D. L.; Lemos, V. P.; Airoldi, C.; Angélica, R. S.;
Polyhedron2006, 25, 2880.
2. Fuentes, I. E.; Viseras, C. A.; Ubiali, D.; Terreni, M.; Alcantara A. R.; Appl. Clay Sci. 2005, 29, 111.
3. Guerra, D. L.; Lemos, V. P.; Airoldi, C.; Angélica, R. S.;
J. Hazard. Mater.2008, 55, 230.
4. Guerra, D. L.; Lemos, V. P.; Airoldi, C.; Angélica, R. S.; Airoldi, C.; Viana, R. R; Quim. Nova2008, 31, 356.
5. Prado, A. G. S.; Airoldi, C.; Anal. Chim. Acta 2001, 432, 201.
6. Koyuncu, H.; Kul, A. R.; Yildiz, N.; Çalimli, A.; Ceylan, H.;
J. Hazard Mater.2007, 40, 489.
7. Salinas-Castillo, A.; Pastor, I.; Mallavia, R.; Reyes Mateo, C.;
Biosens. Bioelectron.2008, 24, 1059.
8. Caillou, S.; Gerin, P. A.; Nonckreman, C. J.; Fleith, S.; Dupont-Gillain, C. C.; Landoulsi, J.; Pancera, S. M.; Genet, M. J.; Rouxhet, P. G.; Electrochim. Acta2008, 54, 116.
9. Sales, J. A. A.; Airoldi, C.; J. Non-Cryst. Solids2003, 330, 142.
10. Türünç, O.; Kahraman, M. V.; Akdemir, Z. S.; Kayaman-Apohan, N.; Güngör, A.; Food Chem.2009, 112, 992. 11. Guerra, D. L.; Airoldi, C.; Viana, R. R.; Inorg. Chem.
Commun. 2008, 11, 20.
12. Temkin, N.; Kadinci, E.; Demirbas, Ö.; Alkan, M.; Kara, A.; J. Colloid Interface Sci.2006, 89, 472.
13. Zhao, D. L.; Feng, S. J.; Chen, C. L.; Chen, S. H.; Xu, D.; Wang, X. K.; Appl. Clay Sci.2008, 41, 17.
14. Degueldre, C.; Kline, A.; Earth Planet. Sci. Lett. 2007,
264, 104.
15. Manohar, D. M.; Noeline, B. F.; Anirudhan, T. S.; Appl. Clay Sci.2006, 31, 194.
16. Moore, D. M.; Reynolds, R. C.; X-ray Diffraction and the Identification and Analysis of Clay Minerals, Oxford University Press: Oxford, 1989, pp. 179-201.
17. Nunes, L. M.; Airoldi, C.; J. Solid State Chem.2000, 154, 557.
18. Nunes, L. M.; Airoldi, C.; Mater. Res. Bull. 1999, 34, 2121.
19. Machado, R. S. A.; Fonseca, M. G.; Arakaki, L. N. H.; Oliveira, S. F.; Talanta2004, 63, 317.
20. Airoldi, C.; Roca, S.; J. Mater. Chem.1996, 6, 1963. 21. Ruiz, V. S. O.; Petrucelli, G. C.; Airoldi, C.; J. Mater.
Chem.2006, 16, 2338.
22. Ruiz, V. S. O.; Airoldi, C.; Thermochim. Acta2004, 420, 73. 23. Vaghetti, J. C. P.; Lima, E. C.; Royer, B.; Brasil, J. L.;
Cunha, B. M.; Simon, N. M.; Cardoso, N. F.; Noreña, C. P. Z.; Biochem. Eng. J. 2008, 42, 67.
24. Karadag, D.; Koc, Y.; Turan, M.; Ozturk, M.; J. Hazard. Mater.2007, 144, 432.
25. Macedo, T. R.; Petrucelli, G. C.; Airoldi, C.; Clays Clay Miner.2007, 55, 151.
26. Nadhu, N.; Radhakrishnan, P. K.; Grunent, M.; Weinbergr, P.; Linet, W.; Thermochim. Acta2003, 400, 29.
27. Prado, A. G. S.; Airoldi, C.; Anal. Chim. Acta2001, 432, 201.
28. Monteiro, O. A. C.; Airoldi, C.; J. Colloid Interface Sci. 2005, 282, 32.
30. Lazarin, A. M.; Airoldi, C.; J. Mater. Chem. 2006, 18, 2226.
31. Padilha, P. D.; Rocha, J. C.; Moreira, J. C.; Campos, J. T. D.; Federici, C. D.; Talanta1997, 45, 317.
32. Al-Ashem, S.; Duvnjak, Z.; Water, Air, Soil Pollut. 1999, 114, 251.
33. Lima, C. B. A.; Airoldi, C.; Solid State Sci.2002, 4, 1321. 34. Fonseca, M. G.; Simoni, J. A.; Airoldi, C.; Thermochim. Acta
2001, 369, 17.
Received: November 12, 2008
Web Release Date: March 13, 2009