A
r
ti
c
le
0103 - 5053 $6.00+0.00
*e-mail: [email protected]
Optimization of an Amperometric Biosensor for the Detection of
Hepatitis C Virus using Fractional Factorial Designs
Carolina V. Uliana, Carla S. Riccardi, João O. Tognolli and Hideko Yamanaka*
Universidade Estadual Paulista, Instituto de Química, Campus de Araraquara, CP 355, 14800-900 Araraquara-SP, Brazil
O planejamento fatorial fracionário e com ponto central foram aplicados no desenvolvimento de um biossensor amperométrico para determinação do vírus da hepatite C. As biomoléculas foram imobilizadas por adsorção em eletrodos de grafite modificados com filme sol-gel preparado com matriz híbrida siloxano-poli(propileno-óxido). Diversos parâmetros foram otimizados, tais como a concentração da estreptavidina em 0,01mg mL-1 e albumina de soro bovino em 1,0%, o tempo de incubação dos eletrodos de 30 minutos na solução do DNA complementar e a diluição do conjugado avidina-peroxidase em 1:1500, entre outros. A aplicação de estudos quimiométricos mostrou-se eficiente, pois as melhores condições foram estabelecidas com um menor número de experimentos, além de apontar quais os fatores exercem maiores influências sobre o sistema.
Fractional factorial design and factorial with center point design were applied to the development of an amperometric biosensor for the detection of the hepatitis C virus. Biomolecules were immobilized by adsorption on graphite electrodes modified with siloxane-poly(propyleneoxide) hybrid matrix prepared using the sol-gel method. Several parameters were optimized, such as the streptavidin concentration at 0.01 mg mL-1and 1.0% bovine serum albumin, the incubation time of the electrodes in the complementary DNA solution for 30 minutes and a 1:1500 dilution of the avidin-peroxidase conjugate, among others. The application of chemometric studies has been efficient, since the best conditions have been established with a restricted number of experiments, indicating the influence of different factors on the system.
Keywords: biosensor, hepatitis C virus, fractional factorial design
Introduction
Hepatitis C is caused by a virus from the genus
Hepacivirus,which is part of the Flaviciridaefamily and whose genome is composed of a single-stranded RNA. According to the World Health Organization, approximately 170 million individuals worldwide, 3.2 million in Brazil alone, are infected with the hepatitis C virus (HCV). The disease rarely provokes symptoms, acts quietly and there is no vaccine available and so hepatitis C is one of the most serious problems to public health.1
The diagnosis of hepatitis C is rarely made during the acute phase of the disease because the majority of people infected experience no symptoms during this phase of the disease. Those who do experience acute phase symptoms are rarely ill enough to seek medical attention. The diagnosis of chronic phase hepatitis C is also challenging due to the absence or lack of specificity
of symptoms until advanced liver disease develops, which may not occur until decades into the disease.2 Diagnostic
tests for hepatitis C can be divided into two general categories: (i) serologic assays and (ii) molecular nucleic acid testing methods. Hepatitis C testing begins with serological blood tests used to detect antibodies to HCV. Enzyme immunoassays (EIA) are the most prominent form of testing and these are considered to be highly sensitive indicators. While performing supplementary or confirmatory tests, recombinant immunoblot assay (RIBA) and line immunoassay (LIA) are also widely used.3
in determining the probability of response to interferon-based therapy, but does not indicate disease severity or the likelihood of disease progression.2
Recent engineering advances have enabled the development of electrochemical DNA biosensors with
molecular diagnostic capabilities.4 Electrochemical
DNA biosensors offer several advantages compared to alternative molecular detection approaches, including the ability to analyze complex body fluids, high sensitivity, compatibility with microfabrication technology, a low power requirement, and compact instrumentation compatible with portable devices.5-7 The development of
electrochemical transduction schemes for DNA bionsensor (so-called genosensors) has recently received increasing attention using photoelectrochemistry, potentiometry, and DNA-modified electrodes. In DNA biosensors, probes of single-stranded DNA of known sequence are immobilized at the transducer surface. When contacted with the sample solution, the DNA probes preferentially hybridize with free DNA targets incorporating the complementary sequence. DNA biosensors have been applied to disease detection
and some examples are: Human Papilloma Virus (HPV),8
hepatitis B9,10 and hepatitis C.7,11 The biosensors consist of
a biological component (enzyme, antibody, antigen, cell, tissue, nucleic acid, etc.) coupled to a suitable transducer, which converts a biological signal into an electrical signal.12
Biosensors are devices able to identify a notable amount of biochemical constituents in complex samples without previous treatment of the matrices;13 although there may
be the necessity to amplify the amount of analyte, as is the case when DNA or RNA is evaluated.
The development of biosensor requires that several parameters be optimized, such as the type of immobilization, concentration of immobilized biomolecules, among others, thus increasing the number of experiments. In this sense, the application of statistical tools is very important, mainly to explore and analyze an increasing range of data and information from a system. Factors that have a significant effect on the system response are studied and optimized for the development of new analytical methods and the improvement or adaptation of methods previously established. The enhancement of sensitivity and selectivity along with the diminishing of parallel reactions bring optimizations such that the method is able to yield better results. Nowadays, techniques involving multivariate optimization are being applied in analytical chemistry14-17 because this methodology presents various
advantages like the simultaneous optimization of all factors involved in the system by carrying out a smaller number of experiments; thus it is much less time consuming and especially important, much more efficient.
Among these techniques, the factorial design is classified as a simultaneous method, in which the variables of interest, which have a significative influence on the response of the system, are evaluated at the same time. Factorial design can be represented by bk, where k is the number of factors (or variables) and b is the chosen number of levels;18 and two-level designs are very common.19-22
However, a large number of assays are necessary with an increasingk and it is uneconomical to conduct experiments that require 2k possible treatment combinations. For this
reason, a regular fractional factorial design is commonly used because the desired information can be obtained by performing a restricted number of experiments corresponding to a fraction of the assays used in a full factorial design, represented by 2(k-p), where pis the size of fraction.23 The most significant applications of the fractional
factorial design have been used to discover the behavior of variables in complex systems and to evaluate the behavior of interferences in analytical methods.24,25
In many cases, the carrying out of authentic repetitions (replicates of all procedure steps, including the most elementary ones) can be inconvenient for many reasons. To minimize this problem and to obtain a good evaluation of errors, an experiment is usually included at the center point of the design, such that the mean level of all variables is employed. These experiments are known as center point (zero level) experiments. Therefore, it is possible to evaluate the effects or significance of coefficients, as is done in selection designs (full or fractional) by means of a response surface methodology.
In this context, the goal of this work is to apply statistical tools such as the fractional factorial design and factorial with center point design to the development of an amperometric biosensor for the detection of the hepatitis C virus.
Experimental
Reagents
3-(Isocyanatopropyl)triethoxysilane (IsoTrEOS),
O,O’-bis(2-aminopropyl)poly (propyleneoxide) (PPO)
with molecular weight of 4000 g mol−1, and tetrahydrofuran
(THF) were obtained from Aldrich Chemical Co., USA. Streptavidin (STA) and bovine serum albumin (BSA) were purchased from Sigma (St. Louis, USA). 5´-Biotinylated 18-mer oligonucleotides probe (HCV 1: biotin-CGC TCA ATG CCT GGA GAT) was supplied by Life Technology (Gaithersburg, MD, USA). The concentration of the stock
solutions of biotinylated DNA probes is 200 µg mL−1,
avidin-peroxidase conjugated was from the kit Amplicor® Roche v.2 (Tris-HCl buffered solution containing < 0.001% conjugate). The biotinylated complementary DNA (c-DNA) samples were donated by hepatitis Health Service at the Faculty of Pharmaceutical Sciences, Unesp. HCV RNA was extracted from patient sera. A 244 bp HCV DNA fragment of known sequence was obtained by reverse transcribed polymerase chain reaction (RT-PCR) in the presence of a sense biotinylated primer from commercial assay Amplicor® hepatitis C Virus Version 2.0 (Roche). The qualitative test from Roche Diagnostics is a PCR-based method called the HCV AMPLICOR 2.0 assay, which reliably detects HCV RNA concentrations down to 50 IU/mL. All sample used for the optimization was previously analyzed by microwell format spectrophotometric method and on this proposed methodology was also positive. Other reagents were commercially available or ones of laboratory grade. Solutions were prepared using high-purity water (R = 18.2 M7 cm−1). H
2O2 and 5-aminosalicylic acid
(5-ASA) solutions were prepared immediately before use in 0.1 mol L−1 phosphate buffer solution at pH 5.0
(0.07 mol L-1 and 1.0 ×10⁻³ mol L−1, respectively).
Apparatus
Amperometric measurements were performed using a Potentiostat–Galvanostat EG&G model 263. A one-compartment cell having a working volume of 5.0 mL, a thin-film PPO-modified working electrode, Ag/AgCl reference electrode and a platinum wire auxiliary electrode were used for the experiments.
Immobilization of DNA probes
PPO films were deposited on the graphite electrode surface using a dip-coating process, involving 1 dip at
a lifting speed of 100 mm min-1. All electrodes were
allowed to dry at 4 °C in a refrigerator for 24 h. After this, the electrodes were washed thoroughly before use in 0.1 mol L−1 phosphate buffer solution at pH 7.0 and
dry stored at 4 °C.7 Sequentially, the confection of the
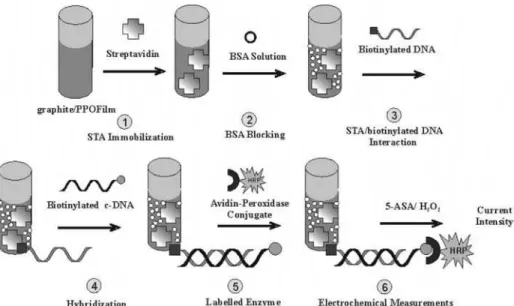
amperometric biosensor was developed, as illustrated in Figure 1. The methodology consisted of six main steps:
c
the streptavidin (STA) was immobilized on the PPOfilm,
d
the modified electrode surfaces were blocked usingbovine serum albumine (BSA),
e
the STA interactedwith the biotinylated DNA (b-DNA) probes specific for the hepatitis C virus,
f
the hybridization reaction occurs when the electrode is placed in contact with biotinylatedcomplementary DNA (c-DNA),
g
avidin-peroxidaselabeling (a-HRP) was performed to indirectly detect
the HCV and
h
electrochemical measurements wereperformed using H2O2 and 5-ASA as substrate and
electron mediator, respectively. Incubation time for each compound may play an important role. After each of the
steps
c
-g
, the electrodes were washed to remove anyunbound compound.
Results and Discussion
Fractional factorial design was applied in two stages. In a first step, the influence of the concentrations of the streptavidin and bovine serum albumin solutions, as well as the incubation times of the modified electrodes were
studied and the pH value of the diluted streptavidin solution was evaluated using a 25-3fractional factorial type design.
In the second step, the dilution and the corresponding incubation time of the HCV-specific DNA probes (b-DNA), complementary DNA (c-DNA) probes and avidin-peroxidase conjugate (a-HRP) were evaluated using a 26-3
fractional factorial type design. The levels applied for each factor are presented in Table 1.
MINITAB software generated level combinations for all factors employed in the assays. Then, the sensor current was measured employing the controlled potential amperometric technique for each of these level combinations, which were obtained via chemometric strategies. The Pareto chart is the main analysis tool, indicating the factors responsible for the highest influence on the system.
Figure 2 shows the Pareto chart for two fractional factorial designs discussed in this work. In the first set of experiments, displayed in Figure 2A, it was observed that the concentration of the immobilized STA on the electrode surface was the most important factor. Beside this, the BSA concentration had a significant influence on the system. The isoelectric point for STA is a value
around 5-6.26 So, according to Figure 2A, STA charge
does not play an important role in its interaction with either the polymer film or the DNA. Incubation time of both STA and BSA has only minor influence on the system results.
The second fractional factorial design (Figure 2B) indicated the most important parameters. They were found to be the incubation time of the electrodes in the positive sample for the hepatitis C virus and the dilutions of the avidin-peroxidase conjugate. It can be seen that the system suffers lesser influence from the others parameters.
As the samples are biotinylated, if the amount of probe and STA on electrode surface is not optimized,
they could interact directly with STA and the response would be false negative. Fractional factorial design is very important to optimize these parameters. The adsorbed STA on the electrode surface presented higher current intensities when its concentration was fixed at a low level, i.e. 0.010 mg mL-1. This is an expected
result due to the higher STA concentrations yielding a strong electrostatic interaction between its molecules, which affects the organization of adsorbed layer on the electrode surface. On the other hand, BSA blocking at high concentration (1.0%) gave a good current value, allowing a more effective blocking of the electrode surface. It was also possible to conclude that the difference between the current values obtained for high and low STA and BSA concentrations did not show any significant influence. However, the current values obtained for the c-DNA incubation time and a-HRP dilution showed notable differences. Therefore, a more specific study for the second fractional factorial design was necessary and then a fractional factorial with center point assay was performed. Values of the high and the low levels and the center point investigated are shown in Table 2.
From the current values obtained in the experiments, a response surface graph and a contour plot were generated (Figure 3). Maximum response was observed close to the center point and each area of the contour plot corresponds to a particular height of the response surface graph. In each line, the response is constant.
Incubation time of the electrodes in the c-DNA solution is important, since this involves the recognition of nitrogen bases during the DNA hybridization. According to literature, it is from 2 min to 1 h depending on the assay format.13 a-HRP dilution is also a special factor since
this conjugate binds to the biotin-labeled DNA, which is hybridized to the target-specific DNA probe bound onto the electrode surface.
Table 1. Factors and levels used in the factorial design for biosensor optimization
Design type Factor High level Low level
25-2 STA concentration (mg mL-1) 0.10 0.01
STA incubation time (min) 60 30
pH 7.0 5.7
BSA concentration (%) 1.0 0.5
BSA incubation time (min) 30 15
26-3 b-DNA dilution 1:40 1:80
b-DNA incubation time (min) 30 15
c-DNA dilution 1:4 1:8
c-DNA incubation time (min) 60 30
Therefore, the fractional factorial design allowed us to fix several parameters to improve the performance
of the DNA biosensor. These parameters were: (i) STA
immobilization at 0.01 mg mL-1 in electrolyte at pH 7.0
for 30 min on the sol-gel modified-electrode surfaces;
(ii) blocking of the electrode surface with 1.0% BSA
using an incubation time of 30 min; (iii) adsorption of the biotinylated DNA probes at a dilution ratio of 1:80 (incubation time of 15 min); (iv) DNA hybridization using hepatitis C DNA samples (dilution 1:4, incubation time of 30 min); (v) the immobilization of the avidin-peroxidase conjugate (1:1500 diluted, incubation time of 15 min).
Conclusions
The use of the factorial design approach in the development of an amperometric biosensor for hepatitis C virus has several advantages, such as a reduced number of experimental runs, more information obtained and biosensor delineation, in which the biosensor response permitted the optimal experimental conditions to be determined. It was possible to determine the best concentration and incubation time for all biomolecules studied with this biosensor using the developed methodology.
Acknowledgments
The authors gratefully acknowledge financial support from FAPESP (Proc. 04/09535-5).
References
1. http://www.who.int/mediacentre/factsheets/fs164/en/, accessed in March 2008.
Figure 2. Pareto charts of effects obtained for the 25-2 (A) and 26-3 (B)
fractional factorial designs (time = incubation time; dilut = dilution; [ ] = concentration).
Figure 3. Response surface graph (A) and contour plot (B) for the optimization of a-HRP dilution and c-DNA incubation time. The numbers1, 0 and 1 correspond to low, center point and high levels of the parameters of Table 2, respectively.
Table 2. Design matrix for fractional factorial with center point
Factor High level Center point Low level
c-DNA incubation time (min)
40 30 20
2. http://www.hepcaustralia.com.au/hep-c-information-station/ medical-encyclopedia-hepatitis-c.html, accessed in March 2008.
3.Erensoy, S.; J. Clin. Virol.2001,21, 271.
4. Liao, J. C.; Mastali, M.; Gau, V.; Suchard, M. A.; Møller, A. K.; Bruckner, D. A.; Babbitt, J. T.; Li, Y.; Gornbein, J.; Landaw, E. M.; McCabe, E. R. B.; Churchill, B. M.; Haake, D. A.; J. Clin. Microbiol.2006,44, 561.
5. Riccardi, C. S.; Kranz, C.; Kowalik, J.; Yamanaka, H.; Mizaikoff, B.; Josowicz, M.;Anal. Chem.2008,80, 237. 6. Riccardi, C. S.; Yamanaka, H.; Josowicz, M..; Kowalik,J.;
Mizaikoff, B.; Kranz, C.; Anal. Chem.2006,78, 1139. 7. Riccardi, C. S.; Dahmouche, K.; Santilli, C. V.; Costa, P. I.;
Yamanaka, H.; Talanta2006,70, 637.
8. Dell’Atti, D.; Zavaglia, M.; Tombelli, S.; Bertacca, G.; Cavazzana, A. O.; Bevilacqua, G.; Minunni, M.; Mascini, M.;
Clin. Chim. Acta2007,383, 140.
9. Ye, Y. K.; Zhao, J. H.; Yan, F.; Zhu, Y. L.; Ju, H. X.; Biosens. Bioelectron. 2003,18, 1501.
10. Li, X-M.; Ju, H-Q.; Du, L-P.; Zhang, S-S.; J. Inorg. Biochem. 2007,101, 1165.
11. Skládal, P.; Riccardi, C. S.; Yamanaka, H.; Costa, P. I.; J. Virol. Methods2004,117, 145.
12. Stradiotto, N. R.; Yamanaka, H.; Zanoni, M. V. B.; J. Braz. Chem. Soc.2003,14, 159.
13. Lucarelli, F.; Marazza, G.; Turner, A. P. F.; Mascini, M.;Biosens. Bioelectron.2004,19, 515.
14. Zlatev R.; Magninb, J-P.; Ozil, P.; Stoytcheva, M.;Biosens.
Bioelectron. 2006,21, 1493.
15. Holmin, S.; Krantz-Rülcker, C.; Winquist, F.; Anal. Chim. Acta 2004, 519, 39.
16. Paolicchi, I.; Renedo, O. D.; Lomillo, M. A. A.; Martinez, M. J. A.; Anal. Chim. Acta2004,511, 223.
17. Santos, W. L.; Santos, C. M. M.; Costa, J. L. O.; Andrade, H. M. C.; Ferreira, S. L. C.; Microchem. J.2004,77, 123. 18. http://www.chemkeys.com/bra/md/peeo_6/mdoeq_1/mdpf_3/
mdpf_3.htm, accessed in March 2008.
19. Pereira, A. C.; Kubota, L. T.; Quim. Nova2004,27, 725. 20. Ruotolo, L. A. M.; Gubulin, J. C.; Chem. Eng. J. 2005,110,
113.
21. Ghassempoura, A.; Davarani, S. S. H.; Noroozic, M.; Shamsipurd, M.;Talanta 2005,65, 1038.
22. Dias, S. L. P.; Fujiwara, S. T.; Gushikem, Y.; Bruns, R. E.; J. Electroanal. Chem.2002,531, 141.
23. Liao, C-T.; J. Stat. Plann. Interf. 2006,136, 4071.
24. Nechar, M.; Molina, M. F.; Bosque-Sendra, J. M.;Anal. Chim. Acta1999,382, 117.
25. Fragueiro, S.; Lavilla, I.; Bendicho, C.; Talanta 2006,68, 1096.
26. Wang, S. Z.; Poglitsch, C. L.; Yatcilla, M.T.; Robertson, C. R.; Gast, A. P.; Langmuir 1997,13, 5794.
Received: September 26, 2007
Web Release Date: May 5, 2008