*e-mail: [email protected]
Investigation on the Wear Behaviour of Eutectic Al-Si Alloy– Al
2O
3- Graphite
Composites Fabricated Through Squeeze Casting
Palanisamy Shanmughasundaram*
Department of Mechanical Engineering, Karpagam College of Engineering, Coimbatore-641032
Received: December 7, 2013; Revised: May 11, 2014
Dry sliding wear test was conducted on Al –Si alloy – Al2O3 - Graphite composites which are fabricated through squeeze casting method, using pin –on –disc wear testing rig. The influence of parameters such as applied load, sliding velocity and weight percentage of graphite, on the wear loss of Al- 5 wt. % Al2O3 – Graphite hybrid composite was investigated through Taguchi and Analysis of variance (ANOVA).It was found that the applied load was the most influential parameter on wear followed by sliding velocity and weight percentage of graphite. The morphology of worn surfaces of the wear pins was investigated by Scanning Electron Microscope (SEM) to analyze the wear mechanism. EDS analysis was carried out to investigate the Mechanically Mixed Layer (MML), which forms on the worn surface of the composites.
Keywords: dry sliding wear test, composites, wear testing rig, Taguchi, SEM
1. Introduction
Metal Matrix Composites exhibit enhanced properties compared to conventional alloys in various applications as they have high specific strength, stiffness and better wear resistance1. Aluminium matrix composites with multiple
reinforcements are finding applications in aerospace and automotive industries due to enhanced mechanical and tribological properties compared to single reinforced composites. Several research works have been carried out to explore the wear behaviour of composites. Wear is a material removal from one surface of the component to another during relative motion between them. Cerit et al.2 have
emphasized that wear behaviour exhibited by composites are greatly influenced by the type, size, volume percentage of reinforcement and distribution of reinforcing particles in the metal matrix. Al-Si alloy is the most versatile of all common foundry cast alloys in the manufacture of automotive engine pistons since they exhibit high strength to weight ratio, high wear resistance, low density and low coefficient of thermal expansion. Krishnan et al.3
reported that addition of 3% graphite particles reduces the wear of Al-Si alloy and about 9% reduction was seen in frictional horse power losses of the diesel engine due to lubrication behaviour of graphite particles. Akhlaghi and Zare-Bidaki4 emphasized that addition of graphite up to
5 wt. % improved the wear resistance of aluminum alloy under both the dry and oil impregnated sliding conditions. Leng Jinfeng et al.5 investigated the wear resistance of
Al- SiC- Gr composites which are fabricated by squeeze casting technology, with various sizes graphite addition. It was reported that the wear resistance of composites increases with the increase of the graphite particle size. Gibson et al.6
studied the influence of graphite particles on the wear rate of cast Al-Si alloys produced by compo casting followed
by squeeze casting. Pai et al.7 reported that the high wear
resistance of Al alloy – graphite composites is attributed to the presence of graphite particles in the matrix which act as a solid lubricant. Many researchers have focused on the possibilities of different reinforcements in enhancing the tribological behaviour of MMCs. Suresha and Sridhara8
investigated the influence of reinforcement content, sliding load, sliding speed and sliding distance on wear behaviour of Al–Gr, Al–SiC composites and Al–SiC– Gr hybrid composites. Results revealed that hybrid composites exhibit better wear characteristics. Ted Guo and Tsao9 studied the
wear behaviour of self lubricating Al hybrid composites reinforced with SiC and graphite particles. They reported that the incorporation of graphite particles decreased friction coefficient and wear rate considerably.Vencl et al.10
studied the tribological behaviour of heat treated Al 356 composites reinforced with Al2O3/SiC and graphite particles fabricated by compo casting process. They reported that the incorporation of graphite particles enhanced the wear resistance. Altinkok et al.11 analyzed the dry sliding wear
behaviour of Al2O3/SiC particle reinforced aluminium based metal matrix composites fabricated by stir casting method. Mohan et al.12 investigated the dry sliding wear of Al - Gr
that the wear behaviour of the Al- Gr composites depends on the smeared graphite film formed on both the composite pin and counter face during sliding and reduce the wear. However, appropriate quantity of the graphite content must be determined to enhance the tribological properties of composites. Therefore in the present study, Taguchi L9 orthogonal array and ANOVA techniques were used to investigate the influence of applied load, sliding velocity and graphite content on the wear behaviour of Al- 5wt. % Al2O3 – Graphite composites which are fabricated through squeeze casting method. Scanning Electron Microscope (SEM) was employed to study the morphology of worn surfaces and identify the wear mechanism. Energy Dispersive Spectroscopy (EDS) was used to characterize the mechanically mixed layers that are formed on the worn surfaces during sliding.
2. Experimentation
2.1.
Specimen preparation
Eutectic Al-Si alloy was used as the matrix material, Al2O3 particles (120 microns) were used as reinforcement and graphite particles (50 microns) were used as the solid lubricant. In this study, composites were fabricated by keeping 5 wt. % Al2O3 constant and varying graphite content (2.5, 7.5 and 12.5 wt. %) .Composition of Al-Si alloy is presented in Table 1.
Squeeze casting method was employed to fabricate the Al- Al2O3 – Gr composites13. A blue star Universal Testing
Machine (UTE-40) was slightly customized to apply pressure on the molten composite in the mould cavity. Al-Al2O3 – Gr composite melt was prepared using stir casting method and poured into the preheated (350°C) mould cavity. 50 MPa squeeze pressure was applied on the melt for 50 seconds through the preheated punch till solidification was completed. Punch was withdrawn and specimen was removed from the mould assembly.
2.2.
Micro structural analysis
Microstructures were examined on the Al–5 wt. % Al2O3- Gr composite samples to reveal the particles distribution in the Al matrix.
2.3.
Hardness
Hardness test was performed on Al alloy and composite specimens using Brinell hardness testing rig with 10 mm steel diameter at a load of 4.9 kN (500 Kgf). The loading duration was 30 seconds. Three readings were taken on each specimen to eliminate possibility of segregation, and mean value was considered.
2.4.
Dry sliding wear test
Dry sliding wear tests were conducted using pin-on-disc wear testing rig. The linear dislodgement of the pin during sliding is considered as wear loss since mass loss is often too small to measure accurately. Wear loss was recorded by the LVDT (Linear Variable Differential Transformer) provided in the wear testing rig with an accuracy 1.0 mm. A cylindrical pin of size 10 mm diameter and 15mm
length, specimens were prepared and loaded in a computer interfaced pin- on - disc wear testing rig. Prior to testing, the surface of the specimens was polished by using 1000 grit paper. The rotating disc was made up of EN 32 steel having hardness of 65 HRC. Wear tests were carried out at 25°C room temperature and 65% relative humidity for 18 minutes.
2.5.
Taguchi method
Taguchi’s parameter design provides a systematic and efficient methodology to find the optimum parameters which have an effect on the process and performance. Taguchi method utilizes orthogonal arrays to study a large number of variables with a minimum number of configurations. In this study, “smaller is better” S/N ratio is used to predict the optimum parameters because a smaller wear loss was desirable. Mathematical equation of the S/N ratio for “smaller is better” is represented in the Equation 1.
1
1
=-10Log
2
i
S
N
n y
i
∑ (1)
Where, yi is the observed data and n is the number of observations.
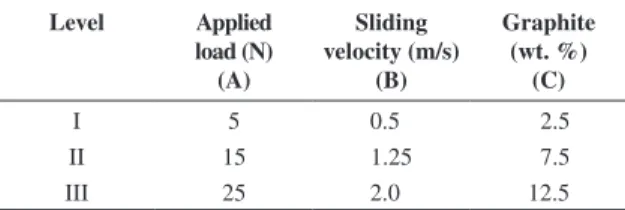
In the present investigation, wear tests were conducted in the composite material as per the L9 orthogonal array. Accordingly,9 wear tests were carried out and each test was repeated thrice in order to reduce the experimental errors. The parameters and the corresponding levels are presented in Table 2. In addition, the experimental results were analyzed using analysis of variance (ANOVA) to study the influence of the parameters on wear loss.
3. Results and Discussion
3.1.
Micro structural and hardness of composites
Figure 1 is a high magnification micrograph of Al – 5 wt. % Al2O3-7.5 wt. % Gr composite.White particles are the Al2O3 particles and dark phase infers the graphite particles. Al2O3 and graphite particles are being distributed more uniformly in the Al alloy matrix and the clustering of particles was not seen in the composite.
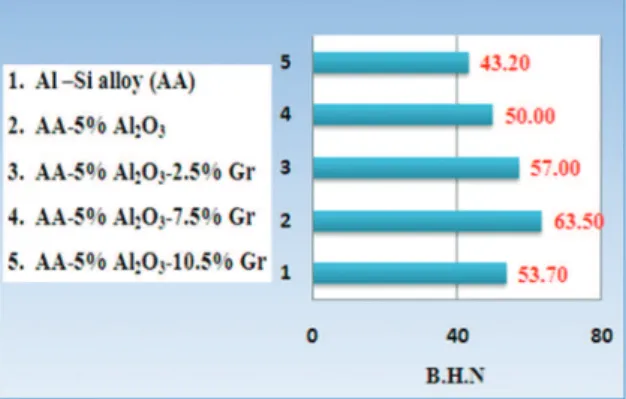
Figure 2 shows that the hardness of Al- 5wt. % Al2O3 composites was higher than that of Al-Si alloy. It can be
Table 2. Parameters and levels.
Level Applied load (N) (A) Sliding velocity (m/s) (B) Graphite (wt. %) (C)
I 5 0.5 2.5
II 15 1.25 7.5
III 25 2.0 12.5
Table 1. Composition of Al- Si alloy.
Element Fe Si Al
3.2.
Results of S/N ratio
Measured values and S/N ratios for wear loss of composites are presented in Table 3.The S/N ratio for each parameter level is determined by averaging the S/N ratios at the corresponding level. Process parameters with the highest S/N ratio would give the optimum quality with minimum variance. The influence of parameters such as applied load, sliding velocity and weight percentage of graphite content, on wear loss has been analyzed and ranking of parameters based on the S/N ratios obtained for different parameter levels is presented in Table 4. It can be observed that the applied load is a dominant parameter on the wear loss followed by sliding velocity and weight percentage of graphite content.
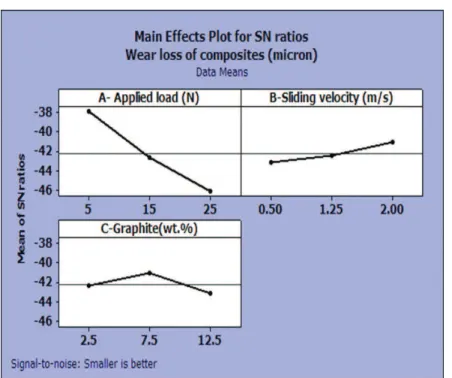
From the response diagram of S/N ratio (Figure 3), it was found that the optimum parameters were load (5N), sliding velocity (2m/s) and wt. % of graphite (7.5 wt. %) for the composites.
3.3.
Results of ANOVA
ANOVA establishes the optimum combination of process parameters more accurately by investigating the relative importance among the parameters. ANOVA was performed with the help of the software MINITAB16 for a level of significance of 5 % to study the contribution of the parameters. In the ANOVA analysis (Table 5), there is a P-value for each independent parameter in the model. When the P-value is less than 0.05, then the parameter can be considered as statistically highly significant. It was observed that applied load, sliding velocity and wt. % graphite have less than 0.05, which means that they are highly significant at 95% confidence level. The last column of the Table 5 shows the percentage contribution (Pc%) of each variable in the total variation indicating their degree of influence on the wear loss of the composites. It was observed that the applied load (84.57%) was the major contributing parameter followed by sliding velocity (8.038%) and finally wt.% of graphite (7.036%) influencing the wear loss of the Al– 5 wt.% Al2O3-Gr composite.
It can be inferred from the ANOVA analysis that the addition of 7.5 wt. % Gr was found to be optimum value in enhancing the wear resistance of Al– 5wt. %Al2O3 composite. The improvement of wear resistance is mainly due to the formation of tribolayer which is composed of oxides, graphite and fractured Al2O3 particles. Graphite
Figure 1. SEM micrograph of the Al – 5 wt. % Al2O3-7.5 wt. % Gr composite.
Figure 2. Hardness of specimens.
Table 3. Measured values and S/N ratios for wear loss of composites.
Exp. No Applied load(N) (A)
Sliding velocity (m/s) (B)
Graphite (wt. %) (C)
Wear loss (µm)
S/N Ratio
1 5 0.50 2.5 95 –39.5545
2 5 1.25 7.5 65 –36.2583
3 5 2.00 12.5 78 –37.8419
4 15 0.50 7.5 135 –42.6067
5 15 1.25 12.5 165 –44.3497
6 15 2.00 2.5 110 –40.8279
7 25 0.50 12.5 231 –47.2722
8 25 1.25 2.5 215 –46.6488
9 25 2.00 7.5 166 –44.4022
particles form as a lubricating layer and prevent the direct contact between the sliding surfaces. It was also found that the wear loss of the composite increased with increasing graphite content beyond 7.5wt.%. This can be possibly due to the higher graphite content leading to the higher porosity of Al – 5 wt. % Al2O3 composite as well as reducing the hardness of composite. Moreover, addition of 2.5 wt. % the graphite particles could not reduce the wear of Al – 5 wt. % Al2O3 composite effectively as less graphite particles may readily be exposed on the surface during sliding.
Results show that the low load (5N) and higher sliding velocity (2 m/s) were the optimum values in minimizing the wear. A reasonable explanation for these results could be the formation of oxide-like transferred layer on the surface of the composite, graphite particles which act as solid lubricant and hardness of the Al2O3 reinforcement. Whenever applied load
increases, the friction at the interface between the composite pin and rotating disc apparently increases which increases the wear. On the other hand, very high sliding velocity would increase the wear due to the thermal softening of the matrix material followed by rupturing of the tribolayer.
4. Multiple linear regression model
A multiple linear regression equation was developed to establish the correlation among the significant parameters on the response. The value of regression coefficient, R2 (99.64%) is in good agreement with the adjusted R2
(98.57%) for Al – 5 wt. % Al2O3 – Gr composite. Since both the values are reasonably close to unity, model provides reasonably good explanation of the relationship between the independent parameters and the response (wear loss).
Table 4. Response table for Signal to Noise Ratio - Smaller is better (wear loss).
Parameters Level 1 Level 2 Level 3 Delta Rank
Applied load (N) (A) –37.88 –42.59 –46.11 8.22 1
Sliding velocity (m/s) (B) –43.14 –42.42 –41.02 2.12 2
Graphite (wt. %) (C) –42.34 –41.09 –43.15 2.07 3
Figure 3. Response diagram of S/N ratio for wear loss of Al –5 wt. % Al2O3- Gr composites.
Table 5. ANOVA analysis for Wear loss.
Parameters DoF Seq.SS Adj.MS F value P Value Pc
Applied load (N) (A) 2 23362.7 11681.3 236.78 0.004 84.57
Sliding velocity (m/s) (B) 2 2220.7 1110.3 22.5 0.043 8.038
Graphite (wt. %) (C) 2 1944.0 972.0 19.70 0.048 7.036
Error 2 98.7 49.3 0.357
Total 8 27626.0 100
The regression equation developed for wear loss of the composite is
(
)
(
)
(
)
W 62.7 6.23 Load 23.8 Sliding velocity
1.80 Graphite content
=+ −
+ (2)
It can be observed from (Equation 2) that the coefficients associated with applied load and graphite content is negative. It indicates that the wear of the composite increases with increasing applied load and graphite content. Conversely, the wear of the composite decreases with increasing the sliding velocity since the coefficient associated with the velocity is negative.
Additional wear tests were conducted at the optimum parameters (applied load 5 N and sliding velocity 2m/s) for Al alloy, Al- 5wt. % Al2O3 and Al- 5wt. % Al2O3- 7.5wt.%
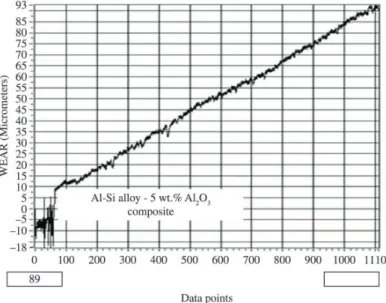
Gr composites. The typical curves of wear loss for the composites are presented in Figures 4 and 5. The wear loss of Al – Si alloy was found to be higher than the tested composites. Since the Al-Si alloy is softer than the carbon steel disc, the asperities of counter face pierces to larger depth which increases wear. Al-5wt. % Al2O3 composite shows higher wear resistance compared to Al-Si alloy. This can be attributed to the fact that the Al2O3 is much harder than that of the matrix material and hence can carry load and resist wear. In addition, Al- Al2O3- Gr composites exhibited a lower wear loss compared to Al- Al2O3 composite. The graphite phase appeared to be responsible for improving the wear resistance by acting as a solid lubricant.
By superimposing the Figures 4 and 5, it can be observed that wear loss of composites increases as the sliding duration
Figure 4. Typical curve of wear of Al-5wt. % Al2O3 composite against steel as a function of sliding duration at 5 N and 2 m/s.
increases. This is because the instability of the tribolayer which is formed on the worn surface, at longer sliding distances.
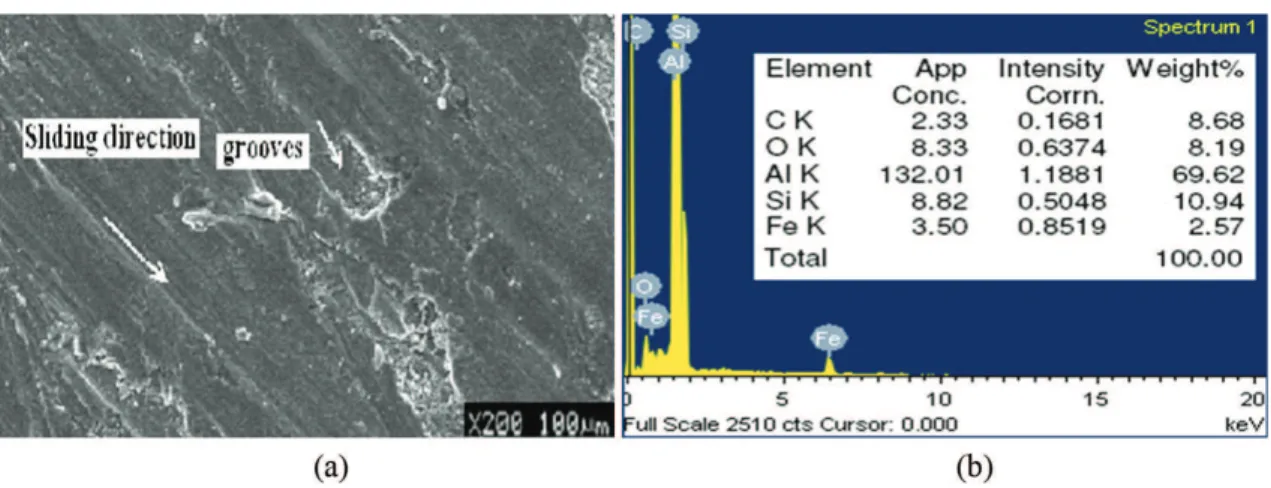
The SEM morphology of the worn surface of the Al – 5 wt. % Al2O3 - 7.5% Gr composite at 5 N and 2 m/s is shown in Figure 6a. It has scratches and sliding marks. But, there are no clear large grooves on the worn surface of the composites. This phenomenon may be caused due to the increase of sliding velocity at low load reduces the wear by supporting Mechanically Mixed Layer (MML). The EDS analysis (Figure 6b) was carried out in the many areas of worn surface, at least seven per specimen. The occurrence of Al, O, Si, and C-peaks in the EDS shows the existence of alumina and the graphite within the analyzed area. EDS investigation also confirmed that oxygen concentration was rich on the worn surface. At low load and high sliding velocity, the worn surface of composite gets oxidized due to the higher heat generation. Little amount of iron content was also found on the worn surface as it is transferred from the steel counter face during sliding. Since the iron mixed oxide film has low coefficient of friction, it contributes to the high wear resistance of the composite at low loads. During sliding, Al2O3 and graphite particles tend to detach
from the composite surface and mixed with oxides, forms a thin layer acts as a solid lubricant between the sliding elements thereby reducing the wear resistance. The presence of MML is believed to be responsible for the observed increased wear resistance. This behaviour was also noted by Rosenberger et al.15.
The SEM morphology of the worn surface of the Al-5 wt. % Al2O3 -7.5 wt. % Gr composite at 25 N and 2 m/s is shown in Figure 7a. The composite showed a mild to severe wear transition for the tests performed at 25 N. With increasing the load the worn surface deteriorates and groove size becomes large and continuous along the sliding direction (marked arrow). The micrograph also shows the mixed regions of both adhesive and abrasive wear. Delamination wear mechanism is dominant as the load is high enough to peel off the oxide film. In addition, the aluminum alloy starts deforming which causes delamination of the matrix. Figure 7b showed evidence for the considerable pick-up of iron from the counter face. Hence, under higher load and velocity, the wear mechanism was considered to be delamination and adhesion which involves fracture and fragmentation of surface layer. The exposed Al2O3 particles pierce the steel counter face which leads to detached steel
Figure 6. (a) Worn surface of the Al- 5 wt. % Al2O3- 7.5wt.% Gr composite. (b) EDS spectrum of MML of the Al-5 wt. % Al2O3- 7.5wt.%
Gr composite when tested at 5N, 2 m/s.
fragments and transferred on to the worn surface of the composite, leading to three body abrasion.
A higher magnification SEM micrograph of the worn surface at 25 N and 2 m/s is shown in Figure 8. Removal of Al2O3 or graphite particles leading to cavities is clearly seen and the particles get fragmented. The worn surface is characterized by deep grooves. Hence, a higher applied load and sliding velocity decreases the wear resistance of the composite. Another reason for decreasing the wear resistance could be due to the existence of pores at the
interface which leads to delamination of tribolayer. Since the rate of removal rate of the oxide film exceeds the formation rate under the higher load and sliding velocity, transition from oxidation wear to delamination wear occurs.
5. Conclusions
This paper has presented an application of L9 orthogonal array of Taguchi method and analysis of variance for investigating the influences of applied load, sliding velocity and wt. % of graphite on the wear loss of composites. Based on this study, the following conclusions have been summarized. The results revealed that load was the most significant parameter followed by sliding velocity and wt. % of graphite particles on the wear loss of composite. It was found that the optimum parameters for minimum wear loss were load (5N) , sliding velocity (2m/s) and wt. % of graphite (7.5 wt. %) . The Al – 5 wt. % Al2O3 composite exhibits better wear resistance when the content of graphite particles is less than or equal to 7.5wt. %. Under low load with higher sliding velocity, wear resistance increased through the formation of stable Mechanically Mixed Layer on the surface of the composite pin. As the wear loss increases with increased applied load, the wear mechanism reported was oxidation at lower loads and adhesion and delamination at higher loads.
Figure 8. Worn surface of the Al- 5 wt. % Al2O3- 7.5wt. % Gr composite. (Normal Load of 25N with 2m/s sliding velocity).
References
1. Basavarajappa S and Davim JP. Influence of graphite particles on surface roughness and chip formation studies in turning metal matrix composites. Materials Research. 2013; 16(5):990-996. http://dx.doi.org/10.1590/S1516-14392013005000098
2. Cerit AA, Karamis MB, Nair F and Yildizli K. Effect of reinforcement particle size and volume fraction on wear behavior of metal matrix composites. Journal of Balkan
Tribological Association. 2008; 12(4):482-489.
3. Krishnan BP, Raman N, Narayanaswamy K and Rohatgi PK. Performance of aluminium alloy graphite bearings in a diesel engine. Tribology International. 1983; 6(5):239-244. http:// dx.doi.org/10.1016/0301-679X(83)90080-4
4. Akhlaghi F and Zare-Bidaki A. Influence of graphite content on the dry sliding and oil impregnated sliding wear behavior of Al 2024-graphite composites produced by in situ powder metallurgy method. Wear. 2009; 266(1-2):37-45. http://dx.doi. org/10.1016/j.wear.2008.05.013
5. Leng J, Jiang L, Wu G, Tian S and Chen G. Effect of graphite particle reinforcement on dry sliding wear of SiC/Gr/Al composites. Rare Metal Materials and
Engineering. 2009; 38(11):1894-1898. http://dx.doi.
org/10.1016/S1875-5372(10)60059-8
6. Gibson PR, Clegg AJ and Das AA. Wear of cast Al-Si alloys containing graphite. Wear. 1984; 95(2):193-198. http://dx.doi. org/10.1016/0043-1648(84)90117-0
7. Pai BC, Rohatgi PK and Venkatesh S. Wear resistance of cast graphitic aluminium alloys. Wear. 1974; 30(1):117-125. http:// dx.doi.org/10.1016/0043-1648(74)90061-1
8. Suresha S and Sridhara BK. Effect of addition of graphite particulates on the wear behaviour in aluminium-silicon carbide-graphite composites. Materials and Design. 2010; 31(4):1804-1812. http://dx.doi.org/10.1016/j.matdes.2009.11.015
9. Guo MLT and Tsao CYA. Tribological behavior of self-lubricating aluminium-Sic- graphite hybrid composites synthesized by the semi-solid powder-densification method.
Composites Science and Technology. 2000; 60(1):65-74. http://
dx.doi.org/10.1016/S0266-3538(99)00106-2
10. Vencl A, Bobic I, Arostegui S, Bobic B, Marinkovic A and Babic M. Structural, mechanical and tribological properties of A356 aluminium alloy reinforced with Al2O3, SiC and SiC + graphite particles. Journal of Alloys and
Compounds. 2010; 506(2):631-639. http://dx.doi.org/10.1016/j.
jallcom.2010.07.028
11. Altinkok N, Ozsert I and Findik F. Dry sliding wear behavior of Al2O3/SiC particle reinforced aluminium based MMCs fabricated by stir casting method. Acta Physica
Polonica A. 2013; 124(1):11-19. http://dx.doi.org/10.12693/
APhysPolA.124.11
12. Mohan S, Pathak JP, Gupta RC and Srivastava S. Wear behaviour of graphitic aluminium composite sliding under dry conditions. Wear. 2002; 93(12):1245-1251.
13. Shanmughasundaram P and Subramanian R. Wear behaviour of eutectic Al-Si alloy-graphite composites fabricated by combined modified two-stage stir casting and squeeze casting methods.
Advances in Materials Science and Engineering. 2013; 2013:1-8. http://dx.doi.org/10.1155/2013/216536
14. Hassan AM, Hayajneh MT and Al-Omari MAH. The effect of the increase in graphite volumetric percentage on the strength and hardness of Al-4weight percentage Mg-graphite composites. Journal of Materials Engineering
and Performance. 2002; 11(3):250-255. http://dx.doi.
org/10.1361/105994902770344024