Spatial Approach of Perinatal Mortality in São
Paulo State, 2003
–
2012
Análise espacial da mortalidade perinatal no estado de
São Paulo, de 2003 a 2012
Taís Siqueira Venâncio
1Tássia Soldi Tuan
1Fernanda Pires Cecchetti Vaz
1Luiz Fernando Costa Nascimento
11Departament of Medicine, Universidade de Taubaté, Taubaté, SP, Brazil
Rev Bras Ginecol Obstet 2016;38:492–498.
Address for correspondence Luiz Fernando Costa Nascimento, MD, Prof., Departamento de Medicina, Universidade de Taubaté, Avenida Tiradentes, 500, 12030-180–Taubaté, SP, Brazil
(e-mail: [email protected]).
Keywords
►
perinatal mortality
►
spatial analysis
►
geographical
information system
Abstract
Objectives
To identifying spatial patterns in the distribution of perinatal mortality in
the state of São Paulo from 2003 to 2012.
Methods
An ecological and exploratory study with data on perinatal mortality rates of
every thousand live births, which were registered on the digital database containing 645
municipalities in the state of São Paulo within the periods of 2003 to 2007 and 2008 to
2012. The spatial analysis provided Moran
’
s index (MI) and thematic maps of rates, and the
Moran maps of both periods were drawn. The average rates were compared by Student
’
s
t
test. The TerraView 4.2.2 software (INPE, S. José dos Campos, Brazil) was also used.
Results
There were 49,485 perinatal deaths during the
fi
rst period, at a rate of 17.90
deaths/1,000 live births (standard deviation [SD]
¼
7.0; MI
¼
0.14;
p
¼
0.01), and
44,582 perinatal deaths during the second period, at a rate of 16.40 deaths/1,000 live
births (SD
¼
11.14; MI
¼
0.04;
p
¼
0.03). These rates are statistically different
(
p
<
0.01). There was a decrease in these rates in 413 municipalities when comparing
the two periods. The Moran map has identi
fi
ed 35 municipalities that require special
attention, which are located in the Eastern, Southwestern, Western and Northwestern
regions of São Paulo state.
Conclusion
The study provides municipal managers with subsidies so they can
minimize these rates by implementing public policies and taking better care of
pregnant women and newborns.
Resumo
Objetivo
Identi
fi
car padrões espaciais na distribuição de mortalidade perinatal no
Estado de São Paulo no período de 2003 a 2012.
Métodos
Estudo ecológico e exploratório, com dados sobre as taxas de mortalidade
perinatal por mil nascidos vivos e inseridos em malha digital dos 645 municípios do
estado de São Paulo entre 2003 e 2007 e 2008 e 2012. A análise espacial forneceu o
índice de Moran (IM), e foram construídos mapas temáticos das taxas e o mapa de
received
May 24, 2016
accepted
September 27, 2016
DOI http://dx.doi.org/ 10.1055/s-0036-1594004.
ISSN 0100-7203.
Copyright © 2016 by Thieme Publicações Ltda, Rio de Janeiro, Brazil
Introduction
Perinatal mortality (PNM) comprises the deaths from gesta-tional age at which the fetus reaches 500 g, equivalent to 22 weeks of gestation, until six days of age (0–6 days: early neonatal period).1Although it is an important indicator of obstetric care and of the neonatal and socioeconomic statuses of the population, there are few studies on this issue in Brazil.2 Since the late 1980s, neonatal mortality has been the main cause of infant mortality, with the highest proportion occur-ring in the early neonatal period, mainly on thefirst day of life, which indicates the existence of a close relationship between the risk of early neonatal death and the access and quality of care provided to pregnant women, mothers and newborns.3–6 Among a few causes of neonatal deaths, some factors should be included, such as preterm birth, low birth weight, and complications during pregnancy, labor and birth.3,5
Data on the year 2009 provided by the Brazilian Ministry of Health shows that 52.2% of infant deaths happened during the early neonatal period.3The Northern and Northeastern regions of Brazil had higher PNM rates in 2009 (20.9 and 20.1/1,000 live births) in contrast with the rate of 13.0 in the state of São Paulo, and 12.3 in Santa Catarina, which was the lowest rate in the country that year.3,7Such rates are found to be quite high in comparison with those from Germany (5.3), Portugal (5.2), Spain (4.7), Finland (2.6), and the United States (6.6).8
Between 2000–2009, over 65% of fetal deaths were due to four basic causes, 2 of them unspecific (intrauterine hypoxia and an unspecified cause), and 2 others that could have been prevented with proper care during pregnancy and labor: placental complications, umbilical and membranes cord, and maternal conditions that are not necessarily related to the current pregnancy.7
Spatial analysis techniques have not been underutilized for the analysis of PNM, even if the maps identifying risk areas have a considerable degree of accuracy. This type of study utilizes geographic areas as a usual observation unit, thus allowing the visualization of the spatial distributions of the disease, and the identification of spatial clusters, that is, any cluster of events that is not merely casual.9 Disease mapping has been developed with the aim of drawing maps whose construction must be free of background noise
or artifacts related to the extent of the geographical area and the existing population in the regions under study.10,11
The aim of this study was to describe the spatial distribu-tion of perinatal mortality in the periods of 2003 to 2007 and 2008 to 2012 in the municipalities of São Paulo.
Methods
An ecological and exploratory study was conducted with data on PNM rates taken as the sum of late fetal deaths (from the 22nd week of gestation) and early neonatal deaths (0–6 days) in the municipalities of São Paulo state from 2003 to 2012. The rates were divided into two periods: 2003–2007 and 2008–2012. Mortality data were acquired from the Computer Science Department of the Brazilian Unified Health Care System (DATASUS)12 and inserted into the digital database of the municipalities of São Paulo, which was obtained from the Brazilian Institute of Geography and Statistics (IBGE).13These data refer to death rates for every 1,000 live births.
Moran’s index (MI) was calculated with its corresponding p-value, which provides the spatial correlation of the obtained rates; this index ranges from -1 toþ1: scores nearþ1 indicate a positive spatial autocorrelation, that is, a similarity among neighboring municipalities, and scores close to zero indicate a significant absence of spatial correlation, in which the events are random. Negative scores mean that they are dissimilar.9A Moran map of both periods was drawn, which identified clusters of municipalities with high rates being surrounded by municipalities with high rates as well, thus suggesting high priority of assistance, and another aggregate with low rates being surrounded by municipalities with low rates as well, those being of lower priority.
The difference between the PNM rates was calculated by subtracting the data rates of thefirst period (2003–2007) from the values of the second period (2008 to 2012). With these data, a thematic map was drawn. The average rates of these two stages were compared by Student’sttest. The PNM averages as a function of age and educational levels, either low or high, are on tables, which were also compared by Student’sttest.
Moran de ambos os períodos. As taxas médias foram comparadas utilizando o teste
t
de
Student. Utilizou-se o programa Terra View 4.2.2.
Resultados
Foram 49.485 óbitos perinatais no primeiro período, taxa de 17,90
óbitos/1.000 nascidos vivos (desvio-padrão [DP]
¼
7,0; IM
¼
0,14;
p
¼
0,01), e
44.582 óbitos perinatais no segundo período, taxa de 16,40 óbitos/1.000 nascidos
vivos (DP
¼
11,14; IM
¼
0,04; p
¼
0,03). Estas taxas são diferentes (
p
<
0,01). Houve
diminuição destas taxas em 413 municípios quando comparados os dois períodos. O
mapa de Moran identi
fi
cou 35 municípios localizados nas regiões Leste, Sudoeste,
Oeste e Noroeste, que merecem uma atenção especial.
Conclusão
O estudo fornece subsídios para que os gestores municipais possam
minimizar estas taxas, implantando políticas públicas e melhor atendimento às
gestantes e recém-nascidos.
Palavras chave
►
mortalidade
perinatal
►
análise espacial
►
sistemas de
The perinatal death rates by maternal age group were: 10 to 19 years, 20–34 years, and 35 years or older. Maps with perinatal death rates related to the educational level of mothers with up to seven years of schooling (low level) and eight years or more (high level) were analyzed on a spatial approach. Information on age and maternal education was obtained from DATASUS.12 The maps were drawn in accordance with the PNM rates of both periods. This study was conducted according to data available on the database without the possibility of identifying the subject. Thus, this study was not submitted to the Research Ethics Committee. The TerraView 4.2.2 software was used, which was kindly provided by the Instituto Nacional de Pesquisas Espaciais (INPE,14available at dpi.inpe.br/download.) The significance level was set atα¼5%.
Results
In the period between 2003 and 2007, 3,045,293 live births were identified, with 28,866 fetal deaths and 20,619 early neonatal deaths, totaling 49,485 perinatal deaths in 645 municipalities in the state of São Paulo; these data represent an average mortality rate of 17.90 perinatal deaths/1,000 live births (SD¼7.07), ranging from 0.00 to 65.78 .
Between 2008 and 2012, 3,028,408 live births were identified, with 26,745 fetal deaths and 17,837 early neona-tal deaths, toneona-taling 44,582 perinaneona-tal deaths during this peri-od in the municipalities of São Paulo; these data represent an average mortality rate of 16.40 perinatal deaths/1,000 live births (SD¼11.14), ranging from 0.00 to 252.42. These averages are significantly different (p<0.01) when com-pared by Student’sttest. The perinatal mortality means were higher when comparing school level within the same period, as well as when comparing 2003-2007 to 2008-2012 periods within the same school level (►Table 1). In respect to age groups, there were no differences in the group of up to 19 years old in comparison with each age period. However, there were significant differences in other age groups; comparing thefirst and third age groups with the second age group, some significant differences are noticeable (►Table 2).
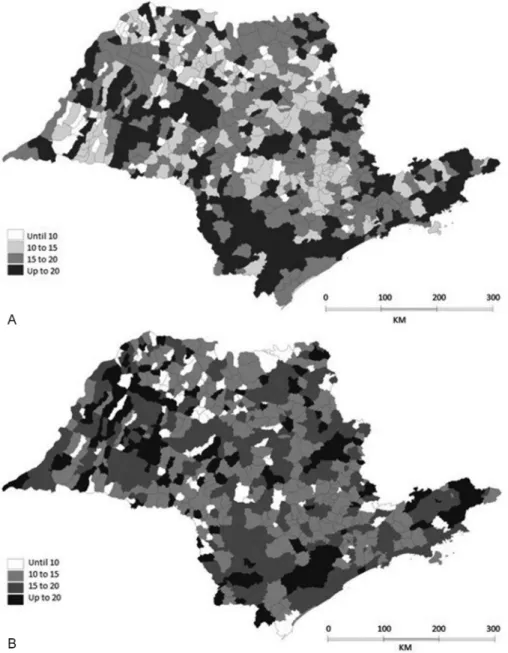
The maps of PNM rates of thefirst and second periods are shown on ►Fig. 1A (2003–2007) and Fig. 1B (2008–2012) respectively. In thefirst period (►Fig. 1A), the municipalities
can be observed where there are high rates of PNM, and they are mainly located in the Far Eastern, Southern, Southwestern and Western regions of the state. The Metropolitan region of the city of São Paulo and the Northern region of the state had lower rates of PNM. In the second period (►Fig. 1B), an improvement in PNM rates can be observed, mainly in the Southern and Southwestern regions, the North Coast, and the Central, Western and Northern regions of the state.
With a difference in PNM rates obtained by subtracting the first period values from the second period values, we could identify the municipalities where there was an increase in these rates. We observed a decrease in PNM rates in 232 municipalities, and an improvement in them in 413 munici-palities of the state, mainly located in the Southern and Southwestern regions, east of the Metropolitan region of the city of São Paulo, and in the Upper Paraiba River Valley region, north and west, as shown in►Fig. 2. The difference in rates has revealed a significant spatial autocorrelation; (MI ¼0.05 andp¼0.02).
Moran’s index calculated for the first period was 0.14 (p¼0.01). The Moran map of the first period (►Fig. 3A) identified 41 municipalities that should be investigated, located in the Eastern, Western and Northwestern regions of the state. During the second period, Moran’s index was 0.04 (p¼0.03), which shows a positive spatial autocorrelation as well. The Moran map identified 35 municipalities in the state that require special attention, ►Fig. 3B, which are located in the Eastern, Southwestern, Western and North-western regions of São Paulo state.
The perinatal mortality rates in age group 20–34 years were displayed on a map (not shown) so that it could be made clear that, in both periods, the Western and Far Eastern regions had rates of 15 or more perinatal deaths/1,000 live births. In the second period, there was a slight improvement, but the highest rates remain in the same regions. Regarding the other age groups, the one that comprised people aged 10–19 years old and the one with individuals 35 years or older, the maps are similar (maps not shown), with the highest rates being 15 or more deaths/1,000 live births, distributed throughout the many regions of the state.
The educational level map (map not shown) showed that the PNM rates of women with 0–7 years of schooling (low educational level) remained high in both periods in the Southwestern, Central and North Coast regions.
Table 1 Mean values, standard deviation andp-values of perinatal mortality in respect to maternal educational level, São Paulo, Brazil, 2003–2012
2003–2007 2008–2012 p p
Educational level
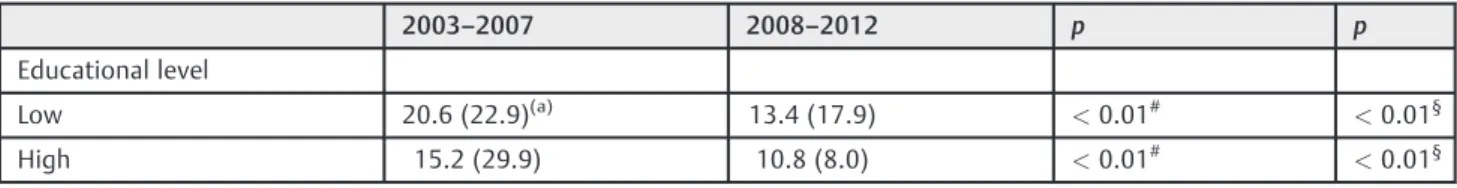
Low 20.6 (22.9)(a) 13.4 (17.9) <0.01# <0.01§
High 15.2 (29.9) 10.8 (8.0) <0.01# <0.01§
Notes: (a) Standard deviation.
# Comparing the average of educational level for thefirst period.
Discussion
In the present study, we identified a significant spatial PNM rate distribution pattern in the state of São Paulo. We also identified municipalities located in the far Eastern, Southern,
Southwestern and Western regions of the state, where there was an increase in these rates, and the municipalities where there was a decrease in such rates, which are located in the Metropolitan region of the city of São Paulo, while the Northern region of the state had lower rates of PNM. Table 2 Mean values, standard deviation andp-values of perinatal mortality in respect to maternal age group, São Paulo, Brazil, 2003–2012
2003–2007 2008–2012 p p[2003–2007] p[2008–2012]
Age
Up to 19 years 13.6 (12.6)(a) 13.8 (14.1) >0.05# >0.05§ <0.01§
20–34 years 13.3 (11.7) 11.7 (9.1) <0.01# — —
-35 years or older 20.5 (18.1) 18.1 (21.2) <0.01# <0.01§ <0.01§
Notes: (a) Standard deviation.
# Comparing the averages of perinatal mortality by age group between thefirst and second periods.
§ Comparing the perinatal mortality means by age group in the same period with reference to the age group 20–34 years old.
The main contribution of this study was the identification of the areas with high PNM rates, because stillbirths display a large proportion of deaths that could have been prevented. It is estimated that over 2.5 million late fetal deaths occur worldwide, a rate that could be reduced with integrated health care actions, because perinatal mortality is an impor-tant marker of quality care in prenatal care. De Bernis et al,15 in a review article, highlight several measures that could contribute to the reduction of stillbirths and preventable deaths.
There are few studies on PNM in Brazil that identify local realities and show rates that are twice to three times higher if compared with those of developed countries.16This is thefirst study performed with all municipalities of the state of São Paulo by using the tools of spatial analysis and PNM data. The deaths were analyzed in two periods. Spatial pattern identification has been an important tool in public health care and, in recent years, analytical techniques have been improving.9–11
There was a decrease in PNM rates in São Paulo State, and these rates were lower in comparison with the ones found in the states of the Northern and Northeastern regions of Brazil,3,7but they remain elevated if compared with the rates of developed countries8. Perinatal mortality rates decreased both in the United States between 2006–2012,17and in Guatemala, whose improvement was due to major increases in hospital-based delivery with skilled birth attendants, as well as improvements in the quality of delivery care, neonatal care, and prenatal care.18 Differences between cities can also occur.19 Stillbirth is an important global health problem, with an estimated 2.6 million stillbirths occurring every year, which should be added to the global burden of deaths for women and children: 5.9 million deaths of children younger than 5 years old (including 2.87 million newborn deaths). In most high-income countries, still-birth rates outnumber the rates of infant death. The costs associated to stillbirths go beyond the loss of life, and include maternal depression andfinancial costs for the parents, as well
as long-term economic costs to society.15The high PNM rates observed in this study are concentrated in municipalities where they can be associated with poor quality of life and unfavorable health indicators.20In these places, there is a greater concen-tration of population with monthly incomes of up toUS$ 125.00,21a situation that can affect the health of the population. It is worth mentioning that the region with the highest PNM prevalence is also composed of mothers with inadequate schooling for their age. In contrast, the municipalities with low PNM rates possibly provided better access to health care services, which positively influenced children’s health care.3,21 The rate difference map identified 413 municipalities where there was an improvement in PNM rates, and 232 municipalities where the opposite occurred, with a signifi -cant spatial autocorrelation (MI¼0.05; p¼0.02), that is, there are municipalities with high PNM rates that are also surrounded by municipalities with high rates, and that possibly has a common cause. Perinatal mortality reduction was an important factor, and it probably occurred due to improvements in perinatal care. The Perinatal Committee Board structure, which is a permanent and deliberative forum, responsible for managing the maternity care and newborn policies, can be one of the factors that contributes to the quality and completeness of actions in this area.3,21
results of this study, showing that in the regions where there are higher PNM rates, there are also mothers with fewer years of schooling (including those that only reached the lower elementary school level). Some Brazilian studies con-firm that low maternal education is related to higher PNM rates.3,22–24Mothers with fewer years of schooling possibly have worse socioeconomic conditions, and an increased vulnerability to risk situations that interfere with fetal and infant health. These data corroborate the results found in this study, making it necessary to improve the situation of these women in order to reduce health inequalities.3
The possible limitations of this study may be due to the source used, the Mortality Information System (SIM), an official source from the Brazilian Ministry of Health that is reliable and widely used in scientific journals. It allows the analysis of information on maternal and children deaths through their death certificates. However, it is important
to note that the data provided are for accounting purposes, and not just for epidemiological studies, which may have some degree of inaccuracy, since there still are a few prob-lems with PNM records in Brazil, even though the absolute majority of births occur within the hospital environment. This high underreporting also occurs in many countries, especially regarding stillbirths, due to the high prevalence and occurrence of cases that do not have the assistance of health care services,25,26when comorbidities are not includ-ed in ecological studies, since these records hold no infor-mation on individual exposure and disease.21 It became difficult to compare the results of this study with others with the same approach because of the lack of studies that evaluate perinatal mortality through spatial analysis.
Paulo. Thus, it was not possible to assess the quality of the health care provided to pregnant women. It was also not possible to use the variable birth weight, since there is no weight discrimination in the DATASUS database, thus dem-onstrating the difficulties of obtaining accurate data on possible diseases that influence PNM.
The availability of valid and reliable information is a relevant condition to assess the health situation of the site being studied herein, and to support the interventions that should be made based on the evidence.27,28Thus, the PNM spatial analysis is a useful tool to help identify areas that should have better performance managers, and to improve access to pregnant women’s health. Space monitoring PNM will assist in planning interventions and help researchers evaluate the impacts of public policy, thus reducing PNM.3
This study gave us knowledge of the spatial distribution of PNM in the municipalities of São Paulo, and it helped identify municipalities that must be subjected to interventions by municipal and state managers, to ensure the access of pregnant women to primary health care by identifying comorbidities and referring them to the proper services, hence improving the health care strategy. Therefore, the analysis of deaths from preventable causes reflects the operation of the health care network, allowing an identifi ca-tion of missed intervenca-tion opportunities by the health care services in order to redirect practices and prevent further occurrences.7
Acknowledgment
Tais Siqueira Venâncio would like to thank the São Paulo Research Foundation–FAPESP, for the granted scholar-ship (process n. 2014/18590–1).
References
1 Medronho RA. Epidemiologia. São Paulo: Atheneu; 2006
2 Lansky S, França E, César CC, Monteiro Neto LC, Leal MdoC. Perinatal deaths and childbirth healthcare evaluation in mater-nity hospitals of the Brazilian Unified Health System in Belo Horizonte, Minas Gerais, Brazil, 1999. Cad Saude Publica 2006; 22(1):117–130
3 Jacinto E, Aquino EM, Mota ELA. Perinatal mortality in the municipality of Salvador, Northeastern Brazil: evolution from 2000 to 2009. Rev Saude Publica 2013;47(5):846–853
4 Almeida MF, Novaes HM, Alencar GP, Rodrigues LC. Mortalidade neonatal no Município de São Paulo: influência do peso ao nascer e de fatores sociodemográficos e assistenciais. Rev Bras Epidemiol 2002;5(1):93–107
5 Cascaes AM, Gauche H, Baramarchi FM, Borges CM, Peres KG. Prematurity and associated factors in Santa Catarina State, Brazil, in 2005: an analysis based on data from the Information System on Live Births. Cad Saude Publica 2008;24(5):1024–1032
6 Victora CG. Intervenções para reduzir a mortalidade infantil pré-escolar e materna no Brasil. Rev Bras Epidemiol 2001;4(1):3–69
7 Brasil. Ministério da Saúde. Secretaria de Atenção à Saúde. Departamento de Ações Programáticas Estratégicas. Atenção à saúde do recém-nascido: guia para os profissionais de saúde. 2a ed. Brasília (DF): Ministério da Saúde; 2014
8 World Health Organization. Regional Office for Europe [Internet]. European Health for All Database (HFA-DB). Copenhagen: WHO;
2010 [cited 2013 Sep 14]. Available from: http://data.euro.who. int/hfadb/
9 Brasil. Ministério da Saúde. Secretaria de Vigilância em Saúde. Fundação Oswaldo Cruz. Introdução à estatística espacial para saúde pública. Brasília (DF): Ministério da Saúde; 2007. (Série Capacitação e Atualização em Geoprocessamento em Saúde; 3).
10 Nascimento LF, Batista GT, Dias NW, Catelani CS, Becker D, Rodrigues L. Spatial analysis of neonatal mortality in Paraíba Valley, Southeastern Brazil, 1999 to 2001. Rev Saude Publica 2007;41(1):94–100
11 Lawson A, Böhing D, Biggeri A, Lesaffre E, Viel JF. Disease mapping and its uses. In: Lawson A, Biggeri A, Böhning D, Lesaffre E, Viel JF, Bertollini R, editors. Disease mapping and risk assessment for public health. New York: John Wiley & Sons; 1999:3–13
12 Brasil. Ministério da Saúde. DATASUS [Internet]. Estatísticas vitais [citado 2015 Abr 20]. Disponível em:http://www2.data-sus.gov.br/DATASUS/index.php?area¼0205
13 Instituto Brasileiro de Geografia e Estatística [Internet]. Down-load [cited 2014 Mar 10]. Disponível em: http://downDown-loads.ibge. gov.br/downloads_geociencias.htm
14 Brasil. Ministério da Ciência, Tecnologia e Inovação. Instituto Nacional de Pesquisas Espaciais [Internet]. TerraView [citado 2014 Mar 10]. Disponível em: http://www.dpi.inpe.br/terra-view/index.php
15 de Bernis L, Kinney MV, Stones W, et al; Lancet Ending Prevent-able Stillbirths Series study group; Lancet Ending PreventPrevent-able Stillbirths Series Advisory Group. Stillbirths: ending preventable deaths by 2030. Lancet 2016;387(10019):703–716
16 Moura PM. [Hierarchization of delivery and birthcare–Perinatal mortality, 2001–2006]. Rev Bras Ginecol Obstet 2009;31(9):475 Portuguese.
17 Gregory EC, MacDorman MF, Martin JA. Trends in fetal and perinatal mortality in the United States, 2006-2012. NCHS Data Brief 2014;(169):1–8
18 Garces A, Mcclure EM, Hambidge K, et al. Trends in perinatal deaths from 2010 to 2013 in the Guatemalan Western Highlands. Reprod Health 2015;12(Suppl 2):S14
19 Vos AA, DenktaşS, Borsboom GJ, Bonsel GJ, Steegers EAP.
Differ-ences in perinatal morbidity and mortality on the neighbourhood level in Dutch municipalities: a population based cohort study. BMC Pregnancy Childbirth 2015;15:201
20 Nascimento LF, Almeida MCS, Gomes CdeM. [Neonatal mortality and avoidable causes in the micro regions of São Paulo state]. Rev Bras Ginecol Obstet 2014;36(7):303–309 Portuguese.
21 Venâncio TS, Tuan TS, Nascimento LF. Indidence of tuberculosis in children in the state of São Paulo, Brazil, under spatial approach. Cien Saude Colet 2015;20(5):1541–1547
22 Martins EF, Rezende EM, Almeida MC, Lana FC. Perinatal mortality and socio-spatial inequalities. Rev Lat Am Enfermagem 2013; 21(5):1062–1070
23 Lansky S. Gestão da qualidade e da integralidade do cuidado em saúde para a mulher e a criança no SUS-BH: a experiência da comissão perinatal. Rev Tempus Actas Saúde Coletiva. 2010;4(4): 191–199
24 Mortensen LH, Helweg-Larsen K, Andersen AM. Socioeconomic differences in perinatal health and disease. Scand J Public Health 2011;39(7, Suppl)110–114
25 Centre for Maternal and Child Enquiries (CMACE). Perinatal mortality 2009: United Kingdom. London: CMACE; 2011
26 MacDorman MF, Kirmeyer SE, Wilson EC. Fetal and perinatal mortality, United States, 2006. Natl Vital Stat Rep 2012;60(8): 1–22
27 Lansky S, França E, Kawachi I. Social inequalities in perinatal mortality in Belo Horizonte, Brazil: the role of hospital care. Am J Public Health 2007;97(5):867–873