Objectives: To present the breastfeeding (BF) indicators obtained in the Second Survey on Prevalence of Breastfeeding in the Brazilian Capitals and the Federal District and to analyze their evolution from 1999 to 2008.
Methods: A cross-sectional study was conducted in children younger than 1 year old who participated in the second phase of the multivaccination campaign in 2008. We used two-stage cluster sampling. The questionnaire consisted of closed questions, including data on consumption of breast milk, other types of milk, and other foods on the day prior to the survey. We analyzed the prevalence of BF in the irst hour of life; exclusive BF in children younger than 6 months; BF in children aged 9 to 12 months; and medians of exclusive BF and BF. The time variation of BF was established by comparing the medians of exclusive BF and BF in 1999 and 2008.
Results: We obtained data from 34,366 children. We found that 67.7% (95%CI 66.7-68.8) of the children were breastfed in the irst hour of life; the prevalence of exclusive BF in children aged 0 to 6 months was 41% (95%CI 39.7-42.4), while the prevalence of BF in children aged 9 to 12 months was 58.7% (95%CI 56.8-60.7). There was an increase of 30.7 days in the median duration of exclusive BF and 45.7 days in the median of BF.
Conclusion: There was a signiicant improvement in the breastfeeding prevalence in the last decade. However, further efforts are required so that Brazil can reach BF rates compatible with the recommendations of the World Health Organization.
J Pediatr (Rio J). 2010;86(4):317-324: Breastfeeding, exclusive breastfeeding, cross-sectional study, indicators.
ORiginal aRtiCle
Copyright © 2010 by Sociedade Brasileira de Pediatria317 introduction
Breastfeeding (BF) is the best strategy to prevent child deaths,1 in addition to promoting physical, mental,
and emotional health of children. It is estimated that BF can reduce by 13% the deaths of children under 5 years1
and by 19 to 22% the neonatal deaths if practiced in the
irst hour of life.2,3 Therefore, promotion of BF should be
included among priority health actions.
Brazil has been investing in the promotion of BF since 1981 with the establishment of the National Program of
Breastfeeding Incentive, considered a model because of the diversity of actions.4 Thanks to national studies, it is
evident that BF rates have been gradually increasing in Brazil. Venancio & Monteiro5 demonstrated an increase in BF
duration between 1974 and 1989, from 2.5 to 5.5 months.5 Data from the National Surveys on Demography and Health (Pesquisas Nacionais sobre Demograia e Saúde - PNDS) conirmed this trend, identifying increases in the BF median
from 7 months in 19966 to 14 months in 2006.7
Breastfeeding practice in the Brazilian capital cities
and the Federal District: current status and advances
Sonia i. Venancio,1 Maria M. l. escuder,2 Sílvia R. D. M. Saldiva,3 elsa R. J. giugliani4
1. Doutora. Pesquisadora, Instituto de Saúde, Secretaria Estadual de Saúde de São Paulo (SES-SP), São Paulo, SP, Brazil. 2. Mestre. Pesquisadora, Instituto de Saúde, SES-SP, São Paulo, SP, Brazil.
3. Doutora. Pesquisadora, Instituto de Saúde, SES-SP, São Paulo, SP, Brazil.
4. Doutora. Professora associada, Universidade Federal do Rio Grande do Sul (UFRGS), Porto Alegre, RS, Brazil.
This study was conducted at the Health Institute, São Paulo State Department of Health (Secretaria Estadual de Saúde de São Paulo, SES-SP), São Paulo, SP, Brazil.
Financial support: Brazilian Ministry of Health.
No conflicts of interest declared concerning the publication of this article.
Suggested citation: Venancio SI, Escuder MM, Saldiva SR, Giugliani ER. Breastfeeding practice in the Brazilian capital cities and the Federal District: current status and advances. J Pediatr (Rio J). 2010;86(4):317-324.
The first information on the status of exclusive
breastfeeding (EBF) in Brazil was provided by a study conducted in 1986, which demonstrated that only 3.6%
of the children between 0 and 4 months were exclusively
breastfed.8 Data from 2006 showed EBF prevalence of
38.6% in children under 6 months.7
In 1999, the irst survey on the prevalence of BF was
conducted in the Brazilian capital cities and the Federal District (FD) during a national vaccination campaign. There was a prevalence of 35.6% of EBF in children under 4 months and a BF median duration of 10 months.9
In 2008, with the support of the Brazilian Ministry
of Health, the Second National Survey of BF Prevalence
(II PPMA) was conducted10 using the same methodology
employed in the 1999 survey. The reason for conducting the survey was the need managers had to obtain an analysis of the progress in the BF status, considering the various actions carried out within the scope of the national policy. The present article presents data related to the key indicators of BF in the Brazilian capital cities and the FD and analyzes its evolution from 1999 to 2008.
Methods
This is a cross-sectional study involving children younger than 1 year old who participated in the 2008 multivaccination campaign held in all Brazilian capital cities and the FD.
Personnel of the State and City Departments of
Health were trained during three 16-hour workshops that
prepared the professionals to carry out all stages of the study. Participants received support manuals containing
guidelines for municipal coordinators, ield supervisors,
and interviewers.
The questionnaire was administered using two-stage cluster sampling and probability proportional to size of
clusters. In the irst stage, the vaccination centers were
randomly selected, and in the second stage, children from each center were randomly selected.11 Samples were
planned based on information provided by the states: number of vaccination centers in each capital city and number of children under 1 year old vaccinated at each center in 2007. The sample size took into consideration the prevalence of EBF in the capital cities and the FD in 1999, with an additional number of 2 to 10%, based on the predicted increase in prevalence. To compensate for the accuracy losses inherent to cluster sampling, we added the design effect, multiplying the initial estimate by 1.5, and also considering a non-response rate of 5 to 10%. The sample size required to estimate the EBF in children under 6 months was multiplied by 2.
The questionnaire included closed questions about the consumption of breast milk, other types of milk, and other foods, including water, teas and other liquids, on the day
prior to the survey. The use of current status, recommended
by the World Health Organization (WHO),12 aims to minimize
possible biases resulting from the informant’s memory, which is particularly suitable for the characterization of EBF. This instrument was administered by previously trained interviewers to all caregivers of children younger than 1 year old during the second stage of the 2008 multivaccination campaign. The interviews took place during the whole day of the campaign and, in the cities where vaccination activities were held before or after the scheduled date, interviewers were instructed to carry out data collection during the entire campaign period.
The municipalities were responsible for data entry into an online application developed to this end. Databases of
capital cities and the FD were subsequently exported to an
SPSS 16.0 database.
Speciic procedures were used for the analysis of the questionnaires with complex probability sampling.
Prevalence estimates consider the standard error determined by the sampling design and their respective
95% conidence intervals (95%CI). Because of population
differences between the capital cities involved, each plan represented a different sampling fraction, represented by the estimated sample size on the number of children being vaccinated. The inverse of this fraction was used to calculate regional prevalence rates and prevalence rates for all capital cities.
We analyzed the following indicators proposed by the
WHO12: BF in the irst hour of life; EBF in children under 6 months old; continued BF; and median duration of EBF
and BF. Children were considered to be under EBF when they received only breast milk without any other foods or
liquids, including water and tea; and children being breastfed
where those who had received breast milk, regardless of other foods. The medians of EBF and BF were obtained by logit analysis, which estimates the probability of occurrence of the event being investigated based on age by means of statistical modeling.
Time variation of BF was established by comparing the medians of EBF and BF, based on data published in the 1999 and 2008 studies. We calculated the difference of the indicator, in days, and its degree of evolution, in percentage, obtained by calculating: [(2008 median - 1999 median)/ median in
1999 x 100]. We found a statistically signiicant change when
there was no overlap of the respective 95%CI.
We also tested the correlation between BF status in 1999 and the degree of evolution of the medians of EBF and BF. The results are presented in correlation graphs designed using the SPSS 16.0 software.
The study protocol was approved by the Research Ethics
Committee of the Health Institute (protocol 001/2008 dated
May 6, 2008), after consulting the National Research Ethics
BF in the irst hour EBF in children under BF in children
of life 6 months from 9 to 12 months
Region/capital city % 95%Ci % 95%Ci % 95%Ci
North 72.9 70.0-75.0 45.9 42.9-49.0 76.9 73.8-80.0
Belém 72.8 69.2-76.1 56.1 50.2-61.9 79.9 72.5-87.3
Boa Vista 77.5 74.9-79.9 40.7 35.8-45.7 74.2 68.2-80.2
Macapá 75.8 73.4-78.0 43.1 39.1-47.1 82.8 78.2-87.3
Manaus 71.9 67.5-75.9 41.1 37.4-44.9 76.9 71.5-82.4
Palmas 79.6 76.6-82.3 35.7 30.3-41.4 67.9 61.7-74.0
Porto Velho 73.8 70.6-76.7 36.4 31.1-42.1 71.0 64.7-77.3
Rio Branco 64.3 58.4-69.8 36.1 29.0-43.8 62.9 51.8-73.9
Northeast 66.9 65.4-68.5 37.0 35.0-39.0 59.1 56.7-61.5
Aracaju 61.2 57.8-64.4 35.0 29.0-41.5 63.6 56.8-70.4
Fortaleza 67.6 64.5-70.6 32.9 29.0-37.0 57.3 51.7-62.9
João Pessoa 76.9 73.5-80.0 39.1 35.4-42.9 53.1 45.7-60.5
Maceió 64.8 60.9-68.5 34.0 28.8-39.5 58.6 50.9-66.3
Natal 70.3 66.9-73.6 40.5 36.7-44.4 55.2 49.1-61.4
Recife 66.8 63.0-70.4 38.3 32.7-44.2 59.1 52.7-65.5
Salvador 58.5 54.4-62.5 36.5 32.3-40.9 59.1 52.7-65.5
São Luís 83.5 79.8-86.6 46.7 40.3-53.1 76.9 70.4-83.4
Teresina 79.0 73.0-84.0 43.7 38.4-49.3 75.0 69.9-80.1
Central West 72.0 69.8-74.0 45.0 42.2-47.9 64.1 60.3-67.9
Campo Grande 74.3 71.0-77.3 50.1 44.7-55.4 70.0 64.0-76.1
Cuiabá 77.4 72.3-81.8 27.1 22.3-32.6 66.4 59.0-73.8
Federal District 72.5 69.3-75.4 50.0 45.8-54.2 65.4 60.1-70.8
Goiânia 66.7 63.1-70.0 32.7 29.5-36.0 53.8 48.1-59.5
Southeast 63.5 61.3-65.7 39.4 36.5-42.3 51.4 47.8-55.0
Belo Horizonte 64.1 60.4-67.7 37.9 33.2-42.9 50.0 43.1-56.8
Rio de Janeiro 65.6 63.4-67.7 40.7 37.3-44.2 58.3 54.8-61.8
São Paulo 62.4 59.2-65.6 39.1 35.0-43.3 48.7 43.6-53.9
Vitória 72.8 69.3-76.0 44.0 39.8-48.3 59.1 52.6-65.7
South 71.8 69.9-73.7 43.9 41.1-46.7 49.5 45.2-53.9
Curitiba 71.2 68.2-74.0 46.1 41.6-50.6 48.5 41.9-55.1
Florianópolis 75.5 72.1-78.7 52.4 47.9-56.9 52.2 46.5-58.0
Porto Alegre 71.9 69.0-74.5 38.2 35.2-41.3 50.2 43.4-57.0
Brazil 67.7 66.7-68.8 41.0 39.7-42.4 58.7 56.8-60.7
table 1 - Main breastfeeding indicators (Brazil, regions and capital cities, 2008)
95%CI = 95% confidence interval.
BF = breastfeeding; EBF = exclusive breastfeeding. Results
We included 34,366 children in the present study. There was a slight male predominance (50.4%) and a larger number of children up to 6 months of age (55.4%). Most mothers were between 20 and 35 years old (72.2%), and the percentage of mothers under the age of 20 years old
was 17.2%; 86.2% of the mothers had under 12 years of
schooling and 24.9% had less than 8 years of educational
level; 66.2% did not have out-of-home jobs, 11.9% were on
maternity leave, and 21.9% had a job when the interview was made.
Table 1 shows the indicators “BF in the irst hour of life,” “EBF in children under 6 months,” and “BF in children from 9 to 12 months.”
We found that 67.7% of the children had been breastfed
in the irst hour of life; the North, Central West and South
regions showed the best results (72.9, 72.0, and 71.8%, respectively), and the Southeast region had the lowest percentage of children in this condition (63.5%). The comparison between the capital cities demonstrated that São Luís had the best rate (83.5%) whereas Salvador had the worst rate (58.5%). Worth of notice was the fact most capital cities (17) showed rates higher than the mean for all children studied.
EBF prevalence in children under 6 months was 41% in
all capital cities and the FD; the North region showed the
1999 2008 evolution
Region/capital city Mediana 95%Ci Medianb 95%Ci Δ (b-a) (%)
North* 24 21.5-26.8 66.2 61.3-70.9 42.2 175.83
Manaus* 7.6 2.6-22.4 49.9 38.9-59.9 42.3 556.58
Porto Velho* 13.6 8.8-21.2 59.4 47.9-69.3 45.8 336.76
Boa Vista* 19.2 13.4-27.5 56.9 48.8-64.1 37.7 196.35
Rio Branco 14.1 9.4-21.0 38.8 19.3-54.0 24.7 175.18
Palmas* 23.9 18.6-30.7 57.2 44.2-68.0 33.3 139.33
Macapá* 42.1 36.9-48.1 74.3 64.9-82.6 32.2 76.48
Belém* 56.1 45.6-68.9 88.8 83.5-94.1 32.7 58.29
Northeast* 26.3 24.1-28.6 34.9 29.5-39.9 8.6 32.70
Recife* 6.8 1.9-24.3 49.6 44.3-54.5 42.8 629.41
Maceió 8.2 4.8-14.2 28.4 5.12-46.0 20.2 246.34
João Pessoa* 21.9 17.0-28.2 61.1 51.9-69.2 39.2 179.00
Natal* 25 19.3-32.4 56.2 46.7-64.6 31.2 124.80
Aracaju* 24.6 19.2-31.4 49.9 35.8-61.6 25.3 102.85
Salvador 15.4 10.1-23.4 31.2 19.6-41.1 15.8 102.60
Teresina* 33.4 27.4-40.8 61.9 49.0-72.9 28.5 85.33
São Luís 30.3 19.5-47.2 55.7 37.9-70.3 25.4 83.83
Fortaleza* 63.6 58.4-69.2 10.6 -0.5-20.1 -53.0 -83.33
Central West 19.5 17.1-22.3 66.6 61.5-71.4 47.1 241.54
Campo Grande* 17.6 12.9-24.0 78 70.5-85.1 60.4 343.18
Goiânia* 9.3 5.8-15.1 38.6 29.1-46.8 29.3 315.05
Federal District* 45 40.1-50.5 77.7 71.4-83.6 32.7 72.67
Cuiabá 5.1 2.5-10.5 0.7 -38.2-25.9 -4.4 -86.27
Southeast* 13.1 10.1-17.0 55 47.9-61.5 41.9 319.85
Belo Horizonte* 7.8 4.4-13.8 53.8 42.3-63.8 46.0 589.74
São Paulo* 9.2 4.9-17.2 54.8 44.3-64.0 45.6 495.65
Vitória* 26.7 20.8-37.2 62.5 54.3-70.1 35.8 134.08
Rio de Janeiro – – 55.4 48.2-61.9
South 39.1 34.5-44.3 59.3 51.0-66.8 20.2 51.66
Porto Alegre* 29.5 21.8-39.9 51.8 40.9-61.3 22.3 75.59
Curitiba* 34.6 28.3-42.3 59.7 45.7-71.6 25.1 72.54
Florianópolis* 55.6 46.7-66.2 86.5 79.4-93.2 30.9 55.58
Brazil* 23.4 22.1-24.7 54.1 50.3-57.7 30.7 131.20
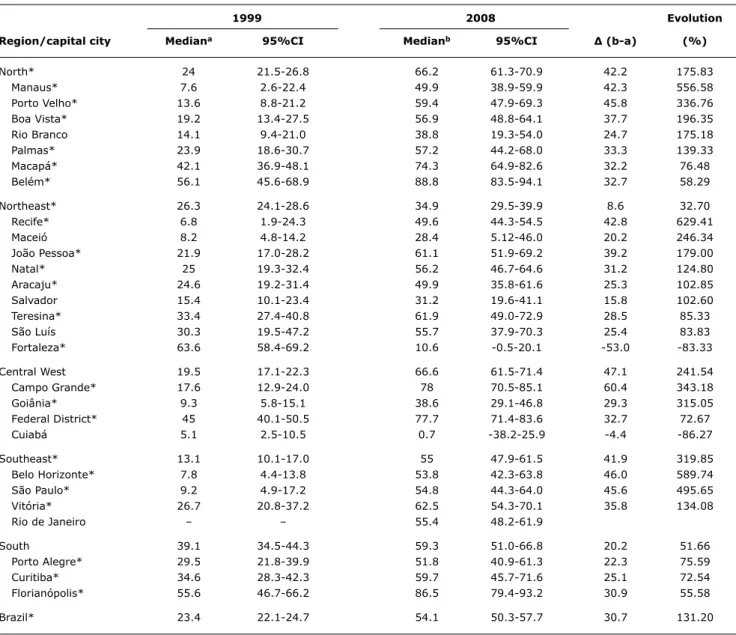
table 2 - Evolution of the median duration of exclusive breastfeeding (Brazil, regions and capitals, 1999 to 2008)
95%CI = 95% confidence interval.
* Difference between statistically significant medians.
regions, with the Northeast region presenting the worst status (37.0%). In relation to the capital cities, Belém stood out with the highest prevalence rate (56.1%), followed by Florianópolis (52.4%), Campo Grande (50.1%), and the FD
(50.0%). On the other hand, the lowest prevalence rate
was found in Cuiabá (27.1%). It is noteworthy that most capital cities (17) had rates lower than the mean for all the children studied.
BF prevalence in children from 9 to 12 months was 58.7%. The North region had the best status (76.9%), followed by the Central West (64.1%), Northeast (59.1%), and Southeast (51.4%) regions, with the South region showing the worst status (49.5%). Regarding the capital cities, Macapá and Belém stood out with the highest prevalence rates (82.8 and 79.9%, respectively), and
Curitiba showed the lowest rate (48.5%). In 15 out of the 27 cities studied, the status was better than the mean found for all the children analyzed.
Table 2 shows comparative data on the median duration of EBF.
We found an increase of 1 month in the median duration of EBF in Brazil, from 23.4 days in 1999 to 54.1 days in 2008.
The comparison between the regions showed signiicant
increases in the Central West region (47.1 days), followed by the North (42.2 days) and Southeast (41.9 days)
regions. In the South region, there was a less signiicant
increase (20.2 days), and the Northeast region had the worst performance (8.6 days). In this region, there was increase in the EBF median in most capital cities, but with
1999 2008 evolution
Region/capital city Mediana 95%Ci Medianb 95%Ci Δ (b-a) (%)
North 414.2 388.0-442.3 434.8 410.4-464.9 20.6 4.97
Rio Branco 311.5 271.7-357.1 376.0 330.1-453.9 64.5 20.71
Manaus 351.4 296.3-416-1 418.1 379.0-475.4 66.7 18.98
Macapá 515.3 436.5-608.2 601.4 498.7-810.4 86.1 16.71
Palmas 336.5 300.6-376.7 379.3 344.9-429.8 42.8 12.72
Porto Velho 392.2 331.6-463.9 434.6 382.0-527.6 42.4 10.81
Boa Vista 429.2 342.0-538.6 418.8 378.7-479.3 -10.4 -2.42
Belém 566.3 434.0-739.0 445.2 404.1-504.5 -121.1 -21.38
Northeast* 252.8* 244.5-261.4 346.8 333.3-362.3 94.0* 37.18
Maceió* 172.0 158.6-186.5 331.5 296.5-384.3 159.5 92.73
Aracaju* 229.0 208.0-252.0 377.4 326.0-471.5 148.4 64.80
João Pessoa* 198.4 181.6-216.8 314.1 290.9-344.7 115.7 58.32
Recife* 196.8 175.6-220.7 293.1 278.7-309.9 96.3 48.93
Fortaleza* 224.7 215.0-234.9 332.8 307.3-366.3 108.1 48.11
Natal* 230.8 203.8-261.3 330.0 307.0-359.7 99.2 42.98
Salvador* 274.6 241.9-311.6 351.6 322.7-391.0 77.0 28.04
São Luís 439.4 365.5-528.2 480.2 414.8-598.2 40.8 9.29
Teresina 478.4 402.1-569.1 456.5 398.3-555.8 -21.9 -4.58
Central West 329.5* 313.4-346.4 373.7 353.8-398.1 44.2 13.41
Campo Grande* 315.0 282.2-351.6 406.0 363.0-471.7 91.0 28.89
Goiânia* 260.9 239.6-284.1 310.9 288.5-340.4 50.0 19.16
Cuiabá 357.1 314.1-406.0 389.9 346.1-460.3 32.8 9.19
Federal District 369.9 339.5-403.0 383.6 354.2-424.2 13.7 3.70
Southeast 240.6* 227.3-254.6 303.5 288.8-320.9 62.9 26.13
São Paulo 180.8* 164.4-198.9 292.8 273.7-316.8 112.0 61.95
Belo Horizonte 211.4* 193.1-231.4 300.7 276.3-333.3 89.3 42.24
Vitória 327.0 291.6-366.7 364.7 334.4-406.3 37.7 11.53
Rio de Janeiro – – 334.1 315.7-356.6 –
South 225.2* 211.3-239.9 302.1 286.2-321.0 76.9 34.15
Porto Alegre 193.5* 169.4-221.0 299.3 274.2-333.2 105.8 54.68
Curitiba 221.9* 203.2-242.3 300.8 278.2-330.4 78.9 35.56
Florianópolis 249.7* 221.2-282.0 326.0 299.6-361.5 76.3 30.56
Brazil 295.9* 289.3-302.7 341.6 331.8-352.4 45.7 15.44
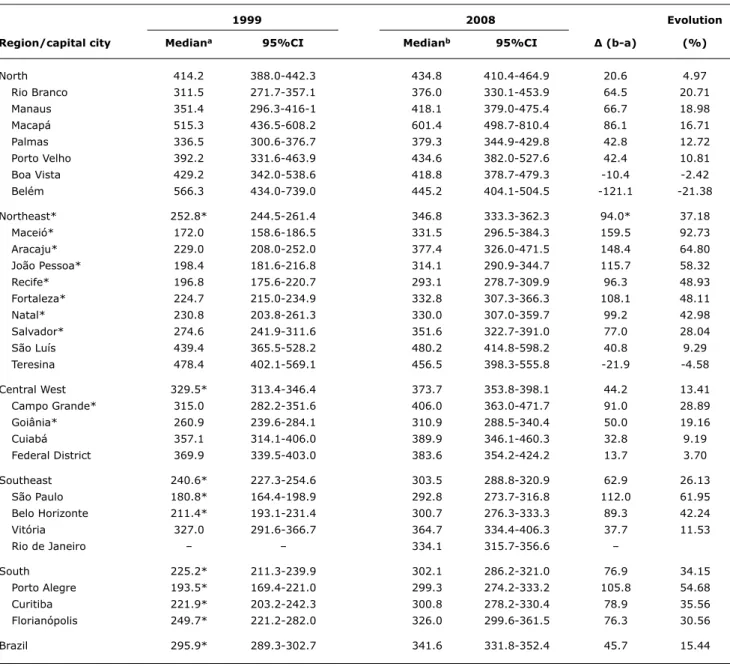
table 3 - Evolution of the median duration of breastfeeding (Brazil, regions and capital cities, 1999 to 2008)
95%CI = 95% confidence interval.
* Difference between statistically significant medians.
days (the best indicator in 1999) to 10.6 days in 2008. The analysis of this indicator shows that favorable changes were
statistically signiicant in 20 capital cities. It is noteworthy
that in Campo Grande there was an increase of 2 months in the median duration of EBF.
Table 3 shows the median duration of BF in the two studies.
The median duration of BF in Brazil increased about 1.5 months, from 295.9 days in 1999 to 341.6 days in 2008. The North region, where there was the longest BF duration in the 1999 study, was the only region where an
increase of 20.6 days was not statistically signiicant. The
Northeast region was the one that stood out in terms of BF
expansion, with an increase of approximately 3 months,
followed by the South (2.5 months), Southeast (2 months), and Central West (1.5 months) regions. Favorable and
statistically signiicant changes were found in 14 capital
cities. Interestingly, in Belém, where we found the highest median of BF duration in 1999 (566.3 days), there was
a more signiicant reduction in 2008 (121 days). A more
favorable evolution was found in Maceió, with an increase of 159 days in the median of BF duration.
BF = breastfeeding; EBF = exclusive breastfeeding.
Figure 1 - Correlation between medians of breastfeeding and exclusive breastfeeding in 1999 in the Brazilian capital cities and the Federal District and its percentage evolution for the period from 1999 to 2008
both cases. In the capital cities where the median of BF duration was lower in 1999, such as in Maceió, São Paulo and Porto Alegre, there was a higher percentage increase and, on the other hand, in Belém, Teresina, and Boa Vista, capital cities with a more favorable status in 1999, there was even a reduction of the median of BF duration.
Discussion
The 2nd PPMA evidenced the current BF status and made it possible to analyze its evolution over the last decade in the Brazilian capital cities and the FD.
First, it is important to highlight some aspects related to the study design. To conduct studies during vaccination campaigns has been a strategy widely recommended and used in Brazil because it enables to collect data within a short period of time and at relatively low costs.13 Furthermore,
the wide population coverage of the campaigns, combined with the use of sampling designs such as the one used in the present study, make it possible to achieve probability samples that are representative of the population of children under 1 year old in the cities studied.
Thus, concerning the external validity of the study, the
second stage of the 2008 vaccination campaign (over 80% in all capital cities and a mean of 95% for Brazil)14 and the fact that the proile of maternal education (considered in this study as a proxy for socioeconomic status) is similar
when comparing the sample analyzed with data from the Information System of Live Births in 2008 (86.2% under 12 years of schooling vs. 83.8%, respectively).15
A limitation of the present study is related to the non-inclusion of population living in rural areas and smaller municipalities.16 On the other hand, the additional advantages
of questionnaires administered during vaccination campaigns are: feasibility of shorter intervals, allowing the evaluation and planning of actions at local level, and its potential for the involvement of municipal medical teams and interviewers, usually recruited from universities
Two other aspects should be highlighted. The irst one
concerns the heterogeneity of the indicators between the capital cities and the regions of the country, reinforcing the
importance of local research; the second aspect refers to
the advances seen in BF practice.
The percentage of children breastfed within the irst
hour of life (67.7%) surpassed that found in the 2006 PNDS (43%) in a sample of children younger than 60 months.7 This difference may be partly explained by the fact that our questionnaire relects a more recent status of children
under 1 year. It was not possible to assess the evolution of this indicator because the 1999 study did not include that information. Its inclusion in the present study was due to
the recent recommendation of the WHO12 and to recent
reports about the impact of this practice on the decrease in neonatal mortality.2,3
The prevalence of EBF in children from 0 to 6 months
(41%) was very similar to that previously identiied in the
2006 PNDS (39.8%).7 The increase of about 1 month in the
median of EBF found in the present study was higher than that found when comparing the 1996 PNDS (median of 1.1 months) with the 2006 study (median of 1.4 months).7 It is
noteworthy, however, that the comparison between the EBF of the 1996 PNDS and the 2006 study should be cautiously interpreted since the 1996 data may be overestimated because of problems during data collection.8 A growing
trend of EBF has been found in several studies conducted in Brazilian cities17-19 and other countries.20-22
The BF indicator in children between 9 and 12 months was used as an indicator of BF continuity. For calculating
this indicator, the WHO recommends using the proportion
of breastfed children aged from 12 to 15.9 months, but as our study included children under 1 year old, we decided to use the age group between 9 and 12 months.
BF continuity had a very heterogeneous behavior between capital cities and regions, ranging from 49.5% in the South to 76.9% in the North. The median of BF found in the present study was 11.2 months, which was lower
than that found in the 2006 PNDS (14.0 months)7; but the
median of BF in urban areas of the country found in the 2006 PNDS was 12.9 months,7 that is, more similar to our
study. Interestingly, despite the increase observed in BF continuity in Brazil, its median is still lower than that found by Pérez-Escamilla21 in Bolivia (17.5 months), Guatemala
(19.9 months), and Peru (19.5 months) in the 1990s.
The WHO recommends EBF until 6 months and continuing
BF along with complementary foods for 2 years or longer.23 According to the parameters suggested by the WHO,24 the igures revealed by the present study are far from ideal.
Regarding EBF in children under 6 months, 23 capital cities
showed rates considered “fair” (prevalence between 12
and 49%), and only four (Belém, Campo Grande, Brasília,
and Florianópolis) were considered to have “good status”
(between 50 and 89%). In terms of BF duration, the status
is considered to be “poor” in most cases (median lower than 17 months) and only Macapá is classiied as having a “fair”
status (median between 18 and 20 months).
Although the BF status is far from ideal, the advances
made towards the expansion of the BF practice in Brazil is undeniable. Although the identiication of the factors that
led to this improvement goes beyond the scope of the
present study, for contextualization purposes, it is important to point out some changes in the socioeconomic proile of
the population and the development of the national policy
for BF, because these are factors that may have inluenced
this behavior.
Maternal educational level, identiied as an important
factor associated with BF practices,25 improved considerably
between 1999 and 2008, with an increase of 20.4 percentage points for mothers with educational level between 8 and 11 years.15
The role of policies and programs in the expansion of BF
practice has also been reported by several authors.16,20-22,24
In this sense, the following initiatives stand out in Brazil: the
expansion of the Brazilian Network of Human Milk Banks,
currently composed of 270 units, which recorded a 56% increase in milk collection between 2003 and 2008, 50%
more children beneited and double number of donors,
which now totals 113,00026; the expansion of the Baby-Friendly Hospital Initiative between 1999 and 2008, with
accreditation of 52 hospitals in 2002 and 43 in 200327;
advances related to the Brazilian Code of Marketingof Breast-milk Substitutes (Norma Brasileira de Comercialização de Alimentos para Lactentes e Crianças de Primeira Infância, Bicos, Chupetas e Mamadeiras - NBCAL), resulting from changes in that legislation implemented in 2002 and the creation of the Law 11,625, published in 2006, aimed at regulating the marketing and guidance of the appropriate use of food for children under 3 years28;and, inally, the
intense social mobilization triggered by the celebration of World Breastfeeding Weeks, and the implementation of the
References
1. Jones G, Steketee RW, Black RE, Bhutta ZA, Morris SS; Bellagio Child Survival Study Group. How many child deaths can we prevent this year? Lancet. 2003;362:65-71.
2. Edmond KM, Zandoh C, Quigley MA, Amenga-Etego S, Owusu-Agyei S, Kirkwood BR. Delayed breastfeeding initiation increases risk of neonatal mortality. Pediatrics. 2006;117:380-6. 3. Mullany LC, Katz J, Li YM, Khatry SK, LeClerq SC, Darmstadt GL, et al.
Breast-feeding patterns, time to initiation, and mortality risk among newborns in southern Nepal. J Nutr. 2008;138:599-603. 4. Rea MF. The Brazilian National Breastfeeding Program: a success
story. Int J Gynecol Obstet. 1990;31:79-82.
5. Venancio SI, Monteiro CA. A evolução da prática da amamentação nas décadas de 70 e 80. Rev Bras Epidemiol. 1998;1:40-9. 6. Sociedade Civil Bem-Estar Familiar no Brasil. Pesquisa Nacional
sobre Demograia e Saúde. Rio de Janeiro: BEMFAM; 1997. p.125-38.
7. Brasil. Ministério da Saúde. Pesquisa Nacional de Demograia e Saúde da Criança e da Mulher – PNDS 2006. Brasília: Ministério da Saúde; 2009. p.195-212.
8. Monteiro CA. O panorama da nutrição infantil nos anos 90. Brasília: UNICEF; 1997. (Cadernos de Políticas Sociais, Série Documentos para Discussão, v. 1).
9. Brasil. Ministério da Saúde. Prevalência de Aleitamento Materno nas Capitais Brasileiras e no Distrito Federal. Brasília: Ministério da Saúde; 2001.
10. Brasil. Ministério da Saúde. Secretaria de Atenção à Saúde. Departamento de Ações Programáticas e Estratégicas. II Pesquisa de Prevalência de Aleitamento Materno nas Capitais Brasileiras e Distrito Federal. Brasília: Editora do Ministério da Saúde, 2009. 11. Silva NN. Amostragem Probabilística: um curso introdutório. São
Paulo: EDUSP, 1998.
Correspondence: Sonia I. Venancio
Rua Santo Antônio, 590/5º andar - Bela Vista CEP 01314-000 - São Paulo, SP - Brazil Tel.: +55 (11) 3293.2278
Fax: +55 (11) 3105.2772 E-mail: [email protected]
12. World Health Organization. Indicators for assessing infant and young child feeding practices: conclusions of a consensus meeting held 6–8 November 2007 in Washington D.C., USA. Geneva: WHO; 2008.
13. Santos LM, Paes-Sousa R, Silva Junior JB, Victora CG. National Immunization Day: a strategy to monitor health and nutrition indicators. Bull World Health Organ. 2008;86:474-9.
14. Brasil. Ministério da Saúde. Sistema de informação do Programa Nacional de Imunizações. http://pni.datasus.gov.br. Access: 10/03/2010.
15. Brasil. Ministério da Saúde. Sistema de Informações sobre Nascidos Vivos – SINASC. Situação da base de dados nacional em 14/12/2009.
http://tabnet.datasus.gov.br/cgi/tabcgi.exe?sinascp/cnv/nvuf.
def. Access: 12/03/2010.
16. Rea MF. Relexões sobre a amamentação no Brasil: de como
passamos a 10 meses de duração. Cad Saude Publica. 2003;19 Suppl 1:S37-S45.
17. Brunken GS, Silva SM, França GV, Escuder MM, Venâncio SI. Risk
factors for early interruption of exclusive breastfeeding and late
introduction of complementary foods among infants in midwestern Brazil. J Pediatr (Rio J). 2006;82:445-51.
18. Ferreira L, Parada CM, Carvalhaes MA. Tendência do aleitamento materno em município da região centro-sul de estado de São Paulo: 1995-1999-2004. Rev Nutr. 2007;20:265-73.
19. Albernaz E, Araújo CL, Tomasi E, Mintem G, Giugliani E, Matijasevich A, et al. Inluence of breastfeeding support on the tendencies of
breastfeeding rates in the city of Pelotas (RS), Brazil, from 1982 to 2004. J Pediatr (Rio J). 2008;84:560-4.
20. Grummer-Strawn LM. The effect of changes in population
characteristics on breastfeeding trends in ifteen developing
countries. Int J Epidemiol. 1996;25:94-102.
21. Pérez-Escamilla R. Breastfeeding and the nutritional transition in the Latin American and Caribbean Region: a success story? Cad Saude Publica. 2003;19:S119-27.
22. Labbok MH, Wardlaw T, Blanc A, Clark D, Terreri N. Trends in
exclusive breastfeeding: indings from the 1990s. J Hum Lact. 2006;22:272-6.
23. World Health Organization. The optimal duration of exclusive breastfeeding. Note for the Press No 7. Geneva : WHO, 2001. 24. World Health Organization. Infant and Young Child Feeding: A
tool for assessing breastfeeding practices, policies and programs. Geneva: WHO; 2003.
25. Venancio SI, Monteiro CA. Individual and contextual determinants of exclusive breastfeeding in São Paulo, Brazil: a multilevel analysis. Public Health Nutr. 2006; 9:40-6.
26. FIOCRUZ. Rede de Bancos de Leite Humano. http://www.
redeblh.iocruz.br/cgi/cgilua.exe/sys/start.htm?sid=352. Access: 15/10/2009.
27. Brasil. Ministério da Saúde. A Iniciativa Hospital Amigo da Criança no Brasil: histórico, situação atual, ações e perspectivas.
http://portal.saude.gov.br/portal/saude/area.cfm?id_area=1460. Access: 15/10/2009.
28. de Fátima Moura de Araújo M, Rea MF, Pinheiro KA, de Abreu Soares Schmitz B. Avanços na norma brasileira de comercialização de alimentos para idade infantil. Rev Saude Publica. 2006;40:513-20.
29. Alencar SM. A Política Nacional de Aleitamento Materno. In: O aleitamento materno no contexto atual. Políticas, práticas e bases cientíicas. São Paulo: Sarvier; 2008. p. 70-101.
The analysis of the inluence of BF status in 1999 on
the behavior of the indicators in 2008 clearly showed that there was a higher increase in the capital cities that had a worse status in 1999 and, on the other hand, there were more discreet advances or even setbacks in places where the status was more favorable. The cities of Belém and
Fortaleza, for example, which in 1999 had the highest
medians of BF and EBF, respectively, not only did not show
any progress, but also had setbacks. This context evidences
the need for Brazil to invest in new strategies to encourage BF so that its indicators reach higher levels. Accordingly, in
2008 the Brazilian Ministry of Health launched the Brazilian
Breastfeeding Network (Rede Amamenta Brasil), aiming to promote and support BF in the primary health care network
of the country. This strategy ills a major gap, considering
the fact that the actions to stimulate BF are focused on hospital settings.
It is possible to conclude that there was a signiicant
improvement in the BF status in the last decade, considering all Brazilian capital cities, with persistent differences between
the regions and capital cities analyzed. However, there
is still need of a great effort so that Brazil can achieve
BF rates compatible with the WHO recommendations. We