ABSTRACT: Objectives: To investigate the prevalence and correlates of functional disability in elderly
people living in Ribeirão Preto, SP. Methods: This is a cross-sectional population-based epidemiological study with multistage sampling. Design efect was corrected using a weighted sample composed by 536 elderly people. Disability based on daily living activities dependence (outcome) was assessed by using a validated questionnaire for population-based epidemiological studies. Points and 95% conidence intervals estimated crude and stratiied prevalence rates of the outcome according to sociodemographic, behavioral, health-related, and self-reported morbidity variables. To identify the correlates, the crude and adjusted prevalence ratios were estimated using Poisson regression. Results: The crude prevalence of disability was 50.31%. In the multivariate models, after simultaneous intra-group adjustment (inal models), the following variables remained independently associated with the outcome: sociodemographic (age, education, and contribution to familiar income); behavioral (daily mean of sitting time); health-related factors (hypertension, ischemic heart disease, medicines taken, and low cognitive performance); and self-reported morbidity (number of diseases and low hearing performance). Conclusions: The high prevalence of disability among elderly people in Ribeirão Preto and the presence of modiiable variables impose the need for speciic health promotion and prevention measures, aiming a better quality of life for this population group, which is already well represented in the city’s most recent population pyramids.
Keywords: Disability. Correlates. Aging. Cross-sectional studies. Epidemiology. Public health.
The independent efect of chronic diseases,
sociodemographic and behavioral factors
related to disability in older people living in
Ribeirão Preto, SP, 2007 – The EPIDCV Project
Avaliação do efeito independente de doenças crônicas, fatores
sociodemográicos e comportamentais sobre a incapacidade funcional
em idosos residentes em Ribeirão Preto, SP, 2007 – Projeto EPIDCV
Suzana Alves de MoraesI, Daniele Almeida LopesII, Isabel Cristina Martins de FreitasIII
IDepartment of Maternal and Child Nursing and Public Health of the School of Nursing of Ribeirão Preto at Universidade de São Paulo – Ribeirão Preto (SP), Brasil.
IIGraduation Program in Nursing and Public Health of the School of Nursing of Ribeirão Preto at Universidade de São Paulo – Ribeirão Preto (SP), Brasil.
IIIPost-Doc Program at the Epidemiology Center – NEPI of the School of Nursing of Ribeirão Preto at Universidade de São Paulo – Ribeirão Preto (SP), Brasil.
Corresponding author: Suzana Alves de Moraes. Avenida Bandeirantes, 3900. Campus Universitário. CEP 14040-902. Ribeirão Preto, SP, Brasil. E-mail: [email protected]
Conlict of interests: nothing to declare – Financial support: The EPIDCV Projet was granted by Fundação de Amparo à Pesquisa do Estado de São Paulo (FAPESP) – Process no 2006/50495-2. Lopes DA – Graduate Scholarship–CAPES. Freitas ICM – Post-Doc
INTRODUCTION
The demographic and epidemiological transition includes modiications in patterns of health and disease over time, resulting primarily from changes in the age structure of the population. This led to relative population aging and the replacement of infectious diseases by chronic degenerative diseases and external causes, which currently are the main causes of mortality1.
With the increasing elderly population, functional capacity (FC) has emerged as a new concept of health, better suited to implement and perform health care of the elderly peo-ple, by relecting the impact of disease/disability on their quality of life2. Diferent authors
have identiied the associations between disability and demographic factors, behavioral and health-related factors, although, in most studies, sociodemographic factors such as age, edu-cation, and income, along with chronic diseases and comorbidities, have shown consistent associations with disability3-6.
Knowledge of the determinants of functional disability has been possible, thanks to epidemiological population-based studies. Although, in Brazil, these studies focus on the south and southeast regions and are limited largely to the capitals, little is known on the epidemiological reality of municipalities within the country. Considering that the factors associated with functional disability can undergo interactions with the envi-ronment, this study aimed to investigate the prevalence of functional disability in the
RESUMO:Objetivos: Investigar a prevalência e os fatores associados à incapacidade funcional em idosos residentes em Ribeirão Preto, SP, em 2007. Métodos: Estudo transversal de base populacional, com amostra complexa selecionada em três estágios. Para correção do efeito de desenho amostral, utilizou-se amostra ponderada (nw) de 536 idosos. A dependência funcional para atividades da vida diária foi aferida mediante a utilização de questionário estruturado e validado para estudos epidemiológicos de base populacional. Prevalências brutas do desfecho e estratiicadas segundo variáveis sociodemográicas, comportamentais, relacionadas à saúde e à morbidade referida foram calculadas por pontos e por intervalos com 95% de coniança. Razões de prevalências brutas e ajustadas foram estimadas por pontos e por intervalos, utilizando-se a regressão de Poisson. Resultados: A prevalência bruta de incapacidade foi 50,31%. Nos modelos multivariados, após ajustamento intragrupos (modelos inais), as seguintes variáveis permaneceram independentemente associadas ao desfecho: sociodemográicas (idade, escolaridade e contribuição com a renda familiar); comportamentais (média diária de tempo sentado); relacionadas à saúde (hipertensão, doença isquêmica do coração, uso de medicamentos e baixo desempenho cognitivo); morbidade referida (número de doenças referidas e baixa acuidade auditiva). Conclusão: A elevada prevalência de incapacidades em idosos de Ribeirão Preto, bem como a presença de associações entre variáveis potencialmente modiicáveis e o desfecho, impõe a necessidade de medidas especíicas de promoção e prevenção em saúde com vistas à melhora da qualidade de vida desse estrato populacional já bem representado nas últimas pirâmides populacionais do município.
elderly people living in Ribeirão Preto, SP, and identify the factors independently asso-ciated with this outcome.
MATERIAL AND METHODS
This cross-sectional study is nested in the EPIDCV Project (Prevalence of cardiovascu-lar diseases and identiication of associated factors in adults living in Ribeirão Preto, SP); it is an epidemiological, population-based study in which data collection was conducted in Ribeirão Preto during 2007/2008.
The sampling process was developed in three stages, and the accuracy of estimates calcu-lated on a sample of 1,205 individuals corresponded to sampling errors ixed around 2% (for prevalence below 15% or above 75%) and 3% (for prevalence between 20 and 80%). In the irst stage, 81 census tracts were drawn, and as a result, 1,672 households and 1,395 partici-pants were calculated, representing the second and third stages, respectively7. The response
rate was 82.1%, corresponding to 1,133 adult participants. To correct the sample design efect, the weighted sample (nw) of 2,471 participants aged 30 years or older, living in the
urban area of the municipality was used, among whom were identiied 536 elderly people. The details on the sampling process were previously published8.
DEPENDENT VARIABLE: FUNCTIONAL DISABILITY
For the assessment of functional disability, a structured and validated questionnaire9
containing 17 questions about the activities of daily living (ADLs), ranging from 0 to 34 points was used. For each ADL, the elderly people were classiied as fully indepen-dent (2 points), requiring partial assistance (1 point), or requiring total aid (0 points). Functional capacity was classiied into two categories (0/1), considering as reference (cate-gory 0), the one that corresponded to total independence of the elderly people (34 points), while the category 1 (functional disability) corresponded to the need for partial or total help for one or more ADLs.
INDEPENDENT VARIABLES
Sociodemographic variables
was classiied as: no income, ≤ 75% contribution, and > 75% contribution. The Economic Indicator of Ribeirão Preto (EIRP)10 was constructed, using variables related to the
acquisi-tion of consumer goods and educaacquisi-tion of the head of the family. The scores ranged between 67 and 1,086 points, and the variable was classiied into four categories, according to the cutof points deined by quartiles of the distribution.
Behavioral variables
Smoking deined according to pack-years was estimated by the formula: [(no. of cigarettes/day)/20 × no. of years smoking]11, and then classiied into three categories:
nonsmokers, ≤ 14 years of smoking 1 pack/day, and > 14 years smoking 1 pack/day, the last two classiied according to the cutof points established by the median of the distri-bution. Information on alcohol consumption were taken from the questionnaire Alcohol Use Disorder Identiication Test (AUDIT)12, considering two categories: without
depen-dence (sum of scores of 0 – 7) and with dependepen-dence (sum of scores ≥ 8). Daily mean of sitting time in minutes/day was calculated using the short version of the International Physical Activity Questionnaire (IPAQ) 13.
Health-related variables
Hypertension was deined as a history of the condition diagnosed by a physician, regu-lar use of antihypertensive medication, or the average of three consecutive measurements of blood pressure, assessed in portable sphygmomanometers (Geratherm, Medical AG, Geschwenda, Germany). Hypertensive patients presented measurements ≥ 140/90 mm Hg for the systolic and diastolic mean pressures, respectively14. Glucose intolerance was
deined as a history of diabetes diagnosed by a physician and by oral glucose tolerance tests (OGTT), performed after a 12-hour fasting and 2 hours after 75 g glucose overload. The glycemia (mg/dL) was measured in capillary blood by the relectance colorimetry method, using Accutrend portable devices (Roche Diagnostics GmbH, Mannheim, Germany), and for the deinition of glucose intolerance, cutofs recommended by WHO15 were adopted.
The variable was classiied dichotomously (no/yes); those with normal glucose tolerance were considered as the reference, while those with diabetes and impaired fasting glycemia or impaired glucose tolerance were considered exposed. Ischemic heart disease (IHD), classiied dichotomously (no/yes), was represented by the combination of angina and possible myo-cardial infarction, after application of the full version of the Rose questionnaire (Q-Rose)16.
from 0 to 30 and, for the purpose of this study were treated in a dichotomous way: > 25 (reference category) and ≤ 25, according to the median of the distribution. Nutritional sta-tus was classiied into three categories: eutrophic, overweight, and obese, according to the cutofs for body mass index (BMI), recommended by the World Health Organization18. The
weight in kilograms was measured in portable electronic scales from Tanita brand, model BF 680®, and height in stadiometers of SECA® brand. The measures were taken by trained
and calibrated interviewers who used the techniques proposed by Habicht and Butz19. The
conicity index (C index) was used as the central obesity index, deined according to the equa-tion below20 and classiied dichotomously, using the cutof point corresponding to the 25th
percentile. As reference for waist circumference, measured in centimeters (cm), the lesser curvature located between the costal margin and the iliac crest was considered, adopting speciic cutofs according to sex, recommended by the International Diabetes Federation21.
For weight, height, and waist circumference, three consecutive measurements were taken, considering the average of these three measurements.
body weight (Kg) height (meters) C index =
0,109 x
waist circumference (meters)
Morbidity-related variables
The number of diseases reported by the participants (arthritis, rheumatism or arthrosis, bron-chitis, constipation, cataracts and back problems—comorbidities) has been classiied into three categories (0 – 1, 2 – 3, and ≥ 4). Visual and hearing acuity were classiied as “excellent/good” or “fair/poor.” The self-reported health status was rated as “excellent/good” and “fair/poor.”
Data processing
Data collection was executed by applying a structured questionnaire in the eligible households by a staf of trained interviewers. Before the inal typing, processed with dou-ble data entry, quality control of the information was assessed by replicating 12.5% of the interviews. The reliability was estimated using Kappa statistics, which reached val-ues superior than 0.80.
Statistical analysis
disability, prevalence ratios were estimated by points and 95% conidence intervals, using the Poisson regression22. Firstly, univariate analyses were run, according to sociodemographic,
behavioral, and health- and morbidity related variables, excluding those that presented p-values > 0.25 for Wald statistics. In sequence, inal models were run and the variables with p-values < 0.05 for the Wald statistics were retained. All analyses were run using Stata 10.1. All esti-mates took into account the sample design efect (def ), using the Stata “svy” commands.
Ethical considerations
The EPIDCV Project was approved by the Ethics Research Committee of the School of Nursing of Ribeirão Preto, Universidade de São Paulo, and protocoled under no. 0725/2006. All the participants signed an informed consent, as per recommendations of the Resolution no. 196/96 of the National Health Council.
RESULTS
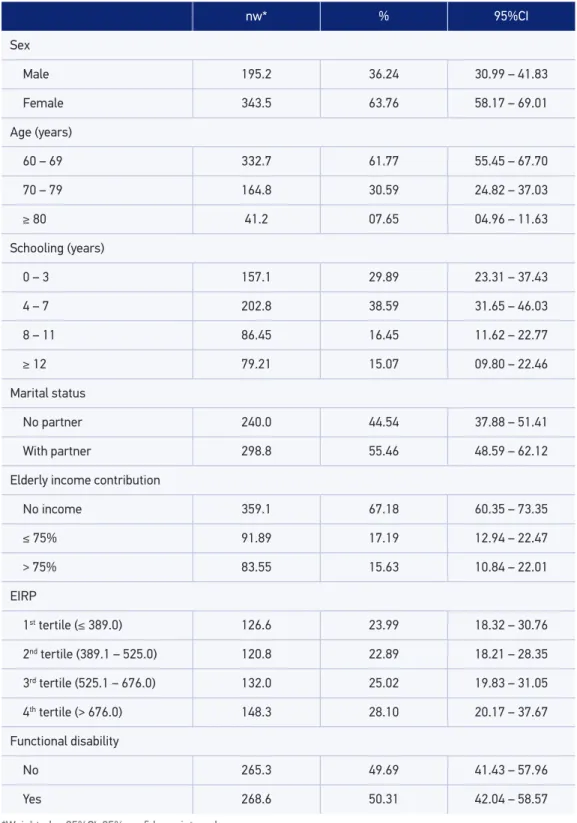
Table 1 shows that the sample was composed mainly by female participants; of those aged between 60 and 69 years; with schooling from 4 to 11 years; of those living with a partner, and those belonged to households classiied in the last two quartiles of IERP. The crude prevalence of functional disability was high, and the sampling design efect (def ) corresponded to 1.71848.
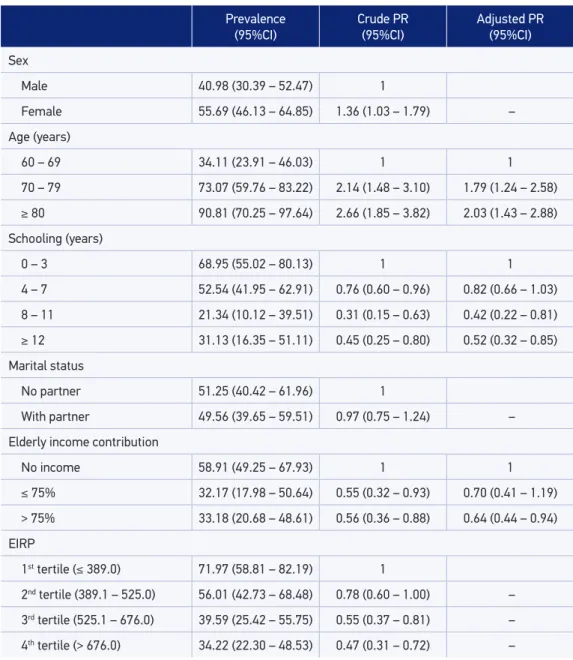
In relation to sociodemographic factors (Table 2), the prevalence of functional disability was directly related to age and inversely related to education and the EIRP quartiles. The adjusted prevalence ratios — age (direct relationship), schooling, and income contribution of the elderly on family income (inverse relationship), were independently associated with the outcome.
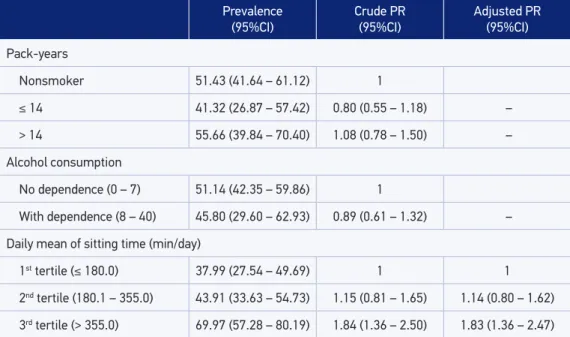
With respect to behavioral factors (Table 3), the outcome prevalence stood out among those who consumed 1 pack of cigarettes/day for more than 14 years and those with the highest daily mean of sitting time. The prevalence ratios for the variable “sitting time” had direct relation and independent association with the outcome (3rd tertile).
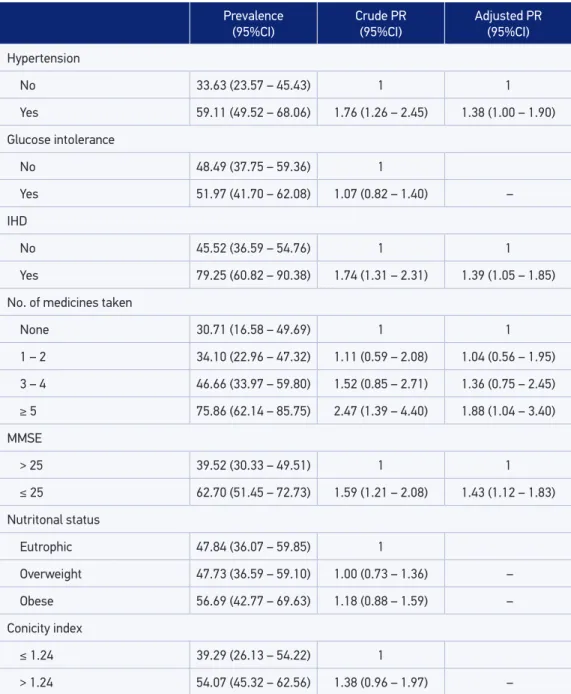
With regard to health-related factors (Table 4), the functional disability prevalence stood out among those who were hypertensive, classiied as IHD, those who consumed 5 or more medications in the last 15 days, and those who were classiied with low cognitive performance or showed global or central obesity. After simultaneous adjustment, arterial hypertension, IHD, number of medicines taken, and low cognitive performance remained independently associated with the outcome.
nw* % 95%CI
Sex
Male 195.2 36.24 30.99 – 41.83
Female 343.5 63.76 58.17 – 69.01
Age (years)
60 – 69 332.7 61.77 55.45 – 67.70
70 – 79 164.8 30.59 24.82 – 37.03
≥ 80 41.2 07.65 04.96 – 11.63
Schooling (years)
0 – 3 157.1 29.89 23.31 – 37.43
4 – 7 202.8 38.59 31.65 – 46.03
8 – 11 86.45 16.45 11.62 – 22.77
≥ 12 79.21 15.07 09.80 – 22.46
Marital status
No partner 240.0 44.54 37.88 – 51.41
With partner 298.8 55.46 48.59 – 62.12
Elderly income contribution
No income 359.1 67.18 60.35 – 73.35
≤ 75% 91.89 17.19 12.94 – 22.47
> 75% 83.55 15.63 10.84 – 22.01
EIRP
1st tertile (≤ 389.0) 126.6 23.99 18.32 – 30.76
2nd tertile (389.1 – 525.0) 120.8 22.89 18.21 – 28.35
3rd tertile (525.1 – 676.0) 132.0 25.02 19.83 – 31.05
4th tertile (> 676.0) 148.3 28.10 20.17 – 37.67
Functional disability
No 265.3 49.69 41.43 – 57.96
Yes 268.6 50.31 42.04 – 58.57
*Weighted n; 95%CI: 95% conidence interval.
Prevalence (95%CI)
Crude PR (95%CI)
Adjusted PR (95%CI)
Sex
Male 40.98 (30.39 – 52.47) 1
Female 55.69 (46.13 – 64.85) 1.36 (1.03 – 1.79) –
Age (years)
60 – 69 34.11 (23.91 – 46.03) 1 1
70 – 79 73.07 (59.76 – 83.22) 2.14 (1.48 – 3.10) 1.79 (1.24 – 2.58)
≥ 80 90.81 (70.25 – 97.64) 2.66 (1.85 – 3.82) 2.03 (1.43 – 2.88) Schooling (years)
0 – 3 68.95 (55.02 – 80.13) 1 1
4 – 7 52.54 (41.95 – 62.91) 0.76 (0.60 – 0.96) 0.82 (0.66 – 1.03)
8 – 11 21.34 (10.12 – 39.51) 0.31 (0.15 – 0.63) 0.42 (0.22 – 0.81)
≥ 12 31.13 (16.35 – 51.11) 0.45 (0.25 – 0.80) 0.52 (0.32 – 0.85)
Marital status
No partner 51.25 (40.42 – 61.96) 1
With partner 49.56 (39.65 – 59.51) 0.97 (0.75 – 1.24) –
Elderly income contribution
No income 58.91 (49.25 – 67.93) 1 1
≤ 75% 32.17 (17.98 – 50.64) 0.55 (0.32 – 0.93) 0.70 (0.41 – 1.19)
> 75% 33.18 (20.68 – 48.61) 0.56 (0.36 – 0.88) 0.64 (0.44 – 0.94)
EIRP
1st tertile (≤ 389.0) 71.97 (58.81 – 82.19) 1
2nd tertile (389.1 – 525.0) 56.01 (42.73 – 68.48) 0.78 (0.60 – 1.00) –
3rd tertile (525.1 – 676.0) 39.59 (25.42 – 55.75) 0.55 (0.37 – 0.81) –
4th tertile (> 676.0) 34.22 (22.30 – 48.53) 0.47 (0.31 – 0.72) –
PR: prevalence ratios; 95%CI: 95% conidence interval; (–) variables excluded from inal model (p > 0.05).
Table 2. Prevalence and crude and adjusted prevalence ratios according to sociodemographic factors (Ribeirão Preto, SP, Brazil, 2007, EPIDCV Project).
DISCUSSION
PR: prevalence ratios; IC95%: 95% conidence interval; (–) variables excluded from inal model (p > 0.05).
Table 3. Prevalence and crude and adjusted prevalence ratios according to behavioral factors (Ribeirão Preto, SP, Brazil, 2007, EPIDCV Project).
Prevalence (95%CI)
Crude PR (95%CI)
Adjusted PR (95%CI)
Pack-years
Nonsmoker 51.43 (41.64 – 61.12) 1
≤ 14 41.32 (26.87 – 57.42) 0.80 (0.55 – 1.18) –
> 14 55.66 (39.84 – 70.40) 1.08 (0.78 – 1.50) –
Alcohol consumption
No dependence (0 – 7) 51.14 (42.35 – 59.86) 1
With dependence (8 – 40) 45.80 (29.60 – 62.93) 0.89 (0.61 – 1.32) –
Daily mean of sitting time (min/day)
1st tertile (≤ 180.0) 37.99 (27.54 – 49.69) 1 1
2nd tertile (180.1 – 355.0) 43.91 (33.63 – 54.73) 1.15 (0.81 – 1.65) 1.14 (0.80 – 1.62)
3rd tertile (> 355.0) 69.97 (57.28 – 80.19) 1.84 (1.36 – 2.50) 1.83 (1.36 – 2.47)
and morbidity-related variables (number of reported diseases and hearing acuity) remained independently associated with the outcome.
These indings are consistent with the results from national studies3,4,6,23-29. Related
to international studies, the results of Ribeirão Preto are similar to those presented by Tze-Pin et al. 30 in a cross-sectional study carried out in multiethnic sample (Chinese,
Malay, and Indian). Moreover, the results are similar to the indings of the Rotterdam study5,31 and German KORA-age study25 and to results reported by Kelly-Hayes et al.32 in
the Framingham cohort.
The methodological rigor in conducting the sampling process of EPIDCV Project, the high response rate (82.1%), and the extensive training of interviewers, alongside with rel-evant statistical techniques for data analysis, strengthen the internal validity of the study.
In this work, the socioeconomic condition was determinant of functional dependence, as high levels of education and income remained associated with the outcome (protective fac-tors). These indings, conirmed by diferent authors24-26, are owing mainly to the increased
access to health services and information related to prevention of disabilities, such as the adoption of healthy habits that contribute to the preservation of autonomy.
Considering behavioral factors, consumption of alcohol and cigarettes did not remain associated with the outcome, as also observed in the Rotterdam study5 and in south of Brazil6.
PR: prevalence ratios; IHD: ischemic heart disease; MMSE: Mini Mental State Examination; IC95%: 95% conidence interval; (–) variables excluded from inal model (p > 0.05).
Table 4. Prevalence and crude and adjusted prevalence ratios according to health-related factors (Ribeirão Preto, SP, Brazil, 2007, EPIDCV Project).
Prevalence (95%CI)
Crude PR (95%CI)
Adjusted PR (95%CI)
Hypertension
No 33.63 (23.57 – 45.43) 1 1
Yes 59.11 (49.52 – 68.06) 1.76 (1.26 – 2.45) 1.38 (1.00 – 1.90)
Glucose intolerance
No 48.49 (37.75 – 59.36) 1
Yes 51.97 (41.70 – 62.08) 1.07 (0.82 – 1.40) –
IHD
No 45.52 (36.59 – 54.76) 1 1
Yes 79.25 (60.82 – 90.38) 1.74 (1.31 – 2.31) 1.39 (1.05 – 1.85)
No. of medicines taken
None 30.71 (16.58 – 49.69) 1 1
1 – 2 34.10 (22.96 – 47.32) 1.11 (0.59 – 2.08) 1.04 (0.56 – 1.95)
3 – 4 46.66 (33.97 – 59.80) 1.52 (0.85 – 2.71) 1.36 (0.75 – 2.45)
≥ 5 75.86 (62.14 – 85.75) 2.47 (1.39 – 4.40) 1.88 (1.04 – 3.40)
MMSE
> 25 39.52 (30.33 – 49.51) 1 1
≤ 25 62.70 (51.45 – 72.73) 1.59 (1.21 – 2.08) 1.43 (1.12 – 1.83)
Nutritonal status
Eutrophic 47.84 (36.07 – 59.85) 1
Overweight 47.73 (36.59 – 59.10) 1.00 (0.73 – 1.36) –
Obese 56.69 (42.77 – 69.63) 1.18 (0.88 – 1.59) –
Conicity index
≤ 1.24 39.29 (26.13 – 54.22) 1
> 1.24 54.07 (45.32 – 62.56) 1.38 (0.96 – 1.97) –
time contributes to excessive weight, decreased muscle strength, joint stifness, increased cholesterol levels, insulin resistance, and the occurrence of cardiovascular diseases27 that
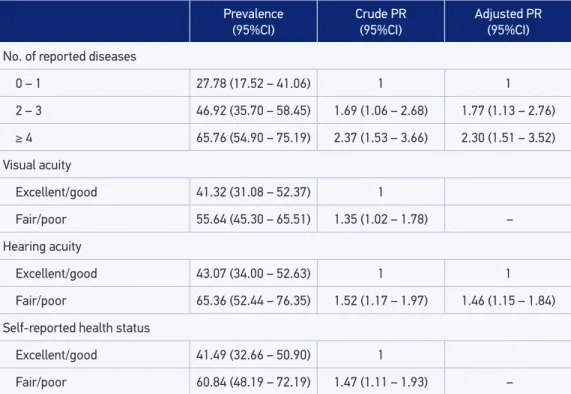
Table 5. Prevalence and crude and adjusted prevalence ratios according to self-reported morbidity (Ribeirão Preto, SP, Brazil, 2007, EPIDCV Project).
PR: prevalence ratios; 95%CI: 95% conidence interval; (–) variables excluded from inal model (p > 0.05).
Prevalence (95%CI)
Crude PR (95%CI)
Adjusted PR (95%CI)
No. of reported diseases
0 – 1 27.78 (17.52 – 41.06) 1 1
2 – 3 46.92 (35.70 – 58.45) 1.69 (1.06 – 2.68) 1.77 (1.13 – 2.76)
≥ 4 65.76 (54.90 – 75.19) 2.37 (1.53 – 3.66) 2.30 (1.51 – 3.52)
Visual acuity
Excellent/good 41.32 (31.08 – 52.37) 1
Fair/poor 55.64 (45.30 – 65.51) 1.35 (1.02 – 1.78) –
Hearing acuity
Excellent/good 43.07 (34.00 – 52.63) 1 1
Fair/poor 65.36 (52.44 – 76.35) 1.52 (1.17 – 1.97) 1.46 (1.15 – 1.84)
Self-reported health status
Excellent/good 41.49 (32.66 – 50.90) 1
Fair/poor 60.84 (48.19 – 72.19) 1.47 (1.11 – 1.93) –
Regarding health-related factors, the indings for the independent efect of hypertension and IHD on disability were consistent with those reported by Alves et al.3 in a cross-sectional
study conducted in São Paulo with data from the SABE Project. Symptoms of high blood pressure, such as fatigue, palpitations, tingling in arms and legs, headache, and blurred vision, afect the performance of daily activities. Furthermore, hypertension, if not controlled, is one of the most potent risk factors for coronary disease8 and strokes whose sequelae
hin-der the individual to perform the usual activities.
Still regarding the variables related to health, adjusted prevalence ratios revealed that low cognitive performance was positively associated with functional disability, which was corrob-orated by other authors33,34. Boult et al.33 constructed a simulation model for the development
of functional disability in noninstitutionalized US population, based on the Longitudinal Study of Aging for the period between 2001 and 2049. In the inal model, age, strokes, diabe-tes, arthritis, and frequent episodes of mental confusion remained independently associated with the risk of disability. Forecast analyses have identiied that, during the period in ques-tion, a reduction of only 1% in every 2 years in the prevalence of these events would enable a signiicant increase in the number of elderly people free of functional disability.
Similar results to this study were also found by Giacomin et al.28 in Bambuí Project, MG,
and Nunes et al.29 in a cross-sectional study conducted with elderly of Ubá, MG. High
con-sumption of medications relects poor health status and the presence of comorbidities that, together, impair the functional autonomy. Moreover, excess of medications can contribute to the prolonged sedation, increasing risk of falls and fractures and, thus, interfering with the ADLs.
It is important to mention that, although obesity and abdominal fat accumulation hin-der the realization of some ADLs such as dressing up, lying down, getting up from the bed, and climbing stairs, among others, nutritional status and the conicity index did not remain in the inal model. Potent efects of other chronic diseases such as hypertension, IHD, and comorbidities on functional disability may have removed the independent efect of global and central obesity on the outcome.
Regarding comorbidities, expressed by the number of reported diseases, there was a linear gradient indication of the outcome prevalence in their categories, as well as in the respective adjusted prevalence ratios, which was corroborated by Santos et al.26 in the south
of Brazil, who identiied that the category corresponding to the highest number of these diseases remained positively and independently associated with functional disability.
Regarding the hearing acuity, results similar to those of this study were reported by Nourhashémi et al.34 and Odding et al.31 in cross-sectional studies conducted in France
and the Netherlands, respectively, in which hearing impairment was positively and inde-pendently associated with functional disability. A plausible hypothesis for these indings may be based on the progressive loss of social interaction, isolation, and lack of motivation for recreational and social activities which, together, may contribute to the deterioration of functional independence.
In short, the indings of this study reproduced the results of national and international studies, with cross-sectional or cohort designs, which enhances their coherence and con-sistency. In addition, it is conirmed, in Ribeirão Preto, the advent of the ifth stage of the epidemiological transition postulated by Omran1, called “paradoxical longevity.” He says
that the decline in mortality and fertility rates would result in increased survival, with con-sequent accumulation of chronic diseases and disability resulting from them.
Limitations inherent in the cross-sectional design can be exempliied by the lack of asso-ciations, related to the outcome, of exposures such as the tobacco load, expressed by the pack-years indicator, or alcohol dependence. It is plausible to assume that functional lim-itations may have contributed to the control of these exposures (reverse causality bias). Another limitation refers to the impossibility of stratifying models by gender, considering the loss of statistical power inherent to the sample dilution into the strata. However, test-ing for interaction between sex and other variables that remained in the inal models were not statistically signiicant in relation to the outcome (p > 0.05).
Finally, it is considered appropriate to emphasize that ongoing studies, with data from EPIDCV Project in which multilevel structural equation models35 are being applied,
the outcome in question, elucidating relationships that still remain unclear, from the use of classical multivariate models.
CONCLUSION
The high prevalence of functional disability in the elderly people of Ribeirão Preto and the presence of associations between potentially modiiable variables and the outcome impose the need for speciic measures of health promotion and prevention that result in improved quality of life for seniors, the stratum that is already well represented in the last population pyramids of the municipality36.
1. Omran AR. The epidemiologic transition in the Americas. PAHO, Washington: The University of Maryland; 1996. p.188.
2. Organização Mundial da Saúde (OMS). CIF: Classiicação Internacional de Funcionalidade, Incapacidade e Saúde [Centro Colaborador da Organização Mundial da Saúde para a Família de Classiicações Internacionais, org.; coordenação da tradução Cassia Maria Buchalla]. São Paulo: Editora da Universidade de São Paulo – EDUSP; 2001.
3. Alves LC, Leimann BCQ, Vasconcelos MEL, Carvalho MS, Vasconcelos AGG, Fonseca TCO, et al. A inluência das doenças crônicas na capacidade funcional dos idosos do município de São Paulo, Brasil. Cad Saúde Pública. 2007;23(8):1924-30.
4. Melzer D, Parahyba MI. Socio-demog raphic correlates of mobility disability in older Brazilians: results of the first national survey. Age Ageing. 2004;33(3):253-9.
5. Tas U, Verhagen AP, Bierma-Zeinstra SMA, Hofman A, Odding E, Pols HAP, et al. Incidence and risk factors of disability in the elderly: The Rotterdam Study. Prev Med. 2007;44(3):272-8.
6. Pereira GN, Del Duca GF, Bastos GAN. Indicadores de saúde associados à incapacidade funcional em idosos de baixa renda. Geriatr & Gerontol. 2011;5(2):66-73.
7. Silva NN. Amostragem probabilística: um curso introdutório. 2a ed. São Paulo: EDUSP; 2001.
8. Moraes SA, Freitas ICM. Doença isquêmica do coração e fatores associados em adultos de Ribeirão Preto, SP. Rev Saúde Pública. 2012;46:591-601.
9. Lebrão MA, Duarte YAO. SABE - Saúde, Bem-Estar e Envelhecimento - O Projeto SABE no município de São
Paulo: uma abordagem inicial. Brasília: Organização Pan-Americana de Saúde; 2003.
10. Freitas ICM, Moraes SA. Peril econômico da população de Ribeirão Preto: aplicação do Indicador Econômico Nacional. Rev Saúde Pública. 2010;44(6):1150-4.
11. National Cancer Institute (NCI) at the National Institutes of Health. NCI Dictionary of Cancer Terms. Disponível em: < http://www.cancer.gov/ dictionary?cdrid=306510>. Acesso em: 13 nov 2013.
12. Organización Mundial de la Salud (OMS). Cuestionario de identiicación de los transtornos debidos al consumo de alcohol – AUDIT, 2001.
13. Craig C, Marshall A, Sjostrom M, Bauman AE, Booth ML, Pratt M, et al. International Physical Questionnaire: 12-country reliability and validity. Med Sci Sports Exercise. 2003;35:1381-95.
14. Moraes SA, Szklo M, Knopman D, Sato R. The relationship between temporal changes in blood pressure and changes in cognitive function: Atherosclerosis Risk in Communities (ARIC) Study. Prev Med. 2002;35(3):258-63.
15. World Health Organization (WHO). Deinition, diagnosis and classiication of diabetes mellitus and its complications: report of a WHO Consultation. Geneva: WHO; 1999.
16. Rose GA. The diagnosis of ischaemic heart pain and intermittent claudication in ield surveys. Bull World Health Organ. 1962; 27: 645-58.
17. Folstein MF, Folstein SE, McHugh PR. Mini Mental State. A practical method for grading the cognitive state of patients for the clinician. J Psychiatr Res. 1975;12(3):189-98.
18. World Health Organization (WHO). Obesity: preventing and managing the global epidemic: Report of a WHO Consultation. Geneva: WHO; 2000.
19. Habicht JP, Butz WP. Measurement of health and nutrition efects of large-scale nutrition intervention projects. In: Klein RE. Evaluation of the impact of nutrition and health programs. New York: Plenum Press; 1979. p. 133-89.
20. Valdez R. A simple model-based index of abdominal adiposity. J Clin Epidemiol. 1991;44(9):955-6.
21. Alberti G, Zimmet P, Shaw J, Grundy SM. Metabolic syndrome. The IDF consensus worldwide deinition of the metabolic syndrome. Brussels: International Diabetes Federation; 2006.
22. Barros AJ, Hirakata VN. Alternatives for logistic regression in cross-sectional studies: An empirical comparison of models that directelly estimate the prevalence ratios. BMC Med Res Methodol. 2003;3:21.
23. Rosa TEC, Benício MHD, Latorre MRDO, Ramos LR. Fatores determinantes da capacidade funcional entre idosos. Rev Saúde Pública. 2003;37(1):40-8.
24. Wu Y, Huang H, Wu B, McCrone S, Lai HJ. Age distribution and risk factors for the onset of severe disability among community-dwelling older adults with functional limitations. J App Gerontol. 2007;26(3):258-73.
25. Strobl R, Muller M, Emeny R, Peters A, Grill E. Distribution and determinants of functioning in aged adults – results from the German KORA-Age study. BMC Public Health. 2013; 13(137):1-10.
26. Santos KA, Koszuoski R, Dias-da-Costa JS, Pattussi MP. Fatores associados com a incapacidade funcional em idosos do município de Guatambu, Santa Catarina, Brasil. Cad Saúde Pública. 2007; 23(11):2781-88.
27. Duarte YAO, Paes MJO, Lebrão ML, Santos JLF, Laurenti R. Impacto do sedentarismo na incidência de doenças crônicas e incapacidades e na ocorrência de óbitos entre os idosos do Município de São Paulo. Cad Saúde Coletiva. 2008;5(24):183-88.
28. Giacomin KC, Uchôa E, Firmo JOA, Lima-Costa MF. Projeto Bambuí: um estudo de base populacional da prevalência e dos fatores associados à necessidade
de cuidador entre idosos. Cad Saúde Pública. 2005;21(1):80-91.
29. Nunes MCR, Ribeiro RCL, Rosado LEPL, Franceschini SC. Inluência das características sociodemográicas e epidemiológicas na capacidade funcional de idosos residentes em Ubá, Minas Gerais. Rev Bras Fisioter. 2009;13(5):376-82.
30. Tze-Pin N, Niti M, Chiam PC, Kua EH. Prevalence and correlates of functional disability in multiethnic elderly singaporeans. J Am Geriatr Soc. 2006;54(1):21-9.
31. Odding E, Valkenburg HA, Stam HJ, Hofman A. Determinants of locomotor disability in people aged 55 years and over: The Rotterdam study. Eur J Epidemiol. 2001;17(11):1033-41.
32. Kelly-Hayes M, Jette AM, Wolf PA, D’Agostino RB, Odell PM. Functional limitations and disability among elders in the Framingham Study. Am J Public Health. 1992;82(6):841-5.
33. Boult C, Altmann M, Gilbertson D, Yu C, Kane RL. Decreasing disability in the 21st century: the future efects of controlling six fatal and nonfatal conditions. Am J Public Health. 1996;86(10):1388-93.
34. Nourhashémi F, Andrieu S, Gillette-Guyonnet S, Vellas B, Albarède JL, Grandjean H. Instrumental Activities of Daily Living as a Potential Marker of Frailty: A Study of 7364 Community-Dwelling Elderly Women (the EPIDOS Study). J Gerontol A Biol Sci Med Sci. 2001;56(7):M448-53.
35. Raykov T, Marcoulides GA. A First Course in Structural Equation Modeling. London: Lawrence Erlbaum Associates, Publishers; 2006.
36. Fundação Sistema Estadual de Análise de Dados - SEADE. Portal de Estatísticas do Estado de São Paulo - Projeções Populacionais. Disponível em: produtos. ceade.gov.br/produtos/projpop/índex.php. Acesso em: 21 nov 2014.