Gender Differences in Health Expectancies
across the Disablement Process among Older
Thais
Benjawan Apinonkul1*, Kusol Soonthorndhada1, Patama Vapattanawong1, Wichai Aekplakorn2, Carol Jagger3
1Institute for Population and Social Research, Mahidol University, Salaya, Phutthamonthon, NakhonPathom, Thailand,2Department of Community Medicine, Faculty of Medicine, Ramathibodi Hospital, Mahidol University, Bangkok, Thailand,3Newcastle University Institute for Ageing and Institute of Health and Society, Newcastle University, Newcastle upon Tyne, United Kingdom
Abstract
Objectives
To estimate health expectancies based on measures that more fully cover the stages in the disablement process for the older Thais and examine gender differences in these
health expectancies.
Methods
Health expectancies by genders using Sullivan’s method were computed from the fourth Thai National Health Examination Survey conducted in 2009. A total of 9,210 participants aged 60 years and older were included in the analysis. Health measures included chronic diseases; cognitive impairment; depression; disability in instrumental activities of daily living (IADL); and disability in activities of daily living (ADL).
Results
The average number of years lived with and without morbidity and disability as measured by multiple dimensions of health varied and gender differences were not consistent across measures. At age 60, males could expect to live the most years on average free of depres-sion (18.6 years) and ADL disability (18.6 years) and the least years free of chronic dis-eases (9.1 years). Females, on the contrary, could expect to live the most years free of ADL disability (21.7 years) and the least years free of IADL disability (8.1 years), and they consis-tently spent more years with all forms of morbidity and disability. Finally, and for both gen-ders, years lived with cognitive impairment, depression and ADL disability were almost constant with increasing age.
OPEN ACCESS
Citation:Apinonkul B, Soonthorndhada K, Vapattanawong P, Aekplakorn W, Jagger C (2015) Gender Differences in Health Expectancies across the Disablement Process among Older Thais. PLoS ONE 10(3): e0121310. doi:10.1371/journal. pone.0121310
Academic Editor:Dirce Maria Trevisan Zanetta, School of Public Health of University of São Paulo, BRAZIL
Received:August 11, 2014
Accepted:January 30, 2015
Published:March 23, 2015
Copyright:© 2015 Apinonkul et al. This is an open access article distributed under the terms of the
Creative Commons Attribution License, which permits unrestricted use, distribution, and reproduction in any medium, provided the original author and source are credited.
Conclusion
This study adds knowledge of gender differences in healthy life expectancy in the older Thai population using a wider spectrum of health which provides useful information to diverse policy audiences.
Introduction
During the last three decades of the twentieth century Thailand’s population has aged as a
re-sult of the demographic transition from levels of high to low mortality and fertility [1]. In 1970
older people formed only five percent of the total population [2], but by 2014 this had risen to
15 percent [3] and is projected to reach 32 percent by 2040 [4]. As a consequence of falling
mortality, life expectancy at birth of the Thai population has risen continuously, from 60 years
in 1967 [1] to 71 years for males and 78 years for females in 2014 [3]. Thai life expectancy at
birth now ranks the fourth highest for males and the third highest for females in the ten
Associ-ation of Southeast Asian NAssoci-ations (ASEAN) countries [5]. Moreover projections estimate that
Thai life expectancy at birth will reach 75 years for males and 82 years for females by 2040 [4].
Longer life expectancy and the concomitant increase in the occurrence of non-communica-ble diseases have raised a question of the quality of years lived. Health expectancy is an index of population health, representing the increasing focus on quality of life lived rather than on the
quantity as measured by life expectancy [6,7]. Health expectancy combines information on
mortality from life tables with epidemiologic data on morbidity and disability prevalence [7]. It
is composed of estimated lengths of time spent in different health states until death [8].
Basically, health expectancies are the combination of life expectancy with health concepts,
which make it possible to calculate years lived in different states of health [6,8]. One of the
most appropriate frameworks to elucidate more detailed health measures for the older
popula-tion is the disablement process [9]. Models of the disablement process identify pathologies or
diseases as the earliest event, leading to dysfunctions in body systems (physical or mental), re-striction in physical or mental actions, and finally limitations in doing activities in any domain
of life [9]. Along this pathway, there are personal factors (e.g. lifestyle and behaviour changes,
activity accommodation) and factors external to the individuals (e.g. medical care and rehabili-tation, environmental factors) operating to alter the passage between stages. Though this
model is more‘linear’, it is in concordance with the World Health Organization International
Classification of Functioning, disability and Health (ICF) [10].
Health expectancies have been computed for a number of countries based on several health
measures [8,11]. Most studies in Asian countries have concentrated on disability rather than
earlier stages in the chain of disablement process and on a single health measure [11]. In
Thai-land estimates have been made of years with self-care disability [13–15], mobility disability
[15], and in different states of perceived health [16] at older ages with results varying by the
measure used and the time period of the study. Regardless of the underlying health measure, gender differences in the Thai population have consistently shown longer life but more years in poor health for females than males.
Nevertheless, estimates of health expectancies which cover the spectrum of the disablement process remain unknown, particularly for the Thai population. Estimates of health expectancy
in different states of health are useful for diverse policy audiences [17] and further, could
pro-vide information on the passage between health stages along the disablement pathway. This study therefore uses the most recent Thai national data from 2009 to estimate health
Ministry of Public Health (Address Bureau of Policy and Strategy, Office of Permanent Secretary, Ministry of Public Health, Tiwanon Road, Amphoe Mueang Nonthaburi, Nonthaburi, Thailand 11000; Tel (66) 25901000; Fax (66)25901174;http://bps.moph.go.th/ contact).
Funding:This research was financially supported from the Thailand Research Fund through the Royal Golden Jubilee Ph.D. Program (Grant No. PHD/0083/ 2553) to BA and KS. The funder website is (http://rgj. trf.or.th). The funders had no role in study design, data collection and analysis, decision to publish, or preparation of the manuscript.
expectancies that more fully cover the stages in the disablement process. More specifically the study estimates years of life at older ages with: chronic diseases; cognitive impairment; depres-sion; disability in instrumental activities of daily living (IADL); and disability in activities of daily living (ADL), and examines gender differences in these health expectancies.
Materials and Methods
Data
Data on morbidity and disability were drawn from the fourth Thai National Health Examina-tion Survey (NHES IV) in 2009. The NHES IV is a cross-secExamina-tional survey using stratified multi-stage sampling of the Thai population to yield nationally representative samples. The
sampling method has been described elsewhere [18]. Briefly, the first stage of sampling was
sys-tematic selection of five provinces in each of the four regions. In the second stage, three to five districts were randomly selected for each selected province and Bangkok. The third stage
in-volved systematic selection of 13–14 electoral units in municipality areas or villages in
non-mu-nicipal areas for each district. The final stage comprised random selection of individuals aged 15 years and older by selected electoral units and villages, gender, and age group. Finally, a total of 20,450 individuals were obtained. The present study focused on 9,210 participants aged 60 years and older (95% response rate). Information on participants was collected through a variety of methods, including a face-to-face interview, functional tests, physical examinations, and laboratory tests with data quality assured by training before and supervision during field-work, as well as rigorous data checking. The NHES IV was approved by the Ethical Review Committee for Research in Human Subjects, Ministry of Public Health. And, all participants provided written informed consent.
Mortality data was drawn from the Thai vital registration system, this being the most im-portant source of mortality data. Every vital event (births and deaths) is mandated by civil reg-istration law to be registered at the district offices or municipality registrars. At the end of each year, counts are made of the number of births and deaths (and thereby the total population), and these figures are made publicly available.
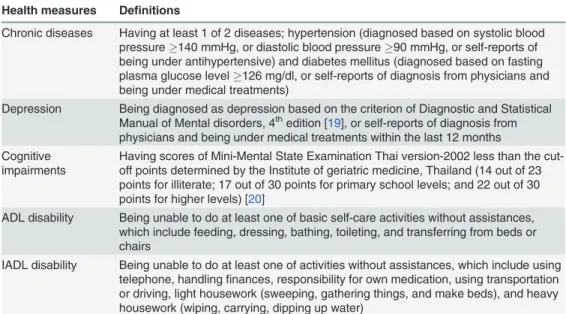
Health measures
The measures on which health expectancies were based included chronic diseases, cognitive impairment, depression, and disability in IADL and ADL. Full definitions are provided in
Table 1.
Statistical methods
Health expectancies were calculated by Sullivan’s method [21,22] which applies the age- and
sex-specific prevalence of health to divide the number of person years lived in the given age in-terval (from a period life table) into years lived with and without health problems. Health
ex-pectancy calculated by Sullivan’s method is the average number of remaining years, at
particular age, which an individual can expect to live healthy.
The first step was to calculate the period life tables, for men and women, from the age-spe-cific death rates which required some adjustment in (i) the number of deaths (for unknown age of death and under-registration) and (ii) the age-specific death rates for the very old. Overall
and age-specific percent completeness of death registration obtained from other reports [23–
25] was applied as correction factors. The Coale-Kisker method [26] was employed to estimate
calculated directly. This method assumes the declining rate of increase in mortality rates at very old ages.
As health expectancies are subject to sampling variation from the health surveys, we calcu-lated variance and used z-statistics to test gender differences in health expectancies following
established methods [21].
Results
Participants aged 60 years and older in the NHES IV were a slight majority of females (51%). The mean age of participants was 69.4 years (SD = 6.9) for males and 69.6 years (SD = 7.1) for females, respectively.
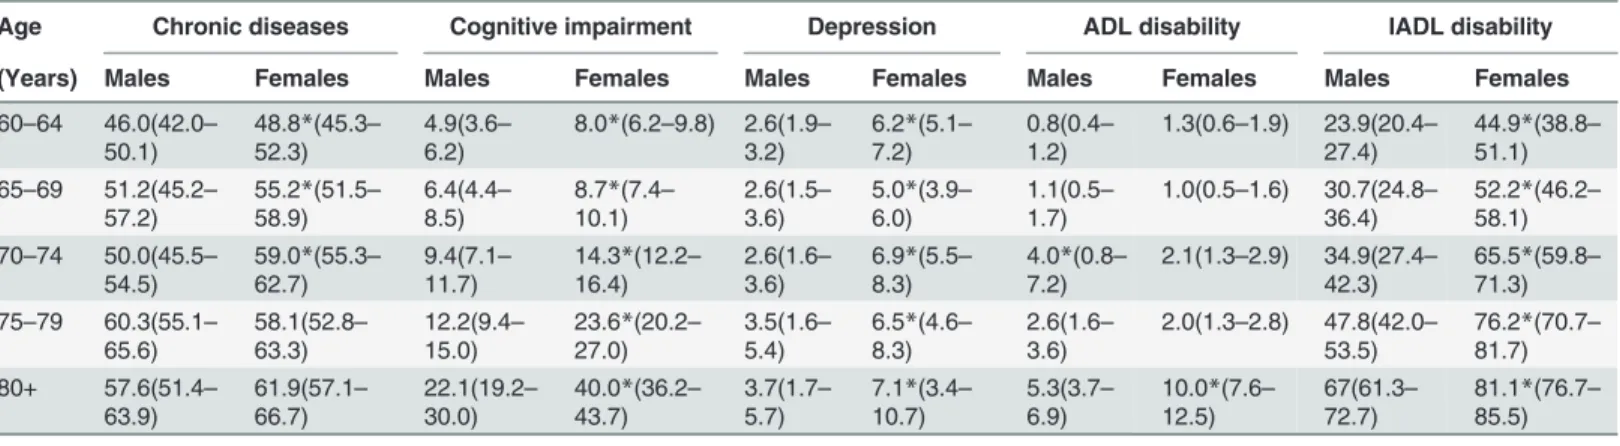
Prevalence of morbidity and disability
Table 2presents the age- and sex-specific prevalence of morbidity and disability, as measured by each health state, for the Thai population aged 60 years and over in 2009. Overall, females had a higher prevalence of morbidity and disability compared to males of the same age. The prevalence of all ill-health states tended to increase with age in both genders. Most noticeable is that the prevalence of cognitive impairment and depression in females was almost twice that in
males (Table 2).
Life and health expectancy
At age 60, males and females could expect to live on average a further 19.1 and 22.6 years,
re-spectively (Table 3). Females had longer total life expectancy than males at every age, with the
gaps between females and males ranging from 3.5 years at age 60 to 1.5 years at age 80. At age 60, males could expect to live the most years on average free of depression (18.6
years, 95%CI 18.5–18.7) and ADL disability (18.6 years, 95%CI 18.5–18.7) and the least
num-ber of years free of chronic diseases (9.1 years, 95%CI 8.8–9.4 years) (Table 3). In contrast
fe-males of the same age could expect to live the most years free of ADL disability (21.7 years,
95%CI 21.6–22.0) and least free of IADL disability (8.1 years, 95%CI 7.8–8.4).
Table 1. Definitions of health measures.
Health measures Definitions
Chronic diseases Having at least 1 of 2 diseases; hypertension (diagnosed based on systolic blood pressure140 mmHg, or diastolic blood pressure90 mmHg, or self-reports of being under antihypertensive) and diabetes mellitus (diagnosed based on fasting plasma glucose level126 mg/dl, or self-reports of diagnosis from physicians and being under medical treatments)
Depression Being diagnosed as depression based on the criterion of Diagnostic and Statistical Manual of Mental disorders, 4thedition [19], or self-reports of diagnosis from
physicians and being under medical treatments within the last 12 months Cognitive
impairments
Having scores of Mini-Mental State Examination Thai version-2002 less than the cut-off points determined by the Institute of geriatric medicine, Thailand (14 out of 23 points for illiterate; 17 out of 30 points for primary school levels; and 22 out of 30 points for higher levels) [20]
ADL disability Being unable to do at least one of basic self-care activities without assistances, which include feeding, dressing, bathing, toileting, and transferring from beds or chairs
IADL disability Being unable to do at least one of activities without assistances, which include using telephone, handlingfinances, responsibility for own medication, using transportation or driving, light housework (sweeping, gathering things, and make beds), and heavy housework (wiping, carrying, dipping up water)
Table 2. Prevalencea(in percent) of morbidity and disability by age and genders in Thailand, 2009 (95% CIs in parentheses).
Age Chronic diseases Cognitive impairment Depression ADL disability IADL disability
(Years) Males Females Males Females Males Females Males Females Males Females
60–64 46.0(42.0–
50.1)
48.8*(45.3–
52.3)
4.9(3.6–
6.2)
8.0*(6.2–9.8) 2.6(1.9–
3.2)
6.2*(5.1–
7.2)
0.8(0.4–
1.2)
1.3(0.6–1.9) 23.9(20.4–
27.4)
44.9*(38.8–
51.1) 65–69 51.2(45.2–
57.2)
55.2*(51.5–
58.9)
6.4(4.4–
8.5)
8.7*(7.4–
10.1)
2.6(1.5–
3.6)
5.0*(3.9–
6.0)
1.1(0.5–
1.7)
1.0(0.5–1.6) 30.7(24.8–
36.4)
52.2*(46.2–
58.1) 70–74 50.0(45.5–
54.5)
59.0*(55.3–
62.7)
9.4(7.1–
11.7)
14.3*(12.2–
16.4)
2.6(1.6–
3.6)
6.9*(5.5–
8.3)
4.0*(0.8–
7.2)
2.1(1.3–2.9) 34.9(27.4–
42.3)
65.5*(59.8–
71.3) 75–79 60.3(55.1–
65.6)
58.1(52.8–
63.3)
12.2(9.4–
15.0)
23.6*(20.2–
27.0)
3.5(1.6–
5.4)
6.5*(4.6–
8.3)
2.6(1.6–
3.6)
2.0(1.3–2.8) 47.8(42.0–
53.5)
76.2*(70.7–
81.7) 80+ 57.6(51.4–
63.9)
61.9(57.1–
66.7)
22.1(19.2–
30.0)
40.0*(36.2–
43.7)
3.7(1.7–
5.7)
7.1*(3.4–
10.7)
5.3(3.7–
6.9)
10.0*(7.6–
12.5)
67(61.3–
72.7)
81.1*(76.7–
85.5)
aWith sampling weighted
*Significantly higher than the other gender (two-proportion z-test, p<0.05)
Source: Author’s computations from the NHES IV.
doi:10.1371/journal.pone.0121310.t002
Table 3. Total life expectancy and number of years lived free of morbidity and disability at age 60, 70, and 80 by genders in Thailand, 2009.
Males Females
Age 60
Total life expectancy 19.1 22.6
Years lived free of (95%CI)
Chronic diseases 9.1 (8.8–9.4) 9.8 (9.4–10.1)*
Cognitive impairment 17.1 (16.9–17.3) 18.1 (17.8–18.4)*
Depression 18.6 (18.5–18.7) 21.1 (21.0–21.3)*
ADL disability 18.6 (18.5–18.7) 21.7 (21.6–22.0)*
IADL disability 11.6 (11.3–11.8)* 8.1 (7.8–8.4)
Age 70
Total life expectancy 12.9 15.3
Years lived free of (95%CI)
Chronic diseases 5.7 (5.4–6.0) 6.1 (5.8–6.5)
Cognitive impairment 11.0 (10.8–11.2) 11.0 (10.7–11.4)
Depression 12.5 (12.4–12.6) 14.3 (14.1–14.5)*
ADL disability 12.4 (12.3–12.5) 14.5 (14.3–14.6)*
IADL disability 6.4 (6.1–6.7)* 3.8 (3.5–4.1)
Age 80
Total life expectancy 8.6 10.1
Years lived free of (95%CI)
Chronic diseases 3.6 (3.3–4.0) 3.8 (3.4–4.3)
Cognitive impairment 6.7(6.4–7.0)* 6.1 (5.6–6.5)
Depression 8.3 (8.1–8.4) 9.4 (9.1–9.6)*
ADL disability 8.1 (8.0–8.3) 9.1 (8.8–9.3)*
IADL disability 2.8 (2.5–3.2)* 1.9 (1.6–2.3)
*Significantly higher than the other gender at 95% confidence intervals.
In terms of gender differences in years free of health problems, patterns were inconsistent.
At age 60 females lived significantly more years than males free of chronic diseases (p<0.05),
cognitive impairment (p<0.001), depression (p<0.001) and ADL disability (p<0.001) but
males lived significantly longer free of IADL disability (p<0.001). At ages 70 and 80 female
ad-vantages in years lived free of depression, ADL disability and male adad-vantages in years free of IADL disability remained significant. However, by age 80 males lived significantly longer free
of cognitive impairment (p<0.05) (Table 3).
Fig. 1illustrates the total life expectancy and life expectancy spent with morbidity and dis-ability measured by each health state by age and gender. Years lived with cognitive impairment, depression and ADL disability were remarkably constant across age though in all cases the number of years lived by females were larger than those for males, and for cognitive im-pairment, females spent twice as many years with cognitive impairment as males. For chronic diseases years lived with the condition decreased with age similarly to overall life expectancy. Although years lived with IADL disability also decreased with age this was at a slower pace than for overall life expectancy, thought the same patterns for chronic diseases and IADL dis-ability held for males and females.
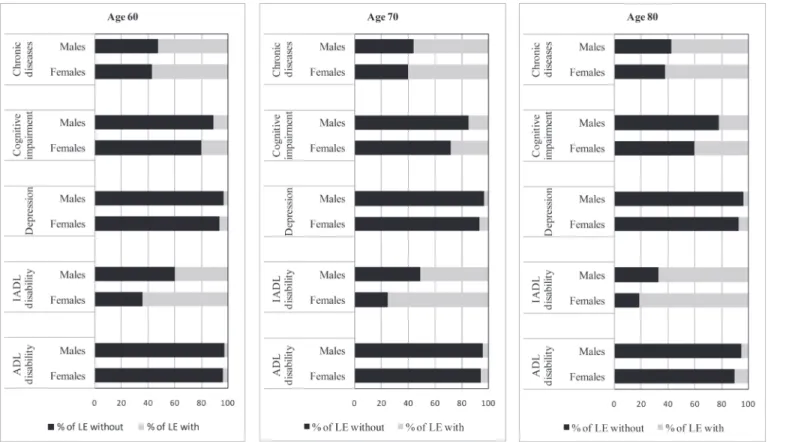
When health expectancies were expressed as a proportion of total life expectancy, females at all ages, compared to males, spent a greater proportion of their life expectancy with morbidity
and disability regardless of the health measure (Fig. 2). For both genders, however, more than
50% of total life expectancy at every age could be expected to be spent with chronic diseases or IADL disability, except for IADL disability in males aged 60 years. In contrast, less than 10% of total life expectancy would be spent with depression or ADL disability.
Discussion
This is the first study at the national level in Thailand to include multi-dimensions of health (physical and mental) across the disablement process into the calculation of health expectan-cies. Although the average number of years lived with and without morbidity and disability as measured by the multiple dimensions of health varied as expected, gender differences were not consistent across measures. At age 60, males could expect to live on average the most years free of depression and ADL disability and the least years free of chronic diseases. Females, on the contrary, could expect to live the most years free of ADL disability and the least years free of IADL disability, and they consistently spent more years with all forms of morbidity and disabil-ity. Finally, and for both sexes, years lived with cognitive impairment, depression and ADL dis-ability were almost constant with increasing age.
Most health expectancy estimates for Thailand focus on ADL disability, with all using
Sulli-van’s method and being based on national epidemiological studies in conjunction with national
mortality data [13–15]. Between 1997 and 2007, the proportion of life expectancy lived with
ADL disability at age 60 was 3–8 percent for males and 4–11 percent for females [13–15].
When compared to values in 2004 [13] and 2007 [15], the prevalence of ADL disability, the
ab-solute number of years lived with disability and the proportion of total life expectancy are slightly lower for males and females at every age. However, it should be noted that the values in 2004 are more comparable to ours as these used earlier waves of NHES whilst the later, 2007, values were based on the national surveys of the elderly where health data was self-reported.
Health expectancy estimates have been available for many Asian countries over the past
de-cade [12]. During the 2000s, studies showed that approximately 6–11 percent of the total life
expectancy at age 60 (or 65 years) was lived with ADL disability [27–30], except for Cambodia
which had a relatively longer proportion [31] and almost all these studies are methodologically
populations, Thai older people appear to have a better quality of life in terms of performance of self-care activities. However, to compare our findings with those of other studies, both within the country and internationally, issues of disability definitions and survey design should be taken into consideration. ADL items selected in the definitions vary across studies which
Fig 1. Total life expectancy (LE) and life expectancy spent with morbidity and disability by age and genders in Thailand, 2009.
potentially leads to different severity levels of disability. In addition, the health surveys used in most previous studies are based on self-report while ours employed mixed methods including a health examination, which might therefore be subject to a different form of bias (e.g. from re-fusal to participate in those with severe illness or mobility problems) rather than under or over reporting of abilities.
Few studies in Asia concentrate on IADL disability and chronic diseases although ours showed that older people in Thailand could expect to spend the most years with these condi-tions (10 and 13 years with chronic diseases, and 8 and 14 years with IADL disability for males and females aged 60, respectively). A study in Japan examining IADL disability by using
longi-tudinal data showed that 13% of males’and 18% of females’life expectancy at age 65 years was
spent with disability in IADL but not ADL [29]. IADL performance might not solely indicate
the underlying health of a population since it is also influenced by environment and role expec-tation. The better quality of life in IADL performance in Japan, compared to the findings pre-sented here, might therefore partly be explained by its more age-friendly environment, e.g. accessibility to public transports. With regard to chronic diseases, there has been little harmo-nization in measurements, which makes comparison difficult. A study in Singapore calculated disease-specific health expectancies, e.g. years with and without heart disease, cancer, diabetes,
and hypertension [30]. In contrast, studies in China and Hong Kong, as ours, combined a
number of diseases which required long-term medical follow-up [27,28].
Direct comparison with studies of mental health expectancy, all of which have been con-ducted in Western countries, is difficult, primarily due to characteristics of the data sources in
terms of protocols, methods of data collection, and measurement tools [6]. The focus therefore
is on how years lived with mental disorders change across age for our study compared to
Fig 2. Proportion of total life expectancy (LE) spent without and with morbidity and disability by age and genders in Thailand, 2009.
others. The most noticeable finding, consistently shown across studies including ours, is that
years spent with cognitive impairment appears relatively constant across old age [32–34]. For
depression, a study in European countries provided estimates of depression-free life expectancy in early- to mid-life (age 25 to 55) and found that years with depression slightly decreased with
age both in absolute values and as relative to the total life expectancy [35]. This appears
differ-ent to the pattern in older age in our study and this might link with changes that often come in later life, e.g. retirements, medical problems, etc. In terms of service provision, our findings imply that on average three years (both genders combined) of care for the cognitively impaired has to be provided for every person aged 60 years and over during their lifetime.
Our findings that females live more years with all forms of morbidity and disability suggest
that females’longer lives are not necessarily healthy ones and confirms other Asian studies
which have consistently shown that females spend a greater proportion of their life expectancy
lived with chronic diseases [28,30] and disability in terms of usual activities [36], mobility [37],
and ADL performance [13–15,28,30,31,36]. According to Oksuzyan et al. [38], this
phenome-non is called the female-male health-survival paradox and reasons for it are still not fully un-derstood. Multiple causes have been proposed, including hormonal, autoimmune, and genetic differences between the genders, and gender differences in lifestyle factors (such as risk-taking behaviour) and health behaviours (such as help-seeking behaviour, compliance with medical
treatment) might also contribute [38,39]. In the Thai context, as in some other countries,
worse health in females might be partly linked to education since traditionally boys were more
often favoured for schooling than girls, which is more apparent in the old age cohorts [40]. In
addition, gender gaps in IADL disability might be influenced by gender differences in role ex-pectation in some activities, e.g. housework. According to the model of disablement process
and the more recent ICF, disability is not inherent in a person [9,10]. Instead, it denotes a
rela-tionship between personal capability and the demand of environment. Further, gender differ-ences in morbidity may be due to biases in reporting health as gender stereotypes and social roles make it culturally more acceptable for females to have and report illness and health
prob-lems [38,39]. However, in our study, there is likely to be less gender bias in reporting since
some measures, specifically chronic diseases and cognitive impairment, were validated by physical examination, or laboratory or screening tests.
This study has both limitations and strengths. First, some limitations lie in its use of
Sulli-van’s method. This method uses the observed prevalence which is a result of the past incidence
and mortality experience of each cohort in the survey rather than the current incidence rates
[21,41]. So, it might not be able to reflect current morbidity or disability patterns. Despite this,
Sullivan’s method is the most often used because it requires cross-sectional data and period life
tables that are widely available [21,41], and it has been shown to provide unbiased estimates of
health expectancy if the transitions are stable and smooth over time [41]. A second limitation,
common to other health expectancy estimates, is that institutionalized people were not includ-ed because there are no public data available by age and sex. Overall there are approximately 7,000 institutionalized older adults in 2010 (combining those in nursing homes and prisons),
which accounts for less than 0.1 percent of total older population [42], thus this is unlikely to
have a major effect on our estimates. Finally, and as previously mentioned, the health examina-tion survey may have resulted in an underestimate of the prevalence of morbidity or disability since people with severe illness or mobility problems (e.g. hemiplegic conditions) may not have been able to participate. Though the alternative of prevalence estimates based on self-report of disability may have other biases, such non-response due to ill-health may be a reason for the
lower prevalence of ADL disability in participants aged 75–79 years, compared to those aged
70–74. Nevertheless, the use of mixed methods for ascertainment of health status in the NHES
ascertainment of pathologies or impairments of which individuals themselves are unaware and therefore unable to self-report. In addition, the use of mixed methods might also resolve some of the issues of differential reporting of health between socio-economic groups or individuals
with and without cognitive impairment [43].
In conclusion, this study adds knowledge of gender differences in healthy life expectancy in the older Thai population using a wider spectrum of health than previously which provides
in-formation to inform different groups of policy audiences [17]. For instance, health expectancy
measured by chronic physical diseases is important for informing the type and amount of pub-lic health resources required for prevention and care whilst the number of years lived with ADL disability is information primarily needed by social and health policy-makers who have responsibility for the provision of long-term care. In addition, health expectancy covering the spectrum of the disablement process can inform the progression of different of health states, for example it is informative about the average time spent with chronic physical diseases or cognitive impairment before developing ADL disability, a period which is potentially signifi-cant for secondary and tertiary prevention.
Acknowledgments
We acknowledge the National Health Examination Survey Office, Health Systems Research In-stitute (Thailand), and the NHES IV study group who contribute to the NHES IV data. We also thank the Bureau of Registration Administration, Department of Provincial Administra-tion, Ministry of Interior (Thailand) for the support of mortality data.
Author Contributions
Conceived and designed the experiments: BA KS PV WA. Analyzed the data: BA KS PV CJ. Wrote the paper: BA KS PV WA CJ.
References
1. Prasartkul P, Vapattanawong P. Transitional point of the Thai population. In: Punpuing S, Sunpuwan M, editors. Thailand’s population in transition: A turning point of Thai society. Nakhon-Pathom, Thai-land: Institute for Population and Social Research; 2011. pp. 13–22.
2. Institute for Population and Social Research. Mahidol university population projections for Thailand, 2005–2025. Nakhon Pathom, Thailand: Institute for Population and Social Research, Mahidol Univer-sity; 2006.
3. Institute for Population and Social Research. Population of Thailand, 2011: Estimated population at midyear 2011 (1st July). Mahidol Population Gazette. 2014.
4. Office of the National Economic and Social Development Board. Population Projections for Thailand 2010–2040. Bangkok, Thailand: Office of the National Economic and Social Development Board; 2013. doi:10.1016/j.canep.2014.03.003PMID:24767872
5. Bureau of Policy and Strategy. Statistical Thailand 2013. Nonthaburi, Thailand: Bureau of Policy and Strategy, Ministry of Public Health; 2013.
6. Robine JM, Nusselder W, Jagger C. Background to health expectancy. In: Robine JM, Jagger C, Egidi V, editors. Selection of a coherent set of health indicators final draft: A first step towards a user's guide to health expectancies for the European Union; 2000. pp. 3–15.
7. Robine JM, Ritchie K. Healthy life expectancy: Evaluation of a global indicator of change in population health. Br Med J. 1991; 302: 457–460.
8. Robine JM, Romieu I, Cambois E. Health expectancy indicators. Bull World Health Organ. 1999; 77: 181–185. PMID:10083720
9. Verbrugge LM, Jette AM. The disablement process. Soc Sci Med. 1994; 38: 1–14. PMID:8146699
11. Robine JM, Jagger C, Mathers CD, Crimmins EM, Suzman RM, editors. Determining health expectan-cies. England: John Wiley & Sons Ltd; 2003.
12. Saito Y, Qiao X, Jitapunkul S. Health expectancy in Asian countries. In: Robine JM, Jagger C, Mathers CD, Crimmins EM, Suzman RM, editors. Determining health expectancies. England: John Wiley & Sons Ltd; 2003. pp. 289–318.
13. Jiawiwatkul U, Aekplakorn W, Vapattanawong P, Prasartkul P, Porapakkham Y. Changes in active life expectancy among older Thais: Results from the 1997 and 2004 National Health Examination Surveys. Asia Pac J Public Health. 2011; 20: 1–8.
14. Jitapunkul S, Kunanusont C, Phoolcharoen W, Suriyawongpaisal P, Ebrahim S. Disability-free life ex-pectancy of elderly people in a population undergoing demographic and epidemiologic transition. Age Ageing. 2003; 32: 401–405. PMID:12851183
15. Karcharnubarn R, Rees P, Gould M. Healthy life expectancy changes in Thailand, 2002–2007. Health Place. 2013; 24: 1–10. doi:10.1016/j.healthplace.2013.08.002PMID:23999577
16. Jitapunkul S, Chayovan N. Healthy life expectancy of Thai elderly: did it improve during the soap-bub-ble economic period? J Med Assoc Thai. 2000; 83: 861–864. PMID:10998838
17. Jagger C, Weston C, Cambois E, van Oyen H, Nusselder W, Doblhammer G, et al. Inequalities in health expectancies at older ages in the European Union: findings from the survey of Health and Retirement in Europe (SHARE). J Epidemiol Community Health. 2011; 65: 1030–1035. doi:10.1136/jech.2010. 117705PMID:21471138
18. Aekplakorn W, Chariyalertsak S, Kessomboon P, Sangthong R, Inthawong R, Putwatana P, et al. Prev-alence and management of diabetes and metabolic risk factors in Thai adults: the Thai National Health Examination Survey IV, 2009. Diabetes Care. 2011; 34: 1980–1985. doi:10.2337/dc11-0099PMID: 21816976
19. American Psychiatric Association. Diagnostic and Statistical Manual of Mental Disorders, Fourth Edi-tion, Text Revision. Washington, DC: American Psychiatric Association; 2000.
20. Aekplakorn W. Report of the Forth National Health Examination Survey 2008–2009. Nonthaburi, Thai-land: National Health Examination Survey Office; 2009.
21. Jagger C, Cox B, Roy SL, EHEMU team. Health expectancy calculation by the Sullivan method: A prac-tical guide. European Health Expectancy Monitoring Unit; 2006.
22. Sullivan DF. A single index of mortality and morbidity. HSMHA Health Rep. 1971; 86: 347–354. PMID: 5554262
23. Institute for Population and Social Research. Study for preparation of population projections for Thai-land 2010–2040: Population base and assumptions. Bangkok, Thailand: Office of the national eco-nomic and social development board; 2013.
24. National Statistical Office of Thailand. Report of the 1995–1996 Survey of Population Change. Bang-kok, Thailand: National Statistical Office of Thailand; (n.d.).
25. Vapattanawong P, Prasartkul P. Under-registration of deaths in Thailand in 2005–2006: results of cross-matching data from two sources. Bull World Health Organ. 2011; 89: 806–812. doi:10.2471/ BLT.10.083931PMID:22084526
26. Coale AJ, Kisker EE. Defects in data on old-age mortality in the United States: new procedures for cal-culating mortality schedules and life tables at the highest ages. Asian and Pacific Population Forum. 1990; 4: 1–31. PMID:12343020
27. Gu D, Dupre ME, Warner DF, Zeng Y. Changing health status and health expectancies among older adults in China: Gender differences from 1992 to 2002. Soc Sci Med. 2009; 68: 2170–2179. doi:10. 1016/j.socscimed.2009.03.031PMID:19394120
28. Cheung K, Yip P. Trends in healthy life expectancy in Hong Kong SAR 1996–2008. Eur J Ageing. 2010; 7: 257–269. PMID:21212818
29. Konno K, Katsumata Y, Arai A, Tamashiro H. Functional status and active life expectancy among senior citizens in a small town in Japan. Arch Gerontol Geriatr. 2004; 38: 153–166. PMID:14698494
30. Yong V, Saito Y, Chan A. Gender differences in health and health expectancies of older adults in Singa-pore: An examination of diseases, impairments, and functional disabilities. J Cross Cult Gerontol. 2011; 26: 189–203. doi:10.1007/s10823-011-9143-0PMID:21416332
31. Zimmer Z. Disability and active life expectancy among older Cambodians. Asian Population Studies. 2006; 2: 133–148.
32. Matthews FE, Jagger C, Miller LL, Brayne C, MRC CFAS. Education differences in life expectancy with cognitive impairment. J Gerontol A Biol Sci Med Sci. 2009; 64A: 125–131.
34. Suthers K, Kim JK, Crimmins E. Life expectancy with cognitive impairment in the older population of the United States. J Gerontol B-Psychol. 2003; 58B: S179–S186. PMID:12730319
35. Brugha TS, Matthews R, Alonso J, Vilagut G, Fouweather T, Bruffaerts R, et al. Gender differences in mental health expectancies in early- and midlife in six European countries. Br J Psychiatry. 2013; 202: 294–300. doi:10.1192/bjp.bp.111.107003PMID:23470286
36. Hashimoto S, Kawado M, Seko R, Murakami Y, Hayashi M, Kato M, et al. Trends in disability-free life expectancy in Japan, 1995–2004. J Epidemiol. 2010; 20: 308–312. PMID:20530916
37. Yong V, Saito Y, Chan A. Changes in the prevalence of mobility limitations and mobile life expectancy of older adults in Singapore, 1995–2005. J Ageing Health. 2010; 22: 120–140. doi:10.1177/ 0898264309351932PMID:19934444
38. Oksuzyan A, Juel K, Vaupel JW, Christensen K. Men: good health and high mortality—sex differences in health and aging. Aging Clin Exp Res. 2008; 20: 91–102. PMID:18431075
39. Oksuzyan A, Brønnum-Hansen H, Jeune B. Gender gap in health expectancy. Eur J Ageing. 2010; 7:
213–218.
40. Knodel J, Chayovan N. Gender and ageing in Thailand: A situation analysis of older women and men. Population Studies Center, University of Michigan; 2008.
41. Cambois E. Overview of the methods of calculation and methodological problems. In: Robine JM, Jag-ger VC, Egidi V, editors. Selection of a coherent set of health indicators final draft: A first step towards a user's guide to health expectancies for the European Union; 2000. pp. 91–96.
42. Foundation of Thai Gerontology Research and Development Institute. Situation of the Thai elderly 2010. Bangkok, Thailand: Foundation of Thai Gerontology Research and Development Institute; 2012.