Polypharmacy and Polymorbidity in Older
Adults in Brazil: a public health challenge
Luiz Roberto RamosI, Noemia Urruth Leão TavaresII, Andréa Dâmaso BertoldiIII, Mareni Rocha FariasIV, Maria Auxiliadora OliveiraV, Vera Lucia LuizaV, Tatiane da Silva Dal PizzolVI, Paulo Sérgio Dourado ArraisVII, Sotero Serrate MengueVIII
I Departamento de Medicina Preventiva. Escola Paulista de Medicina. Universidade Federal de São Paulo. São
Paulo, SP, Brasil
II Departamento de Farmácia. Faculdade de Ciências da Saúde. Universidade de Brasília. Brasília, DF, Brasil III Departamento de Medicina Social. Faculdade de Medicina. Universidade Federal de Pelotas. Pelotas, RS, Brasil IV Departamento de Ciências Farmacêuticas. Centro de Ciências da Saúde. Universidade Federal de Santa
Catarina. Florianópolis, SC, Brasil
V Departamento de Política de Medicamentos e Assistência Farmacêutica. Escola Nacional de Saúde Pública
Sérgio Arouca. Fundação Oswaldo Cruz. Rio de Janeiro, RJ, Brasil
VI Departamento de Produção e Controle de Medicamentos. Faculdade de Farmácia. Universidade Federal do Rio
Grande do Sul. Porto Alegre, RS, Brasil
VII Departamento de Farmácia. Faculdade de Farmácia, Odontologia e Enfermagem. Universidade Federal do
Ceará. Fortaleza, CE, Brasil
VIII Programa de Pós-Graduação em Epidemiologia. Faculdade de Medicina. Universidade Federal do Rio Grande
do Sul. Porto Alegre, RS, Brasil
ABSTRACT
OBJECTIVE: To analyze variations in the prevalence of chronic use of medicines by older adults in Brazil according to its possible association with the most prevalent chronic diseases and demographic and health factors, and to identify risk factors for polypharmacy.
METHODS: A study based on data from the National Survey on Access, Use and Promotion of Rational Use of Medicines (PNAUM), a cross-sectional, population-based survey with probability sampling in Brazilian urban areas. he independent variable was the number of chronic-use medicines taken by older adults, linked to eight chronic diseases investigated. he intervening variables were gender, age group, marital status, level of education, socioeconomic status, Brazilian region, body mass index, smoking, self-perceived health, hospitalization in the previous year and having health insurance, besides the investigated chronic diseases. A multivariable analysis identiied risk factors for polypharmacy.
RESULTS: Prevalence of at least one chronic-use medicines among older adults was 93.0%. Of the total number of older adults, 18.0% used at least ive medications (polypharmacy). Polypharmacy was higher among the oldest individuals (20.0%), in the South region (25.0%), in those with poor self-perceived health (35.0%), in obese individuals (26.0%), in those with reported health insurance (23.0%) or hospitalization in the previous year (31.0%), and among those who reported any of the investigated diseases, particularly diabetes (36.0%) and heart diseases (43.0%). he variables remaining in the inal risk model for polypharmacy were age, region, perceived health, health insurance, hospitalization in the previous year and all investigated diseases except stroke.
CONCLUSIONS: Older adults with speciic diseases have risk factors for polypharmacy modiiable by actions aimed at the rational use of medicines. With the current population aging and successful drug access policy, the trend is an increase in drug use by older adults, which should feature as a priority in the planning agenda of the Brazilian Uniied Health System (SUS).
DESCRIPTORS: Aged. Comorbidity. Polypharmacy. Aging. Chronic Disease. Population Surveys. Correspondence:
Luiz Roberto Ramos Centro de Estudos do Envelhecimento Escola Paulista de Medicina – Unifesp Rua Dr. Bacelar 384
04026-001 São Paulo, SP, Brasil E-mail: [email protected]
Received: 24 Jan 2015 Approved: 22 Apr 2016
How to cite: Ramos LR, Tavares NUL, Bertoldi AD, Farias MR, Oliveira MA, Luiza VL, et al. Polypharmacy and Polymorbidity in Older Adults in Brazil: a public health challenge. Rev Saude Publica. 2016;50(suppl 2):9s.
Copyright: This is an open-access article distributed under the terms of the Creative Commons Attribution License, which permits unrestricted use, distribution, and reproduction in any medium, provided that the original author and source are credited.
INTRODUCTION
he Brazilian population is aging fast. Brazil has currently about 16 million older adults,
and by 2025 will have about 32 million, which will be the sixth largest population of older
adults worldwide23,24. Population aging, combined with the epidemiological transition,
increases the prevalence of non-communicable diseases (NCD), which, with the decline of communicable diseases as causes of death, have become the main causes of morbidity and mortality in Brazil6,24.
he Política Nacional de Promoção da Saúde (National Policy for Health Promotion), which
began in 2006, proposes to control NCD by promoting health and prevention through
programs that encourage a healthy lifestyle20. On the other hand, data from the 2013 Pesquisa
Nacional de Saúde (National Health Survey) suggest that around 60 million Brazilians have
at least one NCD and the majority resort to chronic-use medicines to control their diseases
and thus not compromise their quality of life19,a.
he Brazilian Uniied Health System (SUS), through pharmaceutical services, is responsible
for guaranteeing access to medicines and promoting their rational use18. Regulated in 2011,
the Relação Nacional de Medicamentos Essenciais (RENAME –National List of Essential Medicines) lists and standardizes medicines indicated to treat diseases or health conditions
provided by the SUS networkb. Older adults, who often suffer from polymorbidity6,23,
usually take many medications, which may lead to inappropriate use of medicines and a
higher incidence of side efects, avoidable by rational use of medicines12,22,26,27,29. Given the demographic imperative, a signiicant growth in the use of chronic medications by older
adults is predicted, tending to increase as access improves.
Population studies on drug use in Brazil show that old age is indeed one of the main risk
factors for being a heavy user of chronic-use medicines1,3,7,13,21. However, most population
studies on drug use carried out in Brazil, which included older adults, investigated the use
or not of a given medication either on the day of the interview5,8,15,21, or in the previous seven
days10,11, or in the previous 15 days or more1,3,4,14,25,28. Only one of those studies speciied the
long-term use of medications9. None of the studies linked drug use to a chronic disease the
respondent had been informed about by a doctor.
PNAUM is an important initiative of the Brazilian Ministry of Health in the field of
pharmaceutical services, aimed at guiding the planning of pharmaceutical services for older adults and medical protocols for NCD control among older adults in Brazil. It sought to identify regional, sociodemographic and health particularities of the population associated with the chronic use of medicines by older adults.
his article aimed to describe the relationship of chronic use of medicines with the most
prevalent NCD among older adults and with polymorbidity (the sum of those most prevalent diseases). It also seeks to understand the sociodemographic factors and health indicators
associated with polypharmacy (use of at least ive medicines), a sign of high use of medicines,
which does not necessarily indicate irrational use, especially among older adults5,22,27.
METHODS
PNAUM was a cross-sectional, population-based study carried out between September 2013 and February 2014. A national probability sample (n = 41,433), with a complex design,
ensured representation in the ive Brazilian regions, with stratiication by gender and age. he strategy used was face-to-face interviews in households with data recorded in tablets with speciic software for the survey’s questionnaires. Details of the methodology can be found in a speciic publication16.
his study analyzed the information obtained from the population of older adults (aged 60
or over) (n = 9,019). Data on use of and access to chronic-use medicines were obtained from a Instituto Brasileiro de Geografia
e Estatística. Pesquisa nacional de saúde: 2013: percepção do estado de saúde, estilos de vida e doenças crônicas: Brasil, grandes regiões e unidades da federação. Rio de Janeiro (RJ): IBGE; 2014.
b Ministério da Saúde, Secretaria
the report of previously informed diagnoses (“has any doctor said that you have…), possible indication for treatment (“has any doctor indicated treatment for...”), and the naming of medicines used for each disease (compared with prescriptions and packaging, whenever possible). Eight chronic diseases were selected to be investigated, namely: high blood pressure, diabetes mellitus, heart diseases, high blood cholesterol, medical history of stroke, chronic lung diseases, rheumatism and depression. Other chronic diseases occasionally reported were not included in the analysis because they represented a very large and diverse group
of diseases, with very low frequencies. he variable chronic polymorbidity was created for
purposes of analysis, ranging from zero to eight, related to the above mentioned diseases.
he dependent variable was the number of chronic-use medicines used by older adults, linked to one of those eight chronic diseases reported. Only speciic medicines for each one of the
diseases were consideredc. here is no universally accepted deinition for polypharmacy.
he option in this study was to work with ive or more medicines associated with one of
the eight chronic diseases, in the knowledge that other studies consider polypharmacy as
taking more than three or sometimes more than 10 medicines26,27.
As intervening variables, the study analyzed the sociodemographic characteristics of respondents – gender, age group, marital status, level of education, socioeconomic status
according to the Critério Classiicação Econômica Brasil (CCEB/ABEP, 2013 – Brazilian Economic
Classiication Criterion) in brackets A/B; C; D/E (http://www.abep.org/criterio-brasil), and
Brazilian region (North, Northeast, South, Southeast and Midwest) – and a few health
indicators – body mass index (BMI with speciic cutofs for older adults), current smoking
habits, self-perceived health, hospitalization in the previous year and having health insurance,
in addition to the above mentioned diseases. Pearson’s Chi-squared test was used to verify
associations. Poisson regression, univariate and multivariable, was performed to identify
the most signiicant factors associated with a high prevalence of polypharmacy (≥ 5 chronic medications). he variables with p-value lower than 0.20 in the univariate analyses were
selected for the multivariate analysis. Variables with p-value lower than 0.05 remained in the
model. he analyses were performed using the SPS v. 18 statistical package and the results were weighted according to the sample design. he study was approved by the Conselho Nacional de Ética em Pesquisa (National Research Ethics Council – Opinion 398.131, from September 16, 2013).
RESULTS
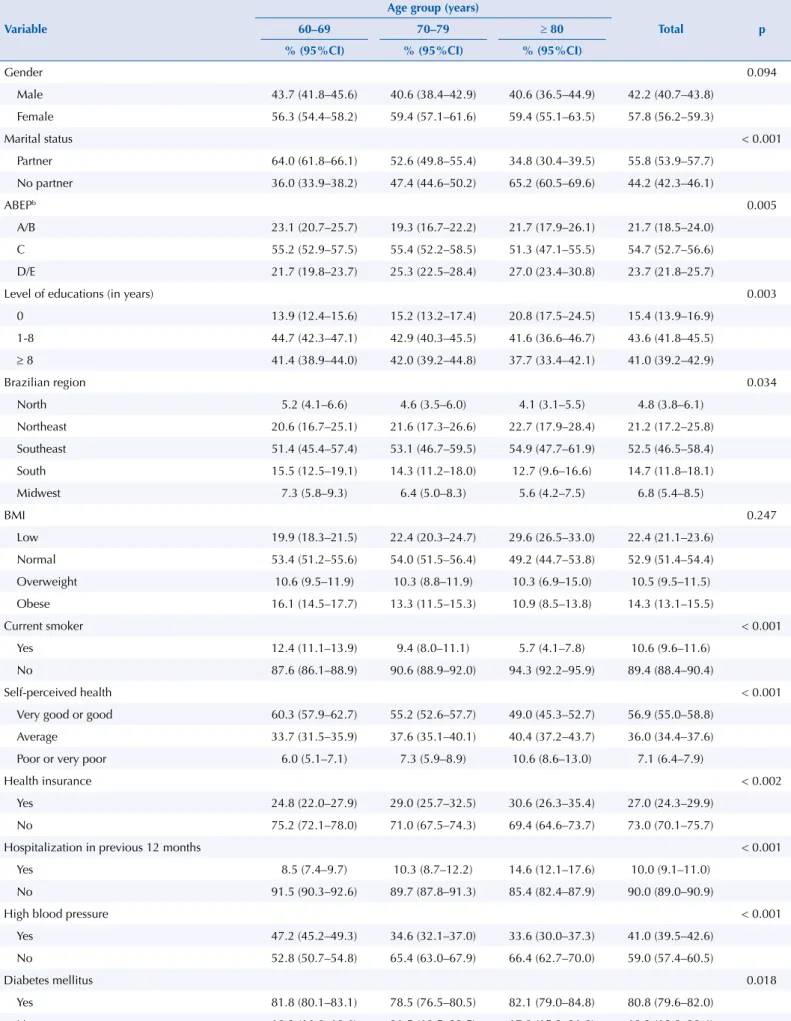
Table 1 features the age composition of the sample according to the sociodemographic and health variables evaluated. Just over half of the older adults were under 70 years old, about one third were between 70 and 79 years, and 14% were 80 or older. More than half
were women, with no signiicant diferences between age groups. Most lived with a spouse, a condition signiicantly more prevalent in the group aged 60-69 (64%) and less so in the
group aged 80 years or over. In general, the level of education was low. Most of the older adults were in economic bracket C (55%), while about 24% were in brackets D and E. Most of the older adults lived in the Southeast region (53%), followed by the Northeast (21%). A minority of older adults reported smoking (11%), which tended to be lower in the group aged 80 or over (6%). About 25% of the older adults were overweight or obese, but the group aged 80 or over showed a trend towards low weight (30%). Only 10% of the older adults
reported hospitalization in the previous year, with a signiicant increase in prevalence in the ≥ 80 group (15%). In 27% of cases the older adults had health insurance.
Prevalence of high blood pressure was 59% and increased signiicantly with age (66% in the ≥ 80 group), as did heart disease prevalence, which ranged from 11% in the group aged 60 to 69 to 22% in the group aged ≥ 80, and prevalence of stroke was reported by a minority (6%), reaching 10% in the group aged ≥ 80. Prevalence of the other diseases did not vary signiicantly with age.
c Reports on specific
Table 1. Sociodemographic and health profile of older adults by age groupa. PNAUM, Brazil, 2014. (N = 6,844)
Variable
Age group (years)
Total p
60–69 70–79 ≥ 80
% (95%CI) % (95%CI) % (95%CI)
Gender 0.094
Male 43.7 (41.8–45.6) 40.6 (38.4–42.9) 40.6 (36.5–44.9) 42.2 (40.7–43.8)
Female 56.3 (54.4–58.2) 59.4 (57.1–61.6) 59.4 (55.1–63.5) 57.8 (56.2–59.3)
Marital status < 0.001
Partner 64.0 (61.8–66.1) 52.6 (49.8–55.4) 34.8 (30.4–39.5) 55.8 (53.9–57.7)
No partner 36.0 (33.9–38.2) 47.4 (44.6–50.2) 65.2 (60.5–69.6) 44.2 (42.3–46.1)
ABEPb 0.005
A/B 23.1 (20.7–25.7) 19.3 (16.7–22.2) 21.7 (17.9–26.1) 21.7 (18.5–24.0)
C 55.2 (52.9–57.5) 55.4 (52.2–58.5) 51.3 (47.1–55.5) 54.7 (52.7–56.6)
D/E 21.7 (19.8–23.7) 25.3 (22.5–28.4) 27.0 (23.4–30.8) 23.7 (21.8–25.7)
Level of educations (in years) 0.003
0 13.9 (12.4–15.6) 15.2 (13.2–17.4) 20.8 (17.5–24.5) 15.4 (13.9–16.9)
1-8 44.7 (42.3–47.1) 42.9 (40.3–45.5) 41.6 (36.6–46.7) 43.6 (41.8–45.5)
≥ 8 41.4 (38.9–44.0) 42.0 (39.2–44.8) 37.7 (33.4–42.1) 41.0 (39.2–42.9)
Brazilian region 0.034
North 5.2 (4.1–6.6) 4.6 (3.5–6.0) 4.1 (3.1–5.5) 4.8 (3.8–6.1)
Northeast 20.6 (16.7–25.1) 21.6 (17.3–26.6) 22.7 (17.9–28.4) 21.2 (17.2–25.8) Southeast 51.4 (45.4–57.4) 53.1 (46.7–59.5) 54.9 (47.7–61.9) 52.5 (46.5–58.4)
South 15.5 (12.5–19.1) 14.3 (11.2–18.0) 12.7 (9.6–16.6) 14.7 (11.8–18.1)
Midwest 7.3 (5.8–9.3) 6.4 (5.0–8.3) 5.6 (4.2–7.5) 6.8 (5.4–8.5)
BMI 0.247
Low 19.9 (18.3–21.5) 22.4 (20.3–24.7) 29.6 (26.5–33.0) 22.4 (21.1–23.6)
Normal 53.4 (51.2–55.6) 54.0 (51.5–56.4) 49.2 (44.7–53.8) 52.9 (51.4–54.4)
Overweight 10.6 (9.5–11.9) 10.3 (8.8–11.9) 10.3 (6.9–15.0) 10.5 (9.5–11.5)
Obese 16.1 (14.5–17.7) 13.3 (11.5–15.3) 10.9 (8.5–13.8) 14.3 (13.1–15.5)
Current smoker < 0.001
Yes 12.4 (11.1–13.9) 9.4 (8.0–11.1) 5.7 (4.1–7.8) 10.6 (9.6–11.6)
No 87.6 (86.1–88.9) 90.6 (88.9–92.0) 94.3 (92.2–95.9) 89.4 (88.4–90.4)
Self-perceived health < 0.001
Very good or good 60.3 (57.9–62.7) 55.2 (52.6–57.7) 49.0 (45.3–52.7) 56.9 (55.0–58.8)
Average 33.7 (31.5–35.9) 37.6 (35.1–40.1) 40.4 (37.2–43.7) 36.0 (34.4–37.6)
Poor or very poor 6.0 (5.1–7.1) 7.3 (5.9–8.9) 10.6 (8.6–13.0) 7.1 (6.4–7.9)
Health insurance < 0.002
Yes 24.8 (22.0–27.9) 29.0 (25.7–32.5) 30.6 (26.3–35.4) 27.0 (24.3–29.9)
No 75.2 (72.1–78.0) 71.0 (67.5–74.3) 69.4 (64.6–73.7) 73.0 (70.1–75.7)
Hospitalization in previous 12 months < 0.001
Yes 8.5 (7.4–9.7) 10.3 (8.7–12.2) 14.6 (12.1–17.6) 10.0 (9.1–11.0)
No 91.5 (90.3–92.6) 89.7 (87.8–91.3) 85.4 (82.4–87.9) 90.0 (89.0–90.9)
High blood pressure < 0.001
Yes 47.2 (45.2–49.3) 34.6 (32.1–37.0) 33.6 (30.0–37.3) 41.0 (39.5–42.6)
No 52.8 (50.7–54.8) 65.4 (63.0–67.9) 66.4 (62.7–70.0) 59.0 (57.4–60.5)
Diabetes mellitus 0.018
Yes 81.8 (80.1–83.1) 78.5 (76.5–80.5) 82.1 (79.0–84.8) 80.8 (79.6–82.0)
No 18.2 (16.8–19.6) 21.5 (19.5–23.5) 17.9 (15.2–21.0) 19.2 (18.0–20.4)
he number of reported diseases per older adult ranged from zero to eight diseases; 26% did not
report any of the eight diseases, 31% reported only one, 22%, two, 13%, three and 9% reported at least four. Among those that reported only one chronic disease (31%), in 66% of cases the disease was high blood pressure, 8%, diabetes, 5%, heart diseases, 7%, high blood cholesterol, 1%, stroke, 3%, lung diseases, 6%, rheumatism and 4%, depression (data not shown).
Of the total number of older adults, one-third, 31%, did not report any chronic medication for those diseases, ranging from 37% in the group aged 60 to 69 to 24% in the group aged 80 or over. Overall, 17% of older adults reported using one chronic drug, 17%, two, 21%, three
or four, and 14% used at least ive medicines (data not shown).
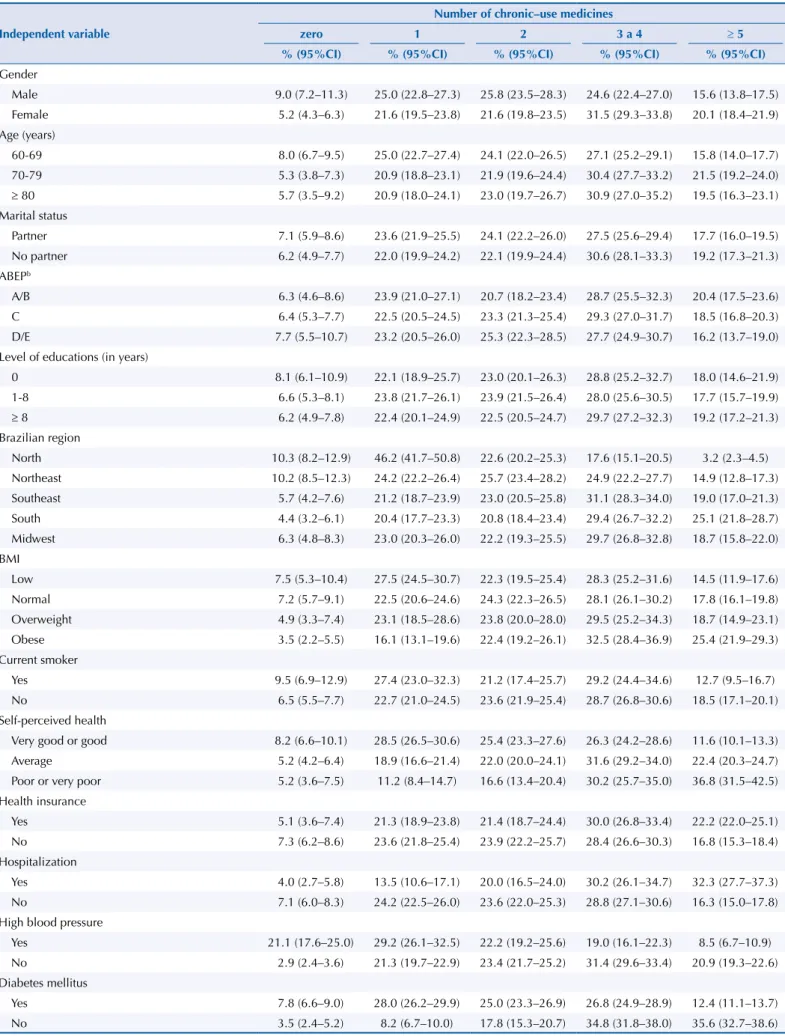
Table 2 analyzes the prevalence of chronic-use medicines for the eight chronic diseases, among the older adults who reported at least one of those diseases (74%), according to sociodemographic
and health variables. Overall prevalence of at least one speciic medicine for one of those diseases
was 93%, with 23% using a single drug, 23% using two, 29% using three or four medications,
and 18% using at least ive and characterizing polypharmacy. Prevalence of polypharmacy was signiicantly higher among: female older adults (20%), those aged 70 to 79 (22%), resident in the
South region (25%) (with prevalence of polypharmacy in the North region being noticeably low [3%]), those who reported having health insurance (22%), those who reported hospitalization in the previous year (32%), overweight individuals (25%), those with poor or very poor self-perceived health (37%), and those who reported each one of the eight diseases. Prevalence of polypharmacy varied from 21% in high blood pressure to 42% in heart diseases.
Analyzing drug use in relation to polymorbidity, prevalence of polypharmacy was 3% among those who reported only one of the diseases, 13% among older people with two diseases, 37% among those with three diseases, and 60% among those who reported at least four diseases (data not shown).
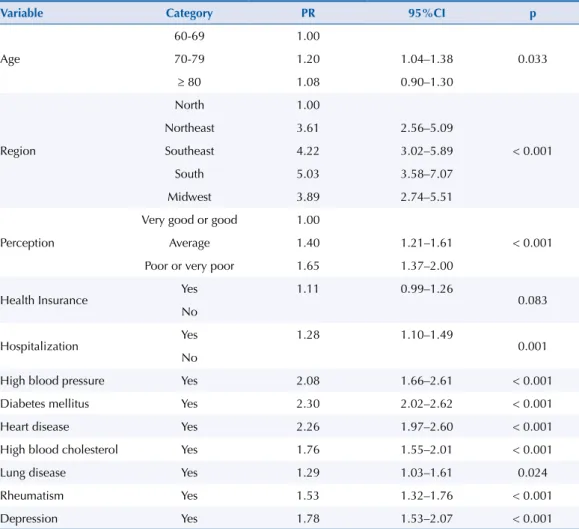
Table 3 shows the outcome of the multivariate analysis controlling the use of five or more medications (polypharmacy) for those eight chronic diseases by all sociodemographic
Table 1. Sociodemographic and health profile of older adults by age groupa. PNAUM, Brazil, 2014. (N = 6,844). Continuation
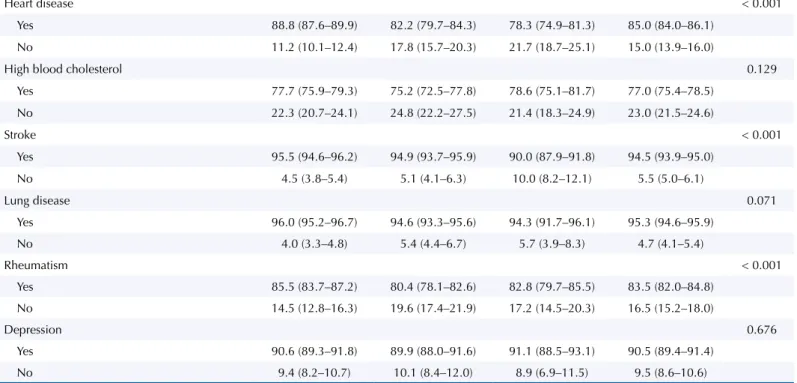
Heart disease < 0.001
Yes 88.8 (87.6–89.9) 82.2 (79.7–84.3) 78.3 (74.9–81.3) 85.0 (84.0–86.1)
No 11.2 (10.1–12.4) 17.8 (15.7–20.3) 21.7 (18.7–25.1) 15.0 (13.9–16.0)
High blood cholesterol 0.129
Yes 77.7 (75.9–79.3) 75.2 (72.5–77.8) 78.6 (75.1–81.7) 77.0 (75.4–78.5)
No 22.3 (20.7–24.1) 24.8 (22.2–27.5) 21.4 (18.3–24.9) 23.0 (21.5–24.6)
Stroke < 0.001
Yes 95.5 (94.6–96.2) 94.9 (93.7–95.9) 90.0 (87.9–91.8) 94.5 (93.9–95.0)
No 4.5 (3.8–5.4) 5.1 (4.1–6.3) 10.0 (8.2–12.1) 5.5 (5.0–6.1)
Lung disease 0.071
Yes 96.0 (95.2–96.7) 94.6 (93.3–95.6) 94.3 (91.7–96.1) 95.3 (94.6–95.9)
No 4.0 (3.3–4.8) 5.4 (4.4–6.7) 5.7 (3.9–8.3) 4.7 (4.1–5.4)
Rheumatism < 0.001
Yes 85.5 (83.7–87.2) 80.4 (78.1–82.6) 82.8 (79.7–85.5) 83.5 (82.0–84.8)
No 14.5 (12.8–16.3) 19.6 (17.4–21.9) 17.2 (14.5–20.3) 16.5 (15.2–18.0)
Depression 0.676
Yes 90.6 (89.3–91.8) 89.9 (88.0–91.6) 91.1 (88.5–93.1) 90.5 (89.4–91.4)
No 9.4 (8.2–10.7) 10.1 (8.4–12.0) 8.9 (6.9–11.5) 9.5 (8.6–10.6)
ABEP: Associação Brasileira de Empresas de Pesquisa (Brazilian Association of Survey Companies); BMI: Body Mass Index
a The percentages and confidence intervals were calculated based on the expanded sample – adjusted by sampling weights and post-stratification by age
and gender.
Table 2. Prevalence of older adults that utilize chronic-use medicines (CM) for at least one of the eight chronic diseases, according to sociodemographic and health variables. PNAUM, Brazil, 2014a.
Independent variable
Number of chronic–use medicines
zero 1 2 3 a 4 ≥ 5
% (95%CI) % (95%CI) % (95%CI) % (95%CI) % (95%CI)
Gender
Male 9.0 (7.2–11.3) 25.0 (22.8–27.3) 25.8 (23.5–28.3) 24.6 (22.4–27.0) 15.6 (13.8–17.5) Female 5.2 (4.3–6.3) 21.6 (19.5–23.8) 21.6 (19.8–23.5) 31.5 (29.3–33.8) 20.1 (18.4–21.9) Age (years)
60-69 8.0 (6.7–9.5) 25.0 (22.7–27.4) 24.1 (22.0–26.5) 27.1 (25.2–29.1) 15.8 (14.0–17.7) 70-79 5.3 (3.8–7.3) 20.9 (18.8–23.1) 21.9 (19.6–24.4) 30.4 (27.7–33.2) 21.5 (19.2–24.0) ≥ 80 5.7 (3.5–9.2) 20.9 (18.0–24.1) 23.0 (19.7–26.7) 30.9 (27.0–35.2) 19.5 (16.3–23.1) Marital status
Partner 7.1 (5.9–8.6) 23.6 (21.9–25.5) 24.1 (22.2–26.0) 27.5 (25.6–29.4) 17.7 (16.0–19.5) No partner 6.2 (4.9–7.7) 22.0 (19.9–24.2) 22.1 (19.9–24.4) 30.6 (28.1–33.3) 19.2 (17.3–21.3) ABEPb
A/B 6.3 (4.6–8.6) 23.9 (21.0–27.1) 20.7 (18.2–23.4) 28.7 (25.5–32.3) 20.4 (17.5–23.6)
C 6.4 (5.3–7.7) 22.5 (20.5–24.5) 23.3 (21.3–25.4) 29.3 (27.0–31.7) 18.5 (16.8–20.3)
D/E 7.7 (5.5–10.7) 23.2 (20.5–26.0) 25.3 (22.3–28.5) 27.7 (24.9–30.7) 16.2 (13.7–19.0) Level of educations (in years)
0 8.1 (6.1–10.9) 22.1 (18.9–25.7) 23.0 (20.1–26.3) 28.8 (25.2–32.7) 18.0 (14.6–21.9) 1-8 6.6 (5.3–8.1) 23.8 (21.7–26.1) 23.9 (21.5–26.4) 28.0 (25.6–30.5) 17.7 (15.7–19.9) ≥ 8 6.2 (4.9–7.8) 22.4 (20.1–24.9) 22.5 (20.5–24.7) 29.7 (27.2–32.3) 19.2 (17.2–21.3) Brazilian region
North 10.3 (8.2–12.9) 46.2 (41.7–50.8) 22.6 (20.2–25.3) 17.6 (15.1–20.5) 3.2 (2.3–4.5) Northeast 10.2 (8.5–12.3) 24.2 (22.2–26.4) 25.7 (23.4–28.2) 24.9 (22.2–27.7) 14.9 (12.8–17.3) Southeast 5.7 (4.2–7.6) 21.2 (18.7–23.9) 23.0 (20.5–25.8) 31.1 (28.3–34.0) 19.0 (17.0–21.3) South 4.4 (3.2–6.1) 20.4 (17.7–23.3) 20.8 (18.4–23.4) 29.4 (26.7–32.2) 25.1 (21.8–28.7) Midwest 6.3 (4.8–8.3) 23.0 (20.3–26.0) 22.2 (19.3–25.5) 29.7 (26.8–32.8) 18.7 (15.8–22.0) BMI
Low 7.5 (5.3–10.4) 27.5 (24.5–30.7) 22.3 (19.5–25.4) 28.3 (25.2–31.6) 14.5 (11.9–17.6) Normal 7.2 (5.7–9.1) 22.5 (20.6–24.6) 24.3 (22.3–26.5) 28.1 (26.1–30.2) 17.8 (16.1–19.8) Overweight 4.9 (3.3–7.4) 23.1 (18.5–28.6) 23.8 (20.0–28.0) 29.5 (25.2–34.3) 18.7 (14.9–23.1) Obese 3.5 (2.2–5.5) 16.1 (13.1–19.6) 22.4 (19.2–26.1) 32.5 (28.4–36.9) 25.4 (21.9–29.3) Current smoker
Yes 9.5 (6.9–12.9) 27.4 (23.0–32.3) 21.2 (17.4–25.7) 29.2 (24.4–34.6) 12.7 (9.5–16.7) No 6.5 (5.5–7.7) 22.7 (21.0–24.5) 23.6 (21.9–25.4) 28.7 (26.8–30.6) 18.5 (17.1–20.1) Self-perceived health
Very good or good 8.2 (6.6–10.1) 28.5 (26.5–30.6) 25.4 (23.3–27.6) 26.3 (24.2–28.6) 11.6 (10.1–13.3) Average 5.2 (4.2–6.4) 18.9 (16.6–21.4) 22.0 (20.0–24.1) 31.6 (29.2–34.0) 22.4 (20.3–24.7) Poor or very poor 5.2 (3.6–7.5) 11.2 (8.4–14.7) 16.6 (13.4–20.4) 30.2 (25.7–35.0) 36.8 (31.5–42.5) Health insurance
Yes 5.1 (3.6–7.4) 21.3 (18.9–23.8) 21.4 (18.7–24.4) 30.0 (26.8–33.4) 22.2 (22.0–25.1) No 7.3 (6.2–8.6) 23.6 (21.8–25.4) 23.9 (22.2–25.7) 28.4 (26.6–30.3) 16.8 (15.3–18.4) Hospitalization
Yes 4.0 (2.7–5.8) 13.5 (10.6–17.1) 20.0 (16.5–24.0) 30.2 (26.1–34.7) 32.3 (27.7–37.3) No 7.1 (6.0–8.3) 24.2 (22.5–26.0) 23.6 (22.0–25.3) 28.8 (27.1–30.6) 16.3 (15.0–17.8) High blood pressure
Yes 21.1 (17.6–25.0) 29.2 (26.1–32.5) 22.2 (19.2–25.6) 19.0 (16.1–22.3) 8.5 (6.7–10.9) No 2.9 (2.4–3.6) 21.3 (19.7–22.9) 23.4 (21.7–25.2) 31.4 (29.6–33.4) 20.9 (19.3–22.6) Diabetes mellitus
Yes 7.8 (6.6–9.0) 28.0 (26.2–29.9) 25.0 (23.3–26.9) 26.8 (24.9–28.9) 12.4 (11.1–13.7)
No 3.5 (2.4–5.2) 8.2 (6.7–10.0) 17.8 (15.3–20.7) 34.8 (31.8–38.0) 35.6 (32.7–38.6)
Table 2. Prevalence of older adults that utilize chronic-use medicines (CM) for at least one of the eight chronic diseases, according to sociodemographic and health variables. PNAUM, Brazil, 2014a. Continuation
Heart disease
Yes 7.5 (6.4–8.7) 26.7 (24.9–28.6) 25.4 (23.6–27.3) 28.1 (26.2–30.0) 12.3 (11.0–13.7)
No 3.4 (2.1–5.4) 7.8 (6.0–9.9) 14.2 (11.9–16.9) 32.1 (29.0–35.5) 42.4 (38.6–46.3)
High blood cholesterol
Yes 7.3 (6.2–8.7) 28.3 (26.6–30.2) 26.4 (24.5–28.4) 25.5 (23.7–27.4) 12.4 (11.1–13.8)
No 5.2 (3.9–6.9) 10.8 (9.0–12.9) 16.0 (13.7–18.6) 36.3 (33.5–39.3) 31.7 (28.8–34.7)
Stroke
Yes 6.7 (5.7–7.9) 23.9 (22.3–25.5) 23.8 (22.2–25.4) 28.5 (26.7–30.3) 17.2 (15.9–18.6)
No 6.0 (4.0–8.9) 10.7 (7.6–14.8) 16.0 (12.4–20.4) 33.7 (28.4–39.5) 33.6 (27.9–39.9)
Lung disease
Yes 6.5 (5.6–7.7) 23.6 (22.0–25.3) 23.6 (22.1–25.3) 28.9 (27.1–30.6) 17.4 (16.0–18.8) No 8.4 (3.8–17.6) 12.4 (8.9–17.0) 16.4 (12.4–21.3) 29.4 (23.7–35.9) 33.4 (26.6–41.0) Rheumatism
Yes 6.3 (5.2–7.6) 25.9 (24.0–27.8) 25.1 (23.3–27.0) 27.8 (26.0–29.7) 14.9 (13.6–16.4) No 8.0 (6.3–10.0) 12.5 (10.3–15.3) 16.5 (14.2–19.0) 32.7 (29.8–35.7) 30.4 (27.2–33.7) Depression
Yes 7.1 (6.1–8.3) 24.9 (23.1–26.7) 24.4 (22.8–26.0) 27.9 (26.1–29.7) 15.8 (14.4–17.3)
No 3.5 (2.0–6.2) 9.5 (7.3–12.4) 15.1 (11.8–19.1) 35.9 (31.6–40.4) 36.0 (31.0–41.2)
Total 6.7 (5.7–7.8) 22.9 (21.4–24.5) 23.2 (21.6–24.8) 28.9 (27.2–30.6) 18.4 (17.0–19.8) ABEP: Associação Brasileira de Empresas de Pesquisa (Brazilian Association of Survey Companies); BMI: Body Mass Index
a The percentages and confidence intervals were calculated based on the expanded sample – adjusted by sampling weights and post-stratification by age
and gender.
b 2013 Critério Classificação Econômica Brasil (Brazilian Economic Classification Criterion) of ABEP.
Table 3. Multivariate model for risk factors for polypharmacy among older adults with at least one of the eight chronic diseases.
Variable Category PR 95%CI p
Age
60-69 1.00
0.033
70-79 1.20 1.04–1.38
≥ 80 1.08 0.90–1.30
Region
North 1.00
< 0.001
Northeast 3.61 2.56–5.09
Southeast 4.22 3.02–5.89
South 5.03 3.58–7.07
Midwest 3.89 2.74–5.51
Perception
Very good or good 1.00
< 0.001
Average 1.40 1.21–1.61
Poor or very poor 1.65 1.37–2.00
Health Insurance Yes 1.11 0.99–1.26 0.083
No
Hospitalization Yes 1.28 1.10–1.49 0.001
No
High blood pressure Yes 2.08 1.66–2.61 < 0.001
Diabetes mellitus Yes 2.30 2.02–2.62 < 0.001
Heart disease Yes 2.26 1.97–2.60 < 0.001
High blood cholesterol Yes 1.76 1.55–2.01 < 0.001
Lung disease Yes 1.29 1.03–1.61 0.024
Rheumatism Yes 1.53 1.32–1.76 < 0.001
and health variables presented. The prevalence ratio for polypharmacy was marginally higher among the oldest individuals and those who reported hospitalization in the previous year (PR = 1.3), and significantly higher among those who perceived their own health as poor or very poor (PR = 1.7). Use was significantly lower in the North region, causing the prevalence ratio for polypharmacy in all other regions to range from 3.6 in the Northeast region to 5.1 in the South. All diseases except stroke remained in the final risk model for polypharmacy, with prevalence ratios ranging from 1.5 in rheumatism to 2.3 in diabetes and heart diseases.
Among older adults who reported at least one of the eight chronic diseases, 583 speciic medicines were reported to treat those diseases, which, in diferent dosage forms (including ixed-dose combinations), totaled 17,634 reports. he 40 most frequently cited medicines
accounted for 73% of reports. In 63% of cases these were medicines for high blood pressure
or heart diseases and cholesterol control; 13% for diabetes; and 13% were psychoactive.
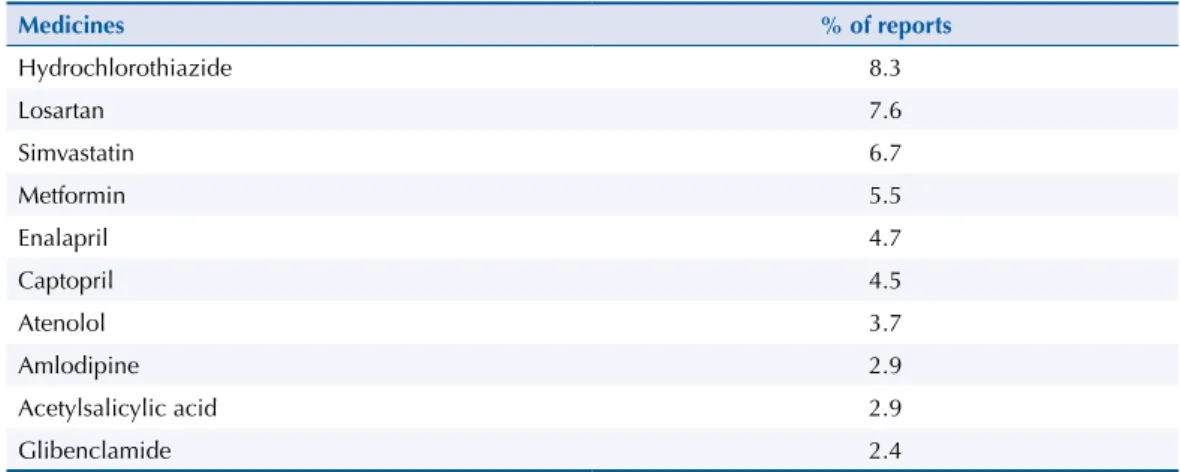
Table 4 features the 10 most reported medicines by older adults, accounting for 49% of
reports. he single most reported drug, considering only the number of reports within each disease separately, and not including ixed-dose combinations, was hydrochlorothiazide
(9%), followed by losartan (8%), both reported for high blood pressure, heart diseases or stroke. Simvastatin, indicated for blood cholesterol control, was the third most reported
drug (6%), followed by metformin for diabetes control (5%). he list was completed with
enalapril (4%), captopril (9%), atenolol (6%), glibenclamide (4%), propranolol (2%), and furosemide (2, 0%), all reported for treating high blood pressure, with the exception of glibenclamide, used to treat diabetes.
DISCUSSION
Based on the literature review4,5,9,10,13,21,25,28, this is the irst population study representative
of the ive Brazilian regions to assess the prevalence of chronic-use medicines among older
adults (aged 60 or over), linking the medicines to a previous diagnosis of the most prevalent NCD among older adults (high blood pressure, diabetes, heart diseases, dyslipidemia, stroke, lung disease, rheumatism and depression).
he indings of this study showed that the vast majority of older adults (74%) reported at least
one of the eight NCD mentioned, data compatible with population studies of older adults14,23.
Of those older adults with chronic disease, the absolute majority (93%) used at least one
chronic-use medicines. his prevalence of use of chronic-use medicines among older adults was
higher than the prevalence reported in other nationwide (73% to 83%)23,b or municipal (72% to
89%)5,7,10,14,25 studies, which did not specify chronic-use medicines and computed all reported medicines. his apparent paradox could be explained by the actual link between drug use and
Table 4. Most commonly reported medicines (10) by older adults to specifically treat one of the eight chronic diseases mentioned.
Medicines % of reports
Hydrochlorothiazide 8.3
Losartan 7.6
Simvastatin 6.7
Metformin 5.5
Enalapril 4.7
Captopril 4.5
Atenolol 3.7
Amlodipine 2.9
Acetylsalicylic acid 2.9
the existence of a chronic disease, which placed in the denominator only those who reported one of the selected NCD. Moreover, one can assume that the reports linked to the diseases may have prompted the memory of older adults concerning their list of chronic-use medicines.
On the other hand, prevalence of polypharmacy in the treatment of older adults with at least
one of the eight diseases was 18%. his prevalence was much lower than that reported in
other studies, which showed more than 35% of polypharmacy among older adults5,27. It should
be noted that this study computed chronic-use medicines only, considered speciic for each
one of the eight diseases, which certainly underestimated the total number, since chronic-use medicines reported by respondents related to other diseases and those of occasional use were not included. Other studies, in turn, investigated the use of any medication by older adults, and not necessarily those of chronic use, for any disease, which tends to increase the numerator and thus the estimate of polypharmacy.
Women were the majority in the sample and had a higher prevalence of use and polypharmacy,
as in most population studies with older adults5,14; however, the gender variable was not
maintained as an independent factor of chronic use among older adults in the multivariate
model discussed below. Prevalence of use of a chronic-use medicines signiicantly increased with age, reaching 95% in the group aged 80 or over. Polypharmacy was signiicantly higher in the group aged 70 to 79, but did not signiicantly increase in the group aged 80 or older, suggesting a selection of healthier older adults in higher age percentiles. his increased use among older people is also a common inding in almost all studies on drug use, especially
when compared to youngsters and young adults1,3,11.
Most older adults lived with a spouse and showed a prevalence of use very similar to the average. Most studies with older adults show that living with a spouse is a condition that
protects against the worsening of illnesses5,23. In the analysis by Brazilian regions, the North
and Northeast regions showed lower use, in contrast to the South and Southeast regions,
a fact that probably correlates with regional socioeconomic diferences4,5,14,28. Nevertheless,
the extremely low prevalence of polypharmacy in the North region (3%) stood out.
Having health insurance seemed to favor the use of medicines and polypharmacy, a inding
that is supported by other studies4,5,14,28. Self-perception proved to be a good health indicator,
as is common in studies with older adults4,5,14,28, with high prevalence of polypharmacy among
older adults who rated their health as poor or very poor. Report of previous hospitalization
identiies older adults with high prevalence of polypharmacy, a factor that was related to
the prevalence of diseases and appears in other studies as a risk factor4,5,14,28.
In the multivariate analysis, controlling by all other intervening variables, all diseases, with the
exception of stroke, signiicantly increase the risk of polypharmacy. In ascending order: lung
disease (PR = 1.3), rheumatism (PR = 1.5), depression and high blood cholesterol (PR = 1.8), high blood pressure (PR = 2.1), and, heading the list, diabetes and heart diseases (PR = 2.3). It is evident that the presence of these prevalent chronic diseases among older adults is the
greatest factor of drug use, serving as an indicator of risk groups easily identiiable by the
health system. Polimorbidity summarizes the importance of these diseases among older adults, with prevalence of polypharmacy above 60% in the group with polymorbidity.
Obesity appeared as a factor of increased drug use, with 26% of polypharmacy among obese
individuals, but this inding lost signiicance when controlled by the other chronic diseases.
No studies were found suggesting the independence of this factor.
Only one study with older adults in São Paulo correlated drug use by older adults with
pre-existent NCD5. The risk of polypharmacy significantly increased in the presence
of diabetes, heart problems, high blood pressure, rheumatic disease and lung disease, in descending order of risk.
he variable region is noteworthy, appearing in all analyses as strongly associated with the
diferences that are independent of all other sociodemographic or health variables. he fact
that the North region had a very low baseline value of polypharmacy (3%) must have weighed
in the multivariate analysis, perhaps increasing the signiicance of diferences, which was less
pronounced between the other four regions. But it certainly makes one think of regionalized
policies for rational use, improved access and increased adherence to treatment29.
It is remarkable that this high use of medicines by older adults can be summarized in a list of 32 single medicines that account for 77% of reports of use of chronic-use medicines by older adults. Prominent among them are medicines used to control high blood pressure (62%). Four medicines, two for high blood pressure (hydrochlorothiazide and losartan), one for high blood cholesterol (simvastatin) and one for diabetes (metformin), account for 48% of reports and 10 medicines account for 80% of reports in this group. It should be emphasized that all of
the 10 most used medicines are listed in RENAMEb and can therefore be obtained via public
pharmaceutical policies at no cost to the patient. All are part of the Componente Básico da
Assistência Farmacêutica (Basic Pharmaceutical Services Component), can be obtained at SUS
health units and are part of the Programa Farmácia Popular (Popular Pharmacy Program).
Public access to these medicines is assured with a medical prescription, and is therefore directly linked to access to health services. Control of these NCD requires protocols that incorporate
these results and promote action to rationalize drug use among speciic populations that are easily identiiable in the system (older adults with heart disease and diabetes, for example),
as well as action to encourage adherence among older adults to prescriptions which often contain several medicines with varied administration schedules. For such, it is necessary to monitor chronic treatments in primary care with action geared towards the prescription and
dispensing of medicines, improving patient understanding and increasing successful use2.
Medical practice should be influenced by knowledge of prevalent polymorbidity and polypharmacy in older adults, looking for ways to therapeutically manage chronic morbidity
that avoid iatrogenic diseases and side efects and maximize control of NCD, avoiding
unnecessary hospitalizations and trips to the emergency room and, above all, the gradual
incapacitation for daily activities and consequent loss of independence and autonomy23.
Despite the limitations inherent to a cross-sectional study in terms of causality inferences and the expected biases (recall bias in relation to medicines), PNAUM produced new, consistent and nationally representative data on the prevalence of use of chronic-use medicines by
older adults, linked to speciic NCD. he results show an expressive drug use among older adults, with polypharmacy in a sixth of them, with regional diferences, and diferentiated
importance of some diseases, such as diabetes and heart diseases, in the amount of medicines
used. Although there are studies showing that the deleterious efects of polypharmacy would really start at 10 drugs a day, most studies deine polypharmacy with half that quantity25-27. A surprising inding is that only 10 medicines, all in the RENAME list, account for almost half of the reports of chronic use of medicines by older adults.
he use of chronic-use medicines by older adults is an important dimension to be considered
in the care of older adults, and polypharmacy appears as an indicator of need for safer and
more efective use of medicines, avoiding the risk of iatrogenic diseases, side efects and
worsened physical functioning5,26,27. Older adults with speciic diseases have risk factors for
polypharmacy which are modiiable by action aimed at the rational use of medicines. With
the current population aging and the successful drug access policy via SUS, the trend is for
drug use by older adults to grow further, potentially increasing costs, and thus should igure
as a priority in the planning agenda of SUS.
REFERENCES
2. Arrais PSD, Barreto ML, Coelho HLL. Aspectos dos processos de prescrição e dispensação de medicamentos na percepção do paciente: estudo de base populacional em Fortaleza, Ceará, Brasil. Cad Saude Publica. 2007;23(4):927-37. DOI:10.1590/S0102-311X2007000400020 3. Bertoldi AD, Barros AJ, Wagner A, Ross-Degnan D, Hallal PC. Medicine access and utilization
in a population covered by primary health care in Brazil. Health Policy. 2009;89(3):295-302. DOI:10.1016/j.healthpol.2008.07.00
4. Carvalho MF, Pascom ARP, Souza-Júnior PRB, Damacena GN, Szwarcwald CL. Utilization of medicines by the Brazilian population. Cad Saude Publica. 2005;21(suppl 1):S100-8. DOI:10.1590/S0102-311X2005000700011
5. Carvalho MFC, Romano-Lieber NS, Bergsten-Mendes G, Secoli SR, Ribeiro E, Lebrão ML et al. Polifarmácia entre idosos do Município de São Paulo: Estudo SABE. Rev Bras Epidemiol. 2012;15(4):817-27. DOI:10.1590/S1415-790X2012000400013
6. Chaimowicz F. A saúde dos idosos brasileiros às vésperas do século XXI: problemas, projeções e alternativas. Rev Saude Publica. 1997;31(2):184-200. DOI:10.1590/S0034-89101997000200014
7. Costa KS, Barros MBA, Francisco PMSB, César CLG, Goldbaum M, Carandina L. Utilização de medicamentos e fatores associados: um estudo de base populacional no Município de Campinas, São Paulo, Brasil. Cad Saude Publica. 2011;27(4):649-58. DOI:10.1590/S0102-311X2011000400004
8. Dal Pizzol TS, Pons ES, Hugo FN, Bozzetti MC, Sousa MLR, Hilgert JB. Uso de medicamentos entre idosos residentes em áreas urbanas e rurais de município no Sul do Brasil: um estudo de base populacional. Cad Saude Publica.2012;28(1):104-14. DOI:10.1590/S0102-311X2012000100011
9. Flores MF, Mengue SS. Uso de medicamentos em região do sul do Brasil. Rev Saude Publica.
2005;39(6):924-9. DOI:10.1590/S0034-89102005000600009
10. Flores VB, Benvegnu LA. Perfil de utilização de medicamentos em idosos da zona urbana de Santa Rosa, Rio Grande do Sul, Brasil. Cad Saude Publica. 2008;24(6):1439-46. DOI:10.1590/S0102-311X2008000600024
11. Galvão TF, Silva MT, Gross R, Pereira MG. Medication use in adults living in Brasilia, Brazil: a cross-sectional, population-based study. Pharmacoepidemiol Drug Saf. 2014;23(5):507-14. DOI:10.1002/pds.3583
12. Jörgensen T, Johansson S, Kennefalk A, Wallander MA, Svärdsudd K. Prescription drug use, diagnoses, and healthcare utilization among the elderly. Ann Pharmacother. 2001;35(9):1004-9.
DOI:10.1345/aph.10351
13. Lebrão ML, Duarte YEA. Saúde, bem-estar e envelhecimento: o Projeto Sabe no município de São Paulo: uma abordagem inicial. Brasília (DF): OPAS; 2003.
14. Loyola Filho AI, Uchoa E, Firmo JOA, Lima-Costa MF. Estudo de base populacional sobre o consumo de medicamentos entre idosos: Projeto Bambuí. Cad Saude Publica.
2005;21(2):545-53. DOI:10.1590/S0102-311X2005000200021
15. Marin MJS, Cecílio LCO, Perez AEWUF, Santella F, Silva CBA, Gonçalves Filho JR et al.
Caracterização do uso de medicamentos entre idosos de uma unidade do Programa de Saúde da Família. Cad Saude Publica. 2008;24(7):1545-55. DOI:10.1590/S0102-311X2008000700009 16. Mengue SS, Bertoldi AD, Boing AC, NUL Tavares, da Silva Dal Pizzol T, Oliveira MA, et al.
Pesquisa Nacional sobre Acesso, Utilização e Promoção do Uso Racional de Medicamentos (PNAUM): métodos do inquérito domiciliar. Rev Saude Publica. 2016;50(supl 2):4s.
17. Ministério da Saúde. Política nacional de medicamentos. Brasília (DF): Secretaria de Políticas de Saúde; 2001. (Série C. Projetos, programas e relatórios, Vol 25).
18. Ministério da Saúde; Organização Pan-Americana da Saúde. Avaliação da assistência farmacêutica no Brasil: estrutura, processo e resultados. Brasília (DF): Organização Pan-Americana da Saúde; 2005. (Medicamentos e outros insumos essenciais para a saúde, Vol 3).
19. Ministério da Saúde. Secretaria de Vigilância em Saúde. Departamento de Análise de Situação de Saúde. Saúde Brasil 2008: 20 anos de Sistema Único de Saúde (SUS) no Brasil. Brasília (DF): Ministério da Saúde; 2009. (Série G Estatística e Informação em Saúde)
21. Neves SJF, Marques APO, Leal MCC, Diniz AS, Medeiros TS, Arruda IKG. Epidemiologia do uso de medicamentos entre idosos em área urbana do Nordeste do Brasil. Rev Saude Publica.
2013;47(4):759-68. DOI:10.1590/S0034-8910.2013047003768
22. Payne RA, Abel GA, Avery AI, Mercer SW, Roland MO. Is polypharmacy always hazardous? A retrospective cohort analysis using linked electronic health records from primary and secondary care. Br J Clin Pharmacol. 2014;77(6):1073-82. DOI:10.1111/bcp.12292
23. Ramos LR, Veras RP, Kalache A. Envelhecimento populacional: uma realidade brasileira. Rev
Saude Publica. 1987;21(3):211-24. DOI:10.1590/S0034-89101987000300006
24. Ramos LR. Fatores determinantes do envelhecimento saudável em idosos residentes em centro urbano: Projeto Epidoso. Cad Saude Publica. 2003;19(3):793-8.
DOI:10.1590/S0102-311X2003000300011
25. Ribeiro AQ, Rozenfeld S, Klein CH, César CC, Acurcio FA. Inquérito sobre uso de medicamentos por idosos aposentados, Belo Horizonte, MG. Rev Saude Publica. 2008;42(4):724-32.
DOI:10.1590/S0034-89102008005000031
26. Rosenfeld S. Prevalência, fatores associados e mau uso de medicamentos entre os idosos: uma revisão. Cad Saude Publica. 2003;19(3):717-24. DOI:10.1590/S0102-311X2003000300004 27. Secoli SR. Polifarmácia: interações e reações adversas no uso de medicamentos por idosos. Rev
Bras Enferm. 2010;63(1):136-40. DOI:10.1590/S0034-71672010000100023
28. Silva AL, Ribeiro AQ, Klein CH, Acurcio FA. Utilização de medicamentos por idosos brasileiros, de acordo com a faixa etária: um inquérito postal. Cad Saúde Pública. 2012;28(6):1033-45. DOI:10.1590/S0102-311X2012000600003
29. Tavares NUL, Bertoldi AD, Thumé E, Facchini LA, França GVA, Mengue SS. Fatores associados à baixa adesão ao tratamento medicamentoso em idosos. Rev Saude Publica. 2013;47(6):1092-101. DOI:10.1590/S0034-8910.2013047004834
Funding: Department of Pharmaceutical Services and Strategic Health Supplies (DAF) and Department of Science and Technology (DECIT) of the Secretariat of Science, Technology and Strategic Inputs of the Brazilian Ministry of Health (Process 25000.111834/2, Decentralization of FNS Resources).
Authors’ Contributions: design, data interpretation and manuscript drafting: LRR, SSM. All authors participated in the methodology development and critical review of the manuscript: LRR, NULT, ADB, MRF, MAO, VLL, TSDP, PSDA, SSM. All authors approved the inal version of the manuscript and declare they are responsible for all aspects of the work, ensuring its accuracy and integrity.
Acknowledgments: Departments of Science and Technology (DECIT) and Pharmaceutical Services and Strategic Health Supplies (DAF) of the Secretariat of Science, Technology and Strategic Inputs (SCTIE) of the Brazilian Ministry of Health (MS) for funding and technical support to carry out the National Survey on Access, Use and Promotion of Rational Use of Medicines (PNAUM), and in particular the team that worked on data collection, herein represented by Professor Alexandra Crispim Boing, and the project’s statistical support team, by Amanda Ramalho Silva, Andréia Turmina Fontanella and Luciano S. P. Guimarães.