Patricia Constante JaimeI Iramaia Campos Ribeiro FigueiredoII
Erly Catarina de MouraI,III Deborah Carvalho MaltaIII,IV
I Núcleo de Pesquisas Epidemiológicas em Nutrição e Saúde. Universidade de São Paulo. São Paulo, SP, Brasil
II Programa de Pós-Graduação em Saúde Pública. Faculdade de Saúde Pública. Universidade de São Paulo, São Paulo, SP, Brasil
III Coordenação Geral de Doenças Crônicas não Transmissíveis. Secretaria de Vigilância em Saúde. Ministério da Saúde. Brasília, DF, Brasil
IV Departamento de Enfermagem Materno-Infantil e Saúde Pública. Escola de Enfermagem. Universidade Federal de Minas Gerais. Belo Horizonte, MG, Brasil Correspondence:
Patricia Constante Jaime Departamento de Nutrição Faculdade de Saúde Pública - USP Av. Dr. Arnaldo, 715
01246-904 São Paulo, SP Brasil E-mail: [email protected]
Received: 11/28/2008 Revised: 7/25/2009 Approved: 8/27/2009
Factors associated with fruit
and vegetable consumption in
Brazil, 2006
ABSTRACT
OBJECTIVE: To estimate the frequency of fruit and vegetable consumption and associated factors.
METHODS: A total of 54,369 individuals aged ≥ 18 years living in Brazilian state capitals and the federal district in 2006 were interviewed through the system Vigilância de Fatores de Risco e Proteção para Doenças Crônicas por Inquérito Telefônico (VIGITEL – telephone-based surveillance of risk and protective factors for chronic diseases). The food consumption indicators used were regular intake of fruits and vegetables (≥ 5 days/week) and adequate intake (≥ 5 times/day). The prevalence of the indicators and their confi dence intervals, stratifi ed according to sex, were calculated. To analyze associations between sociodemographic variables, crude odds ratios were calculated and then adjusted for sex, age, schooling level and marital status.
RESULTS: Less than half of the individuals said that they regularly consumed fruits (44.1%) or vegetables (43.8%), while 23.9% said they regularly consumed both fruits and vegetables. Adequate intake was reported by 7.3% of the interviewees. Fruit and vegetable consumption varied between the cities studied, was greater among women and increased with increasing age and schooling level.
CONCLUSIONS: Initiatives for promoting fruit and vegetable consumption need to address both the whole population and, especially, cities in the Northern and Northeastern regions of Brazil, young people, men and the population strata of low schooling level.
Fruits and vegetables are important components of a healthy diet and their consumption in adequate quan-tities may reduce the risk of cardiovascular diseases and some types of cancer.8 Estimates from the World Health Organization (WHO) indicate that insuffi cient consumption of fruits and vegetables is among the ten most important risk factors for the total overall disease burden worldwide.18 A minimum intake of 400 g of fruits and vegetables per day is considered suffi cient, and this is equivalent to fi ve portions of these foods.17
Fruits and vegetables are important foods because they are sources of micronutrients, fi bers and other compo-nents with functional properties.15 Furthermore, they are foods with low energy density, i.e. with few calo-ries in relation to the volume of the food consumed, which favors maintenance of healthy body weight.11
Promotion of fruit and vegetable consumption is in-dicated by WHO as a priority within nutritional, food and agricultural policies.19 To this end, at the start of the 2000s, the Brazilian government included this subject in its political and technical agenda. It became a signatory of the Global Strategy for promotion of healthy eating, physical activity and health20 and insti-tuted incentives for fruit and vegetable consumption, legitimated through the National Council for Food and Nutritional Security. This incentive had the aim of increasing the consumption, production and com-mercialization of these foods, within the perspective of health promotion and food and nutritional security as human rights.16
Knowledge of the frequency and distribution of fruit and vegetable consumption among the population, along with their determinants, is needed in order to direct national and local strategies for stimulating the consumption of these foods. The aim of the present study was to estimate the frequency of fruit and vege-table consumption and the factors associated with this.
METHODS
This was a cross-sectional study that presented esti-mates for indicators of fruit and vegetable consump-tion, derived from data from the system of telephone-based surveillance of risk and protective factors for chronic diseases (Vigilância de Fatores de Risco e Proteção para Doenças Crônicas por Inquérito Telefônico, VIGITEL).
VIGITEL is a monitoring system that was implement-ed by the Ministry of Health in 2006, with the main objective of continuously monitoring the frequency and distribution of risk factors and protective factors relating to chronic non-transmittable diseases among INTRODUCTION
the Brazilian population. Probabilistic samples of the population aged 18 years or over living in homes in Brazilian state capitals and the Federal District with at least one fi xed telephone line were studied. Sampling of at least 2,000 individuals per city was carried out using the complete electronic registration of fi xed res-idential telephone lines in each city. It involved draw-ing the lines (households) and one resident per line to be interviewed. Greater details regarding the sampling procedure are presented in another paper.10
The fruit and vegetable intake of 54,369 individuals was investigated by means of the following ques-tions: “How many days a week do you usually eat fruit?”; “On an ordinary day, how many times do you eat fruit?”; “How many days a week do you usually eat raw salad vegetables, such as lettuce, tomato or cucumber?”; “On an ordinary day, do you each raw salad vegetables with your lunch, dinner or both lunch and dinner?”; “How many days a week do you usu-ally eat cooked greens and vegetables, such as kale, carrot, christophine (chayote), aubergine (eggplant) or courgette (zucchini), without counting potato or man-ioc (cassava)?”; and, “On an ordinary day, do you eat cooked greens and vegetables with your lunch, dinner or both lunch and dinner?”.
From the responses given, four food indicators were created: regular fruit intake, with consumption on fi ve or more days a week; regular vegetable intake, with consumption on fi ve or more days a week; regular fruit and vegetable intake, i.e. the combination of the
fi rst two indicators; and adequate fruit and vegetable intake, when the consumption of these foods was fi ve or more times a day.
The sociodemographic variables studied were: sex, age group (18-24, 25-34, 35-44, 45-54, 55-64 and ≥ 65 years), schooling level (0-8, 9-11 and ≥ 12 years of study) and marital status (single, married or in a partnership, widowed, separated or divorced).
For the estimates of frequency of fruit and vegetable intake in the population aged 18 years and over in each city, weighting factors were used to equalize the sociodemographic composition of the sample with the composition observed in the demographic census of 2000 in the state capitals and Federal District.10
marital status. The SPSS software (version 13) was used, taking a signifi cance level of 5% and a confi -dence interval of 95%.
Because this survey consisted of telephone interviews, the free and informed consent form was replaced by verbal consent that was obtained at the time of the telephone contact with the interviewees. The project for implementation of VIGITEL was approved by the Ministry of Health’s National Ethics Committee for Research on Human Beings.
RESULTS
The indicators for fruit and vegetable intake were eval-uated among 54,369 individuals aged ≥ 18 years liv-ing in Brazilian state capitals and the Federal District, of whom 60.8% were women and 39.2% were men. Less than half of these individuals consumed fruits (44.1%) or vegetables (43.8%) on fi ve or more days a week, and less than a quarter (23.9%) declared that they regularly consumed both fruits and vegetables. Adequate consumption, i.e. fi ve or more times a day, was reported by 7.3% of the interviewees. Although the frequency of consumption of these groups of foods was signifi cantly greater among the women than among the men, the indicators showed that neither sex had suffi cient fruit and vegetable intake (Table 1).
The rate of regular fruit and vegetable intake varied greatly between different regions of the country. It was highest in the state capitals in the southern region (36.5%) and lowest in the state capitals of the northern region (11.9%). The city with the lowest frequency of consumption was Macapá (Amapá) (7.8%), while Porto Alegre (Rio Grande do Sul) presented the high-est frequency (38.6%) (Table 2).
Despite the regional differences, only a small pro-portion of the population living in the Brazilian state capitals reported adequate fruit and vegetable intake, ranging from 2.4% in Rio Branco (Acre) to 10.5% in Porto Alegre (Rio Grande do Sul). The pattern of high-er consumption among women was obshigh-erved in most of the state capitals, especially in relation to regular consumption of both fruits and vegetables (Table 2)
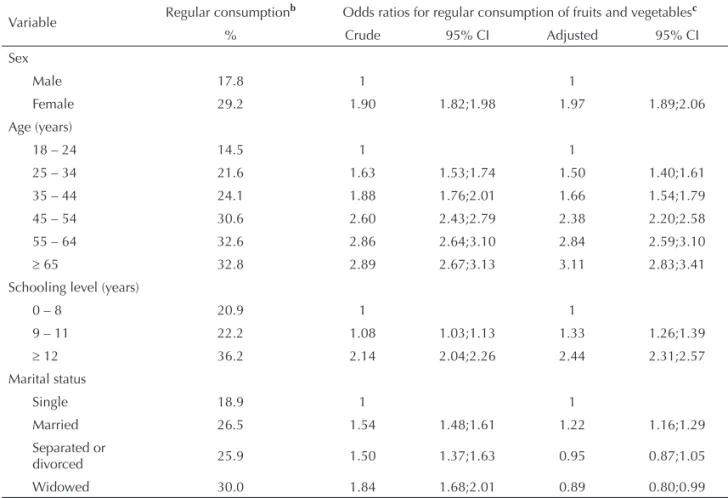
Table 3 shows the association observed between so-ciodemographic variables and the indicator of regular consumption of both fruits and vegetables. The fre-quency of regular consumption was higher among the women (29.2% versus 17.8% among the men). It in-creased with age, and was signifi cantly higher among individuals aged ≥ 65 years, in relation to young adults aged 18 to 24 years (adjusted odds ratio = 3.11). Higher frequency of consumption was shown to be di-rectly associated with schooling level. From analysis of the adjusted associations, the frequency of regular consumption of fruits and vegetables increased with individuals’ age and schooling level. In addition, mar-ried status was a factor independently associated with consumption of these foods.
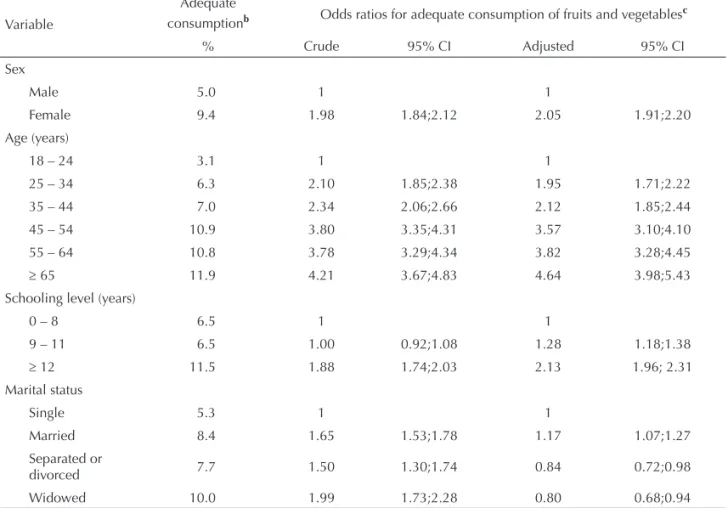
The associations between the sociodemographic vari-ables and adequate fruit and vegetable intake (fi ve or more times a day) did not differ from the pattern observed for the indicator of regular consumption (Table 4).
DISCUSSION
A minority of the individuals surveyed were following the nutritional recommendations established by WHO for fruit and vegetable consumption. This places Brazil
Table 1. Fruit and vegetable consumption according to sex.a Brazil, 2006. (N = 54,369)
Consumption indicator
Sex
Male Female p* Total
(n = 21,294) % (95% CI)
(n = 33,075) % (95% CI)
(n = 54,369) % (95% CI)
Regular fruit consumptionb 35.5 (34.9;36.1) 51.4 (50.8;51.9) <0.001 44.1 (43.6;44.5)
Regular vegetable consumptionc 39.5 (38.9;40.1) 47.4(46.8;48.0) <0.001 43.8 (43.4;44.2)
Regular fruit and vegetable
consumptiond 17.8 (17.3;18.2) 29.2 (28.6;29.6) <0.001 23.9 (23.5;24.2)
Adequate fruit and vegetable
consumptione 5.0 (4.7;5.2) 9.4 (9.0;9.7) <0.001 7.3 (7.1;7.6)
a Weighted percentage, to adjust the sociodemographic distribution of the VIGITEL sample to that of the population aged
≥18 years in each city, according to the 2000 demographic census.
b Fruit consumption on fi ve or more days a week.
c Vegetable consumption on fi ve or more days a week.
d Combined consumption of fruits and vegetables on fi ve or more days a week
e Combined consumption of fruits and vegetables fi ve or more times a day.
in a very unfavorable situation regarding comparisons with developed countries.2,4,12 Data from the Behavior Risk Factor Surveillance System showed that in the United States, adequate fruit and vegetable intake was achieved by around 25% of the population aged ≥18 years in 2007, ranging from 16.3% in Oklahoma to
32.5% in the District of Columbia.3 Thus, if
stimula-tion of consumpstimula-tion is one of the priority acstimula-tions on
the health promotion agenda, its implementation is a
great challenge, given the low frequency of fruit and
vegetable intake among the Brazilian population. Table 2. Percentage of individuals with regular and adequate consumption of fruits and vegetables, according to sex, in the
different regions and state capitals, and in the Federal District.a Brazil, 2006. (N = 54,369)
Region/City
Regular consumptionb Adequate consumptionc
Male Female Total Male Female Total
% % % % % %
Northern region 9.0 14.6* 11.9 2.6 3.6 3.2
Belém 6.4 14.2* 10.6 2.5 3.4 3.0
Boa Vista 9.7 14.0 11.9 1.8 3.5 2.6
Macapá 5.3 9.3 7.4 2.7 3.8 3.2
Manaus 10.5 12.0 11.3 2.8 3.6 3.2
Palmas 12.2 32.9* 22.6 3.6 4.9 4.3
Porto Velho 13.5 21.4** 17.5 3.1 5.1 4.1
Rio Branco 10.0 19.0** 14.4 2.2 2.6 2.4
Northeastern region 15.6 22.7* 19.5 3.4 4.8* 4.2
Aracaju 18.8 28.6* 24.2 2.2 5.5** 4.0
Fortaleza 16.8 21.6* 19.4 3.0 4.6** 3.9
João Pessoa 21.1 29.8* 25.9 3.1 5.1 4.1
Maceió 14.0 23.3* 19.0 2.6 4.0 3.4
Natal 15.6 27.4* 22.1 3.1 6.4** 4.9
Recife 17.1 23.3* 20.5 4.2 3.9 4.1
Salvador 13.3 21.1* 17.6 3.1 5.0** 4.2
São Luís 13.2 18.6** 16.2 4.6 4.8 4.7
Teresina 15.3 20.0 17.9 5.0 4.6 4.8
Southern region 28.6 43.3* 36.5 5.6 12.6* 9.4
Curitiba 28.1 40.6* 34.8 5.4 11.3* 8.5
Florianópolis 26.6 43.8* 35.6 5.3 11.6** 8.6
Porto Alegre 29.6 45.9* 38.6 6.0 14.2* 10.5
Southeastern region 17.8 31.1* 25.0 6.0 12.0* 9.2
Belo Horizonte 21.6 31.0* 26.7 8.0 9.1 8.6
Rio de Janeiro 16.0 25.0* 20.9 6.8 11.2* 9.2
São Paulo 17.9 34.7* 26.8 5.1 13.1* 9.4
Vitória 23.9 31.5 28.2 7.0 9.1 8.2
Central-western region 21.2 35.4* 28.7 5.1 10.2* 7.8
Brasília 24.8 36.1* 30.8 5.6 10.7* 8.3
Campo Grande 20.8 36.4* 29.0 2.9 7.5** 5.4
Cuiabá 15.3 27.4* 21.6 2.4 7.2** 4.9
Goiânia 17.3 36.8* 27.8 6.5 12.2* 9.6
Total 17.8 29.1* 23.9 5.0 9.4* 7.3
aWeighted percentage, to adjust the sociodemographic distribution of the VIGITEL sample to that of the population aged ≥18
years in each city, according to the 2000 demographic census.
b Combined consumption of fruits and vegetables on fi ve or more days a week.
c Combined consumption of fruits and vegetables fi ve or more times a day.
The estimates from the present study are consistent with those from previous studies that showed
insuf-fi cient fruit and vegetable intake among the Brazilian population. The results from the Family Budget Sur-vey of 2002-03, which provided information on aver-age availability of foods in the household, rather than individual food consumption, indicated that the aver-age availability of fruits and vegetables in Brazilian households was around one third of the recommenda-tions for consumption of these foods.7 A study based on the Brazilian data from the World Health Survey found that 41% of the adult individuals reported daily consumption of fruits and 30%, vegetables.5
The pattern of fruit and vegetable consumption dif-fered between Brazilian cities and population sub-groups according to sex, age and other sociodemo-graphic variables. Regional inequalities were also identifi ed in relation to household availability of fruits and vegetables in the Family Budget Survey,7 such that the availability was lower in the northern and northeastern regions of the country.
It was also observed that men and younger individuals consumed lower quantities of fruits and vegetables, thus confi rming the data from the World Health Sur-vey.5 Another Brazilian household survey, on risky behavior and reported morbidity due to non-transmit-table diseases and pathological conditions, carried out in 15 state capitals and the Federal District, showed a tendency towards increasing consumption of fruits and vegetables with age.a An association between con-sumption of these foods and sex was also observed in studies in other countries.1,4,13,14 This was also ob-served in relation to age: the estimated fruit and veg-etable intake was greater among older individuals in 14 regions in Africa, America, Europe and Asia.8
The positive association between age and fruit and vegetable consumption can be interpreted as a refl ec-tion of differences in the formaec-tion of dietary habits between generations. Older individuals formed their dietary habits during a period of the country’s history that was less marked by consumption of processed foods containing high levels of fat, sugar and salt,
a Instituto Nacional de Câncer. Inquérito domiciliar sobre comportamento de risco e morbidade referida de doenças e agravos não transmissíveis: Brasil, 15 capitais e Distrito Federal, 2002-2003. Rio de Janeiro; 2004.
Table 3. Odds ratios for regular consumption of fruits and vegetables, according to sociodemographic variables. Brazil, 2006.a
(N = 54,369)
Variable Regular consumption
b Odds ratios for regular consumption of fruits and vegetablesc
% Crude 95% CI Adjusted 95% CI
Sex
Male 17.8 1 1
Female 29.2 1.90 1.82;1.98 1.97 1.89;2.06
Age (years)
18 – 24 14.5 1 1
25 – 34 21.6 1.63 1.53;1.74 1.50 1.40;1.61
35 – 44 24.1 1.88 1.76;2.01 1.66 1.54;1.79
45 – 54 30.6 2.60 2.43;2.79 2.38 2.20;2.58
55 – 64 32.6 2.86 2.64;3.10 2.84 2.59;3.10
≥ 65 32.8 2.89 2.67;3.13 3.11 2.83;3.41
Schooling level (years)
0 – 8 20.9 1 1
9 – 11 22.2 1.08 1.03;1.13 1.33 1.26;1.39
≥ 12 36.2 2.14 2.04;2.26 2.44 2.31;2.57
Marital status
Single 18.9 1 1
Married 26.5 1.54 1.48;1.61 1.22 1.16;1.29
Separated or
divorced 25.9 1.50 1.37;1.63 0.95 0.87;1.05
Widowed 30.0 1.84 1.68;2.01 0.89 0.80;0.99
a Weighted percentage, to adjust the sociodemographic distribution of the VIGITEL sample to that of the population aged
≥18 years in each city, according to the 2000 demographic census.
b Combined consumption of fruits and vegetables on fi ve or more days a week.
and by scarcity of complex carbohydrates, fi bers and micronutrients. The higher consumption of fruits and vegetables among individuals of more advanced age may also be related to the care taken regarding their health, in following the guidance received at health-care services. Such guidance is sought more often because of the increasing prevalence of chronic non-transmittable diseases with increasing age.
The sociodemographic indicator used to estimate social differences was individuals’ schooling level. This was associated positively and independently with fruit and vegetable consumption. Data on indi-viduals’ income and purchasing power are not avail-able within the VIGITEL system. Jaime & Monteiro5 found that schooling level had an independent effect on fruit and vegetable consumption, in an analysis controlled using possession of household goods (as an indicator for income level). Thus, actions that expand the population’s knowledge regarding the importance that consumption of these foods has for health may increase their consumption. This was shown in a community-based trial evaluating the immediate
impact of an educational nutritional intervention for increasing the participation of fruits and vegetables in the diet of families living in a poor district of the municipality of São Paulo.6
One of the limitations of the present study was the possibility of measurement bias, given that VIGITEL did not include individuals living in households with-out a fi xed telephone. With the aim of attenuating such bias, weightings were introduced to equalize the so-ciodemographic composition of the VIGITEL sample studied with the composition found through the 2000 demographic census in the 27 cities studied.
Another limitation relates to the differences in the methods for evaluating diet and defi ning and catego-rizing fruits and vegetables, which impaired compari-sons between studies on population-based intake of these foods. Finally, the indicator for adequacy of fruit and vegetable intake was defi ned as daily consump-tion of these foods at least fi ve times, starting from questions on how many meals the individual had on an ordinary day and, in the case of vegetables, with direct reference to the main meals (lunch and dinner).
Table 4. Odds ratios for adequate consumption of fruits and vegetables, according to sociodemographic variables. Brazil,
2006.a (N = 54,369)
Variable
Adequate
consumptionb Odds ratios for adequate consumption of fruits and vegetablesc
% Crude 95% CI Adjusted 95% CI
Sex
Male 5.0 1 1
Female 9.4 1.98 1.84;2.12 2.05 1.91;2.20
Age (years)
18 – 24 3.1 1 1
25 – 34 6.3 2.10 1.85;2.38 1.95 1.71;2.22
35 – 44 7.0 2.34 2.06;2.66 2.12 1.85;2.44
45 – 54 10.9 3.80 3.35;4.31 3.57 3.10;4.10
55 – 64 10.8 3.78 3.29;4.34 3.82 3.28;4.45
≥ 65 11.9 4.21 3.67;4.83 4.64 3.98;5.43
Schooling level (years)
0 – 8 6.5 1 1
9 – 11 6.5 1.00 0.92;1.08 1.28 1.18;1.38
≥ 12 11.5 1.88 1.74;2.03 2.13 1.96; 2.31
Marital status
Single 5.3 1 1
Married 8.4 1.65 1.53;1.78 1.17 1.07;1.27
Separated or
divorced 7.7 1.50 1.30;1.74 0.84 0.72;0.98
Widowed 10.0 1.99 1.73;2.28 0.80 0.68;0.94
a Weighted percentage, to adjust the sociodemographic distribution of the VIGITEL sample to that of the population aged
≥18 years in each city, according to the 2000 demographic census.
b Combined consumption of fruits and vegetables fi ve or more times a day.
The fruit and vegetable intake recommendations from WHO,17 which are reproduced in the Dietary Guide for the Brazilian Populationa are expressed in grams and portions. In the VIGITEL system, the questions relate to the number of times a day and not to the quantity (grams or portions) of fruits and vegetables consumed per day. This difference in the consumption measurement may have led to over or underestima-tion of the individuals’ classifi cation for this indicator. This would have resulted from ignoring the consump-tion of more than one porconsump-tion of fruit or vegetable at the same meal and consumption of vegetables outside of the main meals. Although this does not form part of Brazilian dietary habits, it could occur among indi-viduals with other dietary infl uences or with different dietary habits.
A previous study on the validity of indicators for food and drink intake derived from VIGITEL data found moderate reproducibility (kappa coeffi cient = 0.57), sensitivity of 46.4% and specifi city of 71.6% for fruit and vegetable consumption, taking the reference point of the individuals’ classifi cation from three 24-hour dietary recalls.9 These data confi rm that there is a need to deepen the investigations on these questions, to take into account regional differences and
seasonal-ity. Nonetheless, despite the limitations identifi ed, the results from the present study are generally consistent with fi ndings in the literature.
Continuous and comparable collection of informa-tion on fruit and vegetable consumpinforma-tion, as provided through the VIGITEL system, enables assessment of the impact of programs and initiatives for promoting the consumption of these foods among the Brazilian population. In this respect, programs for promoting fruit and vegetable consumption have been evaluated based on information provided through the telephone-based risk factor monitoring system (Behavioral Risk Factor Surveillance System) in the United States. These assessments have indicated that initiatives de-veloped since the start of the 1990s with the aim of in-creasing the fruit and vegetable intake, have failed.2,13
It is concluded that initiatives for promoting fruit and vegetable consumption in Brazil, aimed at the gen-eral population, need to be implemented, given that the consumption is below the current recommenda-tions. However, special attention needs to be given to the cities of the northern and northeastern regions, to young adults, to men and to population strata present-ing low schoolpresent-ing levels.
1. Baker AH, Wardle J. Sex differences in fruit
and vegetable intake in older adults. Appetite.
2003;40(3):269-75. DOI:10.1016/S0195-6663(03)00014-X
2. Centers for Disease Control and Prevention. Fruit and vegetable consumption among adults – United
States, 2005. MMWR Morb Mortal Wkly Rep.
2007;56(10):213-7.
3. Centers for Disease Control and Prevention. Behavior Risk Factor Surveillance System - BRFSS.About the BRFSS. Atlanta; 2007[citado 2009 ago 25]. Disponível em: http://apps.nccd.cdc.gov/brfss
4. Giskes K, Turrell G, Patterson C, Newman B. Socio-economic differences in fruit and vegetable consumption among Australian adolescents and adults. Public Health Nutr. 2002; 5(5):663-9. DOI:10.1079/ PHN2002339
5. Jaime PC, Monteiro CA. Fruit and vegetable intake
by Brazilian adults, 2003. Cad Saude Publica.
2005;21(Supl):19-24. DOI:10.1590/S0102-311X2005000700003
6. Jaime PC, Machado FMS, Westphal MF, Monteiro CA. Educação nutricional e consumo de frutas e
hortaliças: ensaio comunitário controlado. Rev Saude
Publica. 2007;41(1):154-7. DOI:10.1590/S0034-89102006005000014
7. Levy-Costa RB, Sichieri R, Pontes NS, Monteiro CA. Disponibilidade domiciliar de alimentos no Brasil:
distribuição e evolução (1974-2003). Rev Saude
Publica. 2005;39(4):530-40. DOI:10.1590/S0034-89102005000400003
8. Lock K, Pomerleau J, Causer L, Altmann DR, McKee M. The global burden of disease attributable to low consumption of fruit and vegetables: implications
for the global strategy on diet. Bull World Health
Organ. 2005;83(2):100-8. DOI: 10.1590/S0042-96862005000200010
9. Monteiro CA, Moura EC, Jaime PC, Claro RM. Validade de indicadores do consumo de alimentos e
bebidas obtidos por inquérito telefônico. Rev Saude
Publica. 2008;42(4):582-9. DOI:10.1590/S0034-89102008000400002
10. Moura EC, Morais Neto OL, Moura L, Silva NN, Bernal R, Claro RM, Monteiro CA. Vigilância de fatores de risco para doenças crônicas por inquérito telefônico nas capitais dos 26 estados brasileiros e no Distrito
Federal (2006). Rev Bras Epidemiol. 2008;11(Supl 1):
20-37. DOI:10.1590/S1415-790X2008000500003
11. Rolls BJ, Ello-Martin JA, Tohill BC. What can intervention studies tell us about the relationship between fruit and vegetable consumption and
weight management? Nutr Rev. 2004;62(1):1-17.
DOI:10.1111/j.1753-4887.2004.tb00001.x
12. Roos G, Johansson L, Kasmel A, KlumbienéJ, Prättälä R. Disparities in vegetables and fruit consumption:
European cases from the north to the south. Public
Health Nutr. 2001;4(1):35-43. DOI:10.1079/ PHN200048
13. Serdula MK, Gillespie C, Kettel-Khan L, Farris R, Seymour J, Denny C. Trends in fruit and vegetable consumption among adults in the United States: behavioral risk factor surveillance system, 1994-2000. Am J Public Health. 2004;94(6):1014-8. DOI:10.2105/ AJPH.94.6.1014
14. Thompson B, Demark-Wahnefried W, Taylor G, McClelland JW, Stables G, Havas S, et al. Baseline fruit and vegetable intake among adults in seven 5 a day
study centers located in diverse geographic areas. J Am
Diet Assoc. 1999;99(10):1241-8. DOI:10.1016/S0002-8223(99)00306-5
15. Van Duyn MAS, Pivonka E. Overview of the health benefi ts of fruit and vegetable consumption for the
dietetics professional: selected literature. J Am Diet
Assoc. 2000;100(12):1511-21. DOI:10.1016/S0002-8223(00)00420-X
16. Vasconcelos AB. O incentivo ao consumo de frutas, legumes e verduras: perspectivas Brasil, 2005. In: Organização Mundial da Saúde. Workshop de Lisboa sobre a promoção de hortofrutícolas nos países de expressão portuguesa. Relatório de um workshop conjunto. Lisboa; 2006.
17. World Health Organization. Diet, Nutrition and the Prevention of Chronic Diseases. Report of a Joint WHO/FAO Expert Consultation, Geneva, 28 January - 1 February 2002. Geneva; 2002. (WHO Technical Report Series, 916).
18. World Health Organization. The world health report 2002. Reducing risks, promoting healthy life. Geneva; 2002.
19. World Health Organization. Fruit and vegetables for health. Report of a Joint FAO/WHO Workshop, 1-3 September 2004, Kobe, Japan. Kobe; 2004.
20. World Health Organization. Global strategy on diet, physical activity and health. Fifty-seventh World Health Assembly. Geneva; 2004.
REFERENCES
This article underwent the peer review process adopted for any other manuscript submitted to this journal, with anonymity guaranteed for both authors and reviewers. Editors and reviewers declare that there are no confl icts of interest that could affect their judgment with respect to this article.