Risk and protection factors for
chronic non communicable
diseases by telephone survey –
VIGITEL Brazil – 2009
Fatores de risco e proteção para
doenças crônicas não transmissíveis
obtidos por inquérito telefônico –
VIGITEL Brasil – 2009
Betine Pinto Moehlecke IserI,II Rafael Moreira ClaroIII
Erly Catarina de MouraIII
Deborah Carvalho MaltaI,IV
Otaliba Libânio Morais NetoV
I Communicable Diseases and Conditions General Coordination –Health
Situation Analysis Department – Health Surveillance Secretariat – Ministry of Health – Brasília (DF), Brazil
IIUniversidade Federal do Rio Grande do Sul (UFRGS) – Porto Alegre (RS), Brazil
IIINúcleo de Pesquisas Epidemiológicas em Nutrição e Saúde (NUPENS) – Universidade de São Paulo (USP) – São Paulo (SP), Brazil
IVUniversidade Federal de Minas Gerais (UFMG) – Belo Horizonte (MG), Brazil
Health Situation Analysis Department V – Health Surveillance Secretariat –
Ministry of Health – Brasília (DF), Brazil
Study carried out at the Health Surveillance Secretariat, of the Ministry of Health, andFaculdade de Saúde Pública ofUniversidade de São Paulo (USP)
Financial Support: none.
Correspondence to: Deborah Carvalho Malta – Ministry of Health – Health Surveillance Secretariat – SAF Sul – Trechos 02 – Lotes 05/06 – Bloco F – Torre 1 – Edifício Premium – Térreo – Sala 14 – CEP: 70070-600 – Brasília (DF), Brazil – E-mail: [email protected]
Conflict of interest: nothing to declare.
Abstract
Objective: To describe the risk and protec-tion factors for non communicable diseases with data from Telephone-based Surveil-lance of Risk and Protective Factors for Chronic Diseases (VIGITEL) in 2009. Methodology: he prevalence of main risk and protective factors was estimated in adults (≥18 years old), by telephone surveys in a probabilistic sample of the population covered by landline telephones in Brazilian state capitals and the Federal District, strati-ied by gender, age and schooling. Results: Data from 54,367 adults were collected. Smokers and former smokers represented 15.5 and 22% of Brazilian adults, respective-ly. Excess weight afected 46.6% of adults; 33% reported the consumption of meat with visible fat and reported 18.9% alcohol abuse. hese factors were more prevalent among men and, in general, young adults and people with low schooling. he preva-lence of physical activity in leisure was 18.8% (95%CI 17.4–20.1) among men and 11.3% (95%CI 10.6–12.0) among women. Physical inactivity afected 15.6% of popula-tion and increased with age. Consumppopula-tion of fruits and vegetables and physical activity in leisure time were more prevalent in men and women with 12 years of schooling or more. Hypertension diagnosis was reported by 21.1% (95%CI 19.6–22.5) of men, and 27.2% (95%CI 25.8–28.5) of women. Preva-lence of diabetes was 5.8%. Conclusion: he results point to diferent health behavior according to gender, age and schooling of the population and reinforce the decreasing smoking trend and increasing overweight trend in Brazil.
Introduction
Chronic non-communicable dis-eases (CNCDs) – cardiovascular disdis-eases, cancer, chronic respiratory disease, dia-betes and musculoskeletal diseases, among others – share their long natural history and some mutable and immutable behavioral risk factors. Epidemiological analyses indicate that this set of behavioral risk factors is responsible for most deaths caused by CNCD and by a substantial fraction of disease load due to such dis-orders1. Smoking, alcohol abuse, obesity, dyslipidemia, insuicient intake of fruits and vegetables and physical inactivity are prevalent, among others.
he prevention and control of CNCD and its behavioral risk factors are essential to avoid the epidemic increase of such dis-eases and their severe consequences to the quality of life of subjects, because, besides causing premature deaths, chronic dis-eases cause adverse economic efects to the families, communities, society in itself and the health system of the country2.
In order to plan actions to promote health and establish programs that are directed to the reduction of morbidity and mortality caused by chronic diseases, it is essential to know about the health status of the population. herefore, population surveys have been an important tool for health surveillance, since they provide information on reported morbidity and lifestyles, which is not captured by the mortality information system (SIM) and the hospital admission information system (SIH)3.
here are diferent approaches to measure health behaviors in the popu-lation, and the method of choice depends not only on the objective of the study, but also on the cost, number of professionals and time required to collect and analyze data requested to collect and analyze data4. Due to the high cost of household surveys and research involving physical examinations and blood drawing, signif-icant number of health surveys have been
Resumo
Objetivo: Descrever os fatores de risco e proteção para doenças crônicas não trans-missíveis resultantes do Sistema de Vigilân-cia por Inquérito Telefônico (VIGITEL) em 2009. Metodologia: Prevalências dos principais fatores de risco e proteção foram estimadas na população ≥18 anos a partir de entrevistas telefônicas em amostras proba-bilísticas da população coberta por telefo-nia ixa nas capitais de estados do Brasil e no Distrito Federal, segundo sexo, faixa etária e escolaridade. Resultados: Foram realizadas 54.367 entrevistas. Fumantes e ex-fumantes corresponderam a 15,5e 22% da população adulta brasileira, respectivamente. O exces-so de peexces-so atinge 46,6% dos adultos; 33% relataram consumo de carne com gordura e 18,9% airmaram consumir bebida alcoó-lica de forma abusiva. Tais fatores de risco são mais prevalentes em homens e em geral nos indivíduos jovens e de menor escola-ridade. A prevalência de atividade física no lazer é de 18,8% (IC95% 17,4–20,1) em homens e de 11,3% (IC95% 10,6–12,0) nas mulheres. A inatividade física atinge 15,6% da população e aumenta com a idade. O consumo de frutas, legumes e verduras e a atividade física no lazer são mais frequentes em homens e mulheres com mais anos de estudo. Diagnóstico de hipertensão arterial foi referido por 21,1% (IC95% 19,6–22,5) dos homens e 27,2% (IC95% 25,8–28,5) das mulheres. A prevalência de diabetes foi de 5,8%. Conclusão: Os resultados apontaram comportamentos em saúde distintos de acordo com o sexo, idade e escolaridade da população e reforçam a tendência de queda do tabagismo e aumento no excesso de peso no Brasil.
based on self-reported information5,6. Likewise, the application of telephone surveys has increased, with the advantage of using computers to speed the process of data collection and analysis4,7. he most famous experience came from the United States, with the creation of the Behavioral Risk Factors Surveillance System(BRFSS), in 1984, which encouraged speciic studies in diferent ields of health8.
According to this worldwide trend, the Ministry of Health established the Telephone-based Surveillance of Risk and Protective Factors for Chronic Diseases (VIGITEL) in Brazil, in 2006, comprising state capitals and the Federal District. he system consists of computer-assisted tele-phone interviews (CATI). his system is annual and continuous in order to enable the monitoring and analysis regarding the trends of the main risk and protective factors of chronic diseases and reported morbidity in Brazil9, as well as the monitoring of public policies addressed to the reduction of risk factors and chronic diseases.
he objective of this study was to describe the main risk and protective factors of CNCD found in the adult popu-lation (aged 18 years or older in 2009, living in the set of state capitals and the Federal District, according to socio-demographic characteristics.
Methods
VIGITEL is based on probabilistic samples of the adult population (aged 18 years or more) living in the state capitals or the Federal District as to the coverage of landline telephone lines in each location. Annually, 5,000 telephone lines are ran-domly drawn in each location, which are divided into replicates (or subsamples) of 200 lines each, in order to identify eligible lines, that is, active and landline telephone lines. For each eligible phone line, by which an adult living in the household was contacted and who agreed to participate in the study one of the adults is randomly selected for the interview10.
In 2009, VIGITEL comprised 94 ques-tions divided into the following topics: demographic and socioeconomic char-acteristics, eating patterns and physical activity, reported height and weight, smoking and alcohol consumption, self-evaluation on health status and reported morbidity. he questions appeared on the computer screen and the respective answers were immediately registered. It was possible to automatically advance in non-valid questions from previous responses.
his study assessed the frequency of the main indicators related to chronic diseases in adults in the Brazilian state capitals and Federal District in 2009.
Protective factors were: regular (5 days a week or more) or recommended intake (5 daily servings, 5 days a week or more) of fruit, vegetables and legumes; regular consumption of beans (5 days a week or more); physical activity in the leisure time (light or moderate physical activity, such as hiking, treadmill walking, weight lifting, hydro-gymnastics, gymnastics, swimming, martial arts, bicycling, volleyball or others, for at least 30 minutes a day, 5 days a week or more; or intense activities, such as running, treadmill running, aerobic gymnastics, soccer, basketball or tennis, at least 20 minutes a day, 3 days a week or more)11.
Prevalence estimates and respective 95% conidence intervals (95%CI) were calculated by gender, age and schooling. Data analysis was conducted with the Stata 9.2 program, based on weighting factors that considered the highest probability that individuals with more telephone lines or less inhabitants in the household had to participate in the sample, besides correcting the overestimation or under-estimation of VIGITEL, which would be a result from an unequal coverage of landline telephone lines in the studied locations, according to socio-demographic strata and the size of the sample in each city. A detailed description of methodological aspects regarding VIGITEL is found in Moura et al.9.
Results
In 2009, a total of 54,367 adults par-ticipated in VIGITEL, accounting for 21,347 men and 33,020 women. he mean duration of the interview was 11 minutes. he average success rate was 76.5%, and refusal rate of 3%11.
he frequency of risk and protective factors for the total population and genders, separately, are presented in Table 1. he prevalence of smokers, former smokers and passive smokers in the workplace was higher among males. Men also pre-sented a higher frequency of excess weight,
consumption of soft drinks and artiicial juices, consumption of meat and excess fat and alcohol abuse. Women, on the other hand, presented a higher frequency of self-reported poor health status, besides more medical diagnoses of arterial hyper-tension and dyslipidemia. Among pro-tective factors, men reported consuming more beans (5 days a week or more) and performance of suicient physical activity in their leisure, while women showed the more frequent intake of fruits, vegetables and legumes. he prevalence of passive smokers in the household, obesity, physical inactivity and diagnoses of diabetes and dyslipidemia did not present signiicant diferences among genders (Table 1).
Other behavioral diferences related to health were demonstrated by the stratiied analysis of risk and protective factors as to age group and schooling (Tables 2-4).
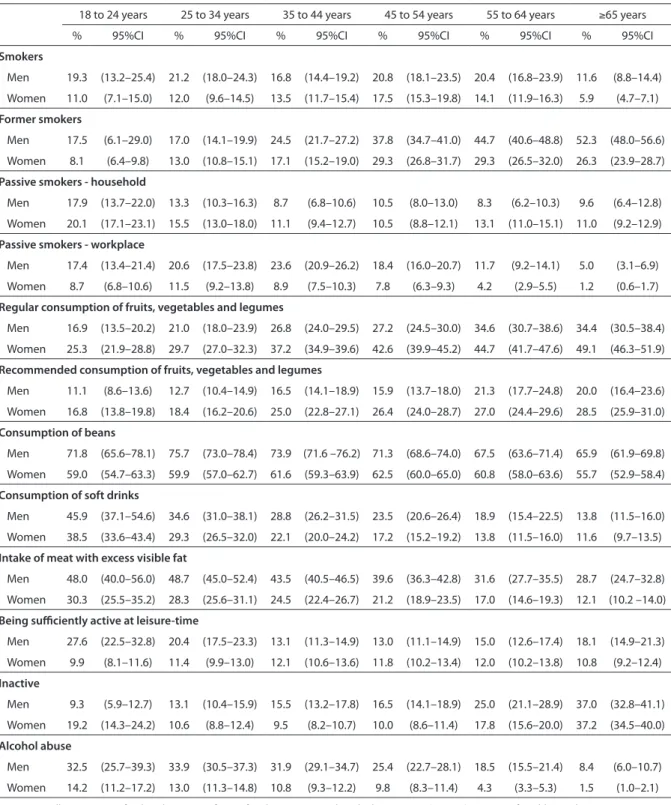
In both genders, the prevalence of smokers is lower among the elderly (≥65 years old), when the prevalence of former smokers is maximum. he prevalence of passive smokers in the household is higher among youngsters, while the percentage of passive smokers in the workplace reaches higher rates among individuals at repro-ductive age (Table 2).
Generally speaking, a higher frequency of protective factors was observed with increasing age, such as the regular and rec-ommended intake of fruits, vegetables and legumes, the decreased frequency of risk factors, such as intake of soft drinks, meat with visible excess fat and alcohol abuse, for both genders (Table 2). However, physical inactivity mostly afects older women and men; the latter presented lower rates of physical activity in their leisure. In all age groups, the consumption of beans is higher among men.
hypertension, diabetes, heart diseases and dyslipidemia (Table 3).
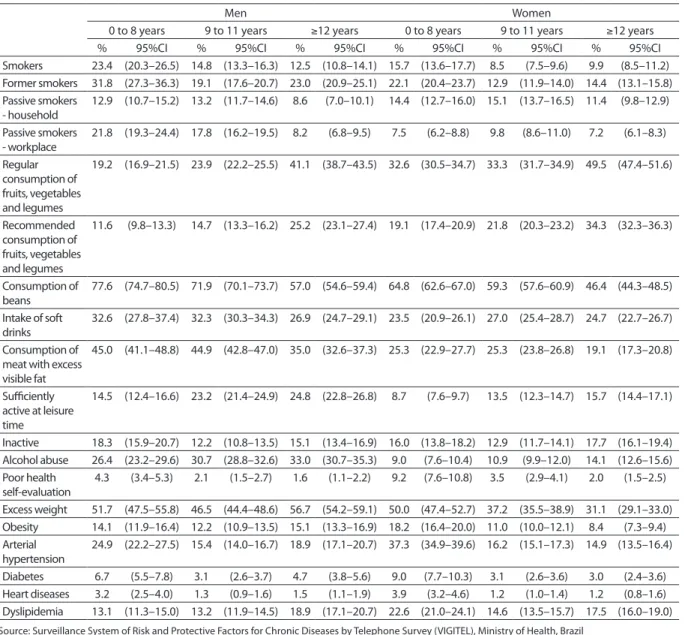
Generally, higher frequencies of pro-tective factors and lower rates of risk factors of CNCD were observed among individuals with a higher level of education, with some exceptions and diferences among genders (Table 4). he prevalence of men and women who smoke is higher for individuals with up to eight years of schooling, which decreases with nine years of schooling or
more, opposite to the frequency of former smokers. he reduction in the frequency of passive smokers in the household and workplace only occurs among individuals with 12 or more years of schooling in both genders.
he regular and recommended con-sumption of fruits, vegetables and legumes and alcohol abuse were higher with the increase in school years. However, there was an inverse relation between the regular Table 1. Frequency* of risk and protective factors of non communicable chronic diseases in adults by sex, in the Brazilian State Capitals and Federal District (VIGITEL, Brazil – 2009)
Tabela 1. Frequência* (%) de fatores de risco e proteção para doenças crônicas em adultos, por sexo, no conjunto das capitais
do Brasil e no Distrito Federal (VIGITEL –2009)
Source: Surveillance System of Risk and Protective factors for Chronic Diseases by Telephone Survey (VIGITEL), Ministry of Health, Brazil
*Weighted proportion according to the 2000 Census sociodemographic distribution of the adult population in each given State capital; 95%CI – 95% confi-dence interval; p-value=0.05, considering design effect of the study
Fonte: MS/SVS/CGDANT – VIGITEL – Vigilância de Fatores de Risco e Proteção para Doenças Crônicas por Inquérito Telefônico
*Percentuais ponderados para ajustar a distribuição sócio-demográfica da amostra VIGITEL à distribuição da população adulta de cada cidade no Censo Demográfico de 2000 e para levar em conta o peso populacional de cada cidade; IC 95% – Intervalo de confiança (p=0,05), levando-se em consideração o efeito do desenho do estudo
Variables
Sex
Total Male Female
n=54,367 n=21,347 n=33,020
% 95%CI % 95%CI % 95%CI
Smoking
Current smokers 15.5 14.5–16.5 19.0 17.3–20.8 12.5 11.4–13.7
Former smokers 22.0 20.6–23.3 26.6 24.0–29.2 18.0 17.1–19.0
Passive smokers in the household 13.3 12.4–14.1 12.2 10.9–13.5 14.1 13.1–15.1 Passive smokers in the workplace 12.8 12.1–13.6 18.3 16.9–19.8 8.2 7.3–9.0 Nutritional status
Excess weight 46.6 45.2–48.0 51.0 48.7–53.4 42.3 40.8–43.8
Obesity 13.9 13.1–14.7 13.7 12.4–15.0 14.0 13.1–15.0
Diet
Regular intake of fruits, vegetables and legumes 30.4 29.3–31.4 24.3 22.8–25.8 35.5 34.3–36.8 Recommended fruits, vegetables and legume
consumption 18.9 18.1–19.7 14.8 13.7–16.0 22.4 21.3–23.5
Consumption of beans 65.8 64.7–66.9 72.4 70.7–74.2 60.1 58.8–61.5 Intake of soft drinks or artificial juices 27.9 26.4–29.4 31.5 28.8–34.3 24.8 23.3–26.3 Consumption of meat with visible fat 33.0 31.8–34.2 43.2 41.1–45.4 24.3 22.9–25.7 Physical activity
Sufficiently active during leisure time (leisurer)c 14.7 14.0–15.5 18.8 17.4–20.1 11.3 10.6–12.0
Inactived 15.6 14.7–16.5 16.0 14.6–17.3 15.3 14.1–16.6
Alcohol abuse 18.9 17.9–19.9 28.8 26.9–30.7 10.4 9.6–11.3
Poor health self-evaluation 4.9 4.3 - 5.4 3.2 2.7–3.8 6.3 5.4–7.2 Reported morbidity
Arterial hypertension 24.4 23.3–25.4 21.1 19.6–22.5 27.2 25.8–28.5
Diabetes 5.8 5.3–6.3 5.3 4.6–5.9 6.2 5.5–6.9
Heart diseases 2.5 2.2–2.8 2.4 1.9–2.8 2.6 2.2–3.0
Source: Surveillance System of Risk and Protective factors for Chronic Diseases by Telephone Survey (VIGITEL), Ministry of Health, Brazil
*Weighted proportion according to the 2000 Census sociodemographic distribution of the adult population in each given State capital; 95%CI – 95% confi-dence interval; p-value=0.05, considering design effect of the study
Fonte: MS/SVS/CGDANT – VIGITEL – Vigilância de Fatores de Risco e Proteção para Doenças Crônicas por Inquérito Telefônico
*Percentuais ponderados para ajustar a distribuição sócio-demográfica da amostra VIGITEL à distribuição da população adulta de cada cidade no Censo Demográfico de 2000 e para levar em conta o peso populacional de cada cidade; IC 95% – Intervalo de confiança (p=0,05), levando-se em consideração o efeito do desenho do estudo
Table 2. Frequency* of risk and protective factors of non communicable chronic diseases in adults by sex and age group, in the Brazilian State Capitals and Federal District (VIGITEL, Brazil – 2009)
Tabela 2. Frequência* (%) de fatores de risco e proteção para doenças crônicas em adultos, por sexo e faixa etária, no conjunto
das capitais do Brasil e no Distrito Federal (VIGITEL – 2009)
18 to 24 years 25 to 34 years 35 to 44 years 45 to 54 years 55 to 64 years ≥65 years
% 95%CI % 95%CI % 95%CI % 95%CI % 95%CI % 95%CI
Smokers
Men 19.3 (13.2–25.4) 21.2 (18.0–24.3) 16.8 (14.4–19.2) 20.8 (18.1–23.5) 20.4 (16.8–23.9) 11.6 (8.8–14.4)
Women 11.0 (7.1–15.0) 12.0 (9.6–14.5) 13.5 (11.7–15.4) 17.5 (15.3–19.8) 14.1 (11.9–16.3) 5.9 (4.7–7.1)
Former smokers
Men 17.5 (6.1–29.0) 17.0 (14.1–19.9) 24.5 (21.7–27.2) 37.8 (34.7–41.0) 44.7 (40.6–48.8) 52.3 (48.0–56.6)
Women 8.1 (6.4–9.8) 13.0 (10.8–15.1) 17.1 (15.2–19.0) 29.3 (26.8–31.7) 29.3 (26.5–32.0) 26.3 (23.9–28.7)
Passive smokers - household
Men 17.9 (13.7–22.0) 13.3 (10.3–16.3) 8.7 (6.8–10.6) 10.5 (8.0–13.0) 8.3 (6.2–10.3) 9.6 (6.4–12.8)
Women 20.1 (17.1–23.1) 15.5 (13.0–18.0) 11.1 (9.4–12.7) 10.5 (8.8–12.1) 13.1 (11.0–15.1) 11.0 (9.2–12.9)
Passive smokers - workplace
Men 17.4 (13.4–21.4) 20.6 (17.5–23.8) 23.6 (20.9–26.2) 18.4 (16.0–20.7) 11.7 (9.2–14.1) 5.0 (3.1–6.9)
Women 8.7 (6.8–10.6) 11.5 (9.2–13.8) 8.9 (7.5–10.3) 7.8 (6.3–9.3) 4.2 (2.9–5.5) 1.2 (0.6–1.7)
Regular consumption of fruits, vegetables and legumes
Men 16.9 (13.5–20.2) 21.0 (18.0–23.9) 26.8 (24.0–29.5) 27.2 (24.5–30.0) 34.6 (30.7–38.6) 34.4 (30.5–38.4)
Women 25.3 (21.9–28.8) 29.7 (27.0–32.3) 37.2 (34.9–39.6) 42.6 (39.9–45.2) 44.7 (41.7–47.6) 49.1 (46.3–51.9)
Recommended consumption of fruits, vegetables and legumes
Men 11.1 (8.6–13.6) 12.7 (10.4–14.9) 16.5 (14.1–18.9) 15.9 (13.7–18.0) 21.3 (17.7–24.8) 20.0 (16.4–23.6)
Women 16.8 (13.8–19.8) 18.4 (16.2–20.6) 25.0 (22.8–27.1) 26.4 (24.0–28.7) 27.0 (24.4–29.6) 28.5 (25.9–31.0)
Consumption of beans
Men 71.8 (65.6–78.1) 75.7 (73.0–78.4) 73.9 (71.6 –76.2) 71.3 (68.6–74.0) 67.5 (63.6–71.4) 65.9 (61.9–69.8)
Women 59.0 (54.7–63.3) 59.9 (57.0–62.7) 61.6 (59.3–63.9) 62.5 (60.0–65.0) 60.8 (58.0–63.6) 55.7 (52.9–58.4)
Consumption of soft drinks
Men 45.9 (37.1–54.6) 34.6 (31.0–38.1) 28.8 (26.2–31.5) 23.5 (20.6–26.4) 18.9 (15.4–22.5) 13.8 (11.5–16.0)
Women 38.5 (33.6–43.4) 29.3 (26.5–32.0) 22.1 (20.0–24.2) 17.2 (15.2–19.2) 13.8 (11.5–16.0) 11.6 (9.7–13.5)
Intake of meat with excess visible fat
Men 48.0 (40.0–56.0) 48.7 (45.0–52.4) 43.5 (40.5–46.5) 39.6 (36.3–42.8) 31.6 (27.7–35.5) 28.7 (24.7–32.8)
Women 30.3 (25.5–35.2) 28.3 (25.6–31.1) 24.5 (22.4–26.7) 21.2 (18.9–23.5) 17.0 (14.6–19.3) 12.1 (10.2 –14.0)
Being sufficiently active at leisure-time
Men 27.6 (22.5–32.8) 20.4 (17.5–23.3) 13.1 (11.3–14.9) 13.0 (11.1–14.9) 15.0 (12.6–17.4) 18.1 (14.9–21.3)
Women 9.9 (8.1–11.6) 11.4 (9.9–13.0) 12.1 (10.6–13.6) 11.8 (10.2–13.4) 12.0 (10.2–13.8) 10.8 (9.2–12.4)
Inactive
Men 9.3 (5.9–12.7) 13.1 (10.4–15.9) 15.5 (13.2–17.8) 16.5 (14.1–18.9) 25.0 (21.1–28.9) 37.0 (32.8–41.1)
Women 19.2 (14.3–24.2) 10.6 (8.8–12.4) 9.5 (8.2–10.7) 10.0 (8.6–11.4) 17.8 (15.6–20.0) 37.2 (34.5–40.0)
Alcohol abuse
Men 32.5 (25.7–39.3) 33.9 (30.5–37.3) 31.9 (29.1–34.7) 25.4 (22.7–28.1) 18.5 (15.5–21.4) 8.4 (6.0–10.7)
18 to 24 years 25 to 34 years 35 to 44 years 45 to 54 years 55 to 64 years ≥65 years
% 95%CI % 95%CI % 95%CI % 95%CI % 95%CI % 95%CI
Excess weight
Men 37.3 (26.7–47.9) 48.9 (45.2–52.7) 56.9 (53.8–60.0) 59.2 (55.9–62.4) 59.6 (55.4–63.8) 55.7 (51.4–60.1) Women 24.9 (19.6–30.3) 36.0 (32.7–39.2) 45.7 (43.1–48.3) 52.9 (50.0–55.8) 59.8 (56.6–63.0) 55.0 (51.8–58.1) Obesity
Men 7.7 (4.7–10.6) 13.6 (10.5–16.7) 16.0 (13.8–18.3) 16.6 (14.2–19.0) 19.9 (16.4–23.4) 12.4 (9.8–15.1) Women 6.2 (4.0–8.4) 11.9 (9.7–14.0) 15.1 (13.2–17.1) 18.1 (16.0–20.3) 21.3 (18.8–23.9) 20.4 (17.6–23.1) Poor health self-evaluation
Men 2.0 (0.9–3.1) 2.1 (1.1–3.1) 3.0 (1.9–4.1) 4.3 (2.9–5.7) 5.3 (3.2–7.5) 7.2 (4.7–9.6) Women 5.9 (2.4–9.4) 5.0 (3.7–6.2) 5.6 (4.3–6.8) 6.5 (5.2–7.8) 9.8 (8.0–11.7) 8.6 (7.1–10.2) Arterial hypertension
Men 5.1 (3.2–6.9) 11.8 (8.8–14.7) 20.7 (18.1–23.2) 30.5 (27.5–33.5) 45.9 (41.7–50.0) 58.4 (54.2–62.6) Women 9.7 (4.7–14.7) 15.4 (12.5–18.3) 21.0 (19.0–23.1) 37.9 (35.2–40.6) 54.0 (51.0–57.0) 66.2 (63.6–68.7) Diabetes
Men 0.4 (0.1–0.6) 1.3 (0.5–2.1) 3.0 (1.8–4.2) 8.0 (6.2–9.7) 17.11 (13.6–20.6) 22.7 (18.8–26.6) Women 1.0 (0.3–1.7) 3.1 (1.0–5.3) 3.7 (2.6–4.7) 7.2 (5.7–8.7) 14.0 (12.0–16.0) 21.7 (19.3–24.0) Heart diseases
Men 0.2 (0.0–0.4) 0.7 (0.0–1.4) 1.3 (0.6–1.9) 2.2 (1.6–2.9) 7.9 (5.3–10.5) 12.4 (9.4–15.5) Women 0.2 (0.0–0.5) 1.7 (0.6–2.7) 1.4 (0.9–1.9) 3.9 (2.7–5.1) 5.9 (4.6–7.2) 7.7 (6.2–9.1) Dyslipidemia
Men 4.4 (1.9–6.9) 7.9 (5.9–9.8) 14.9 (13.1–16.7) 23.3 (20.6–26.0) 31.2 (27.3–35.2) 26.6 (23.0–30.2) Women 5.7 (4.2–7.3) 9.3 (7.9–10.7) 17.7 (15.9–19.6) 28.2 (25.9–30.6) 41.1 (38.2–44.0) 43.1 (40.3–45.8)
Source: Surveillance System of Risk and Protective Factors for Chronic Diseases by Telephone Survey (VIGITEL), Ministry of Health, Brazil
*Weighted proportion according to the 2000 Census sociodemographic distribution of the adult population in each given State capital; 95%CI – 95% confi-dence interval; p-value=0.05, considering design effect of the study
Fonte: MS/SVS/CGDANT – VIGITEL – Vigilância de Fatores de Risco e Proteção para Doenças Crônicas por Inquérito Telefônico
*Percentuais ponderados para ajustar a distribuição sócio-demográfica da amostra VIGITEL à distribuição da população adulta de cada cidade no Censo Demográfico de 2000 e para levar em conta o peso populacional de cada cidade; IC 95% – Intervalo de confiança (p=0,05), levando-se em consideração o efeito do desenho do estudo
Table 3. Frequency* of overweight, obesity, poor self-rated health and self reported morbidity in adults, by sex and age group, in the Brazilian State Capitals and Federal District (VIGITEL, Brazil – 2009)
Tabela 3. Frequência* (%) de excesso de peso e obesidade, auto-avaliação de saúde e morbidade referida em adultos, por sexo
e faixa etária, no conjunto das capitais do Brasil e no Distrito Federal (VIGITEL 2009)
consumption of bean and meat with visible excess fat and years of schooling. Physical activity during the leisure signiicantly increases among groups with 0 to 8 and 9 to 11 years of schooling, both for men and women (Table 1).
Excess weight and obesity presented diferent behaviors. Among men, excess weight was lower among those with an intermediate level of schooling (9 to 11 years), and among women, excess weight and obesity had higher rates in the group with a higher level of schooling.
he frequency of arterial hypertension, diabetes and heart diseases was higher among individuals with a lower level of schooling, while the frequency of dyslipi-demia was higher among men with more years of schooling (Table 4).
Discussion
Table 4. Frequency* of risk and protective factors of non communicable chronic diseases in adults by sex and education, in the Brazilian State Capitals and Federal District (VIGITEL, Brazil –2009)
Tabela 4. Frequência* (%) de fatores de risco e proteção para doenças crônicas em adultos, por sexo e escolaridade, no
conjunto das capitais do Brasil e no Distrito Federal (VIGITEL – 2009)
Source: Surveillance System of Risk and Protective Factors for Chronic Diseases by Telephone Survey (VIGITEL), Ministry of Health, Brazil
*Weighted proportion according to the 2000 Census sociodemographic distribution of the adult population in each given State capital; 95%CI – 95% confi-dence interval; p-value=0.05, considering design effect of the study
Fonte: MS/SVS/CGDANT – VIGITEL – Vigilância de Fatores de Risco e Proteção para Doenças Crônicas por Inquérito Telefônico
*Percentuais ponderados para ajustar a distribuição sócio-demográfica da amostra VIGITEL à distribuição da população adulta de cada cidade no Censo Demográfico de 2000 e para levar em conta o peso populacional de cada cidade; IC 95% – Intervalo de confiança (p=0,05), levando-se em consideração o efeito do desenho do estudo
Men Women
0 to 8 years 9 to 11 years ≥12 years 0 to 8 years 9 to 11 years ≥12 years
% 95%CI % 95%CI % 95%CI % 95%CI % 95%CI % 95%CI
Smokers 23.4 (20.3–26.5) 14.8 (13.3–16.3) 12.5 (10.8–14.1) 15.7 (13.6–17.7) 8.5 (7.5–9.6) 9.9 (8.5–11.2) Former smokers 31.8 (27.3–36.3) 19.1 (17.6–20.7) 23.0 (20.9–25.1) 22.1 (20.4–23.7) 12.9 (11.9–14.0) 14.4 (13.1–15.8) Passive smokers
- household
12.9 (10.7–15.2) 13.2 (11.7–14.6) 8.6 (7.0–10.1) 14.4 (12.7–16.0) 15.1 (13.7–16.5) 11.4 (9.8–12.9)
Passive smokers - workplace
21.8 (19.3–24.4) 17.8 (16.2–19.5) 8.2 (6.8–9.5) 7.5 (6.2–8.8) 9.8 (8.6–11.0) 7.2 (6.1–8.3)
Regular consumption of fruits, vegetables and legumes
19.2 (16.9–21.5) 23.9 (22.2–25.5) 41.1 (38.7–43.5) 32.6 (30.5–34.7) 33.3 (31.7–34.9) 49.5 (47.4–51.6)
Recommended consumption of fruits, vegetables and legumes
11.6 (9.8–13.3) 14.7 (13.3–16.2) 25.2 (23.1–27.4) 19.1 (17.4–20.9) 21.8 (20.3–23.2) 34.3 (32.3–36.3)
Consumption of beans
77.6 (74.7–80.5) 71.9 (70.1–73.7) 57.0 (54.6–59.4) 64.8 (62.6–67.0) 59.3 (57.6–60.9) 46.4 (44.3–48.5)
Intake of soft drinks
32.6 (27.8–37.4) 32.3 (30.3–34.3) 26.9 (24.7–29.1) 23.5 (20.9–26.1) 27.0 (25.4–28.7) 24.7 (22.7–26.7)
Consumption of meat with excess visible fat
45.0 (41.1–48.8) 44.9 (42.8–47.0) 35.0 (32.6–37.3) 25.3 (22.9–27.7) 25.3 (23.8–26.8) 19.1 (17.3–20.8)
Sufficiently active at leisure time
14.5 (12.4–16.6) 23.2 (21.4–24.9) 24.8 (22.8–26.8) 8.7 (7.6–9.7) 13.5 (12.3–14.7) 15.7 (14.4–17.1)
Inactive 18.3 (15.9–20.7) 12.2 (10.8–13.5) 15.1 (13.4–16.9) 16.0 (13.8–18.2) 12.9 (11.7–14.1) 17.7 (16.1–19.4) Alcohol abuse 26.4 (23.2–29.6) 30.7 (28.8–32.6) 33.0 (30.7–35.3) 9.0 (7.6–10.4) 10.9 (9.9–12.0) 14.1 (12.6–15.6) Poor health
self-evaluation
4.3 (3.4–5.3) 2.1 (1.5–2.7) 1.6 (1.1–2.2) 9.2 (7.6–10.8) 3.5 (2.9–4.1) 2.0 (1.5–2.5)
Excess weight 51.7 (47.5–55.8) 46.5 (44.4–48.6) 56.7 (54.2–59.1) 50.0 (47.4–52.7) 37.2 (35.5–38.9) 31.1 (29.1–33.0) Obesity 14.1 (11.9–16.4) 12.2 (10.9–13.5) 15.1 (13.3–16.9) 18.2 (16.4–20.0) 11.0 (10.0–12.1) 8.4 (7.3–9.4) Arterial
hypertension
24.9 (22.2–27.5) 15.4 (14.0–16.7) 18.9 (17.1–20.7) 37.3 (34.9–39.6) 16.2 (15.1–17.3) 14.9 (13.5–16.4)
Diabetes 6.7 (5.5–7.8) 3.1 (2.6–3.7) 4.7 (3.8–5.6) 9.0 (7.7–10.3) 3.1 (2.6–3.6) 3.0 (2.4–3.6) Heart diseases 3.2 (2.5–4.0) 1.3 (0.9–1.6) 1.5 (1.1–1.9) 3.9 (3.2–4.6) 1.2 (1.0–1.4) 1.2 (0.8–1.6) Dyslipidemia 13.1 (11.3–15.0) 13.2 (11.9–14.5) 18.9 (17.1–20.7) 22.6 (21.0–24.1) 14.6 (13.5–15.7) 17.5 (16.0–19.0)
reported arterial hypertension and dyslipi-demia diagnoses more frequently, as well as poor health status.
Surveys regarding risk factors of CNCD are still recent in the country, which makes it diicult to analyze trends. However, previous studies conducted in Brazil may serve as a parameter for themes such as
rural area13,14. his result is similar to that found by VIGITEL 2009, of 15,5% (95%CI, 14.5–16.5), considering only adults (aged
≥18 years), living in Brazilian state capitals and the Federal District. In that same year, the smoking prevalence among North-American adults was 20.6% (95%CI, 19.9– 21.3)15. hus, although the reduction of smoking rates has also been observed in other countries in the past few years, the intensity of the annual decrease in Brazil is considered as one of the highest in the world16.
Also, the number of former smokers is higher after the age of 45 years, which rein-forces the decreasing smoking trend in the past two decades. he decrease in smoking in Brazil and the higher smoking cessation rates are partly a result of speciic policies of the National Smoking Control Program, which restricted advertising and pub-licity, and created educational campaigns, warnings on cigarette packets, besides the prohibition to smoke in public places, among other initiatives16-18. he impact of this decrease may be analyzed by the lower rates of mortality caused by trachea, bronchi and lung cancer in younger indi-viduals and also in mortality caused by respiratory disease in the past years19,20.
Even if based on self-reported infor-mation on height and weight, data from VIGITEL are similar to those of the Family Budget Survey of 2008-200921, in which excess weight was diagnosed in about half of the men and women aged 20 years or older. In the trend analysis as to gender, the prevalence rates of excess weight in the male population almost tripled; in 1974, it was 18.5%22, and in 2009 it was 50.1%21; among women, the rates doubled, going from 28.7% to 48% in the same period. Obesity increased four times among men (2.8% to 12.4%) and doubled among women (from 8% to 16.9%)21. Likewise, the inverse relation between the prevalence of obesity and schooling observed in VIGITEL for women, and the direct relation for men, had been previously described in national studies23,24, once again ensuring the validity
of our indings. his real obesity epidemic occurring in our country is related to the increased prevalence of other risk factors, such as inadequate eating habits (high intake of saturated fat, low intake of fruit, vegetables and legumes) and the low rates of physical activity in the population25,26.
he high frequency of excess weight and obesity in the elderly may be a result of a sedentary lifestyle and a caloric intake, besides genetic and metabolic factors. he consequence is the increased mor-bidity and mortality rates due do chronic diseases, such as diabetes and arterial hypertension11,12,20, which justiies the investment in actions related to healthy eating promotion and encouragement to physical activity27. Estimates are that, if the current trend continues, in ten years Brazil will reach the numbers of United States, where almost one third of the population is obese, and the prevalence increases in at a slower pace28.
VIGITEL results also point to the low levels of physical activity in the country. It is emphasized that leisure physical activity decreases with age, but men with high levels of schooling are more active, which has been observed in other studies25,29,30. he the increased rates of obesity and the development of diferent types of chronic diseases, such as heart disease, diabetes and cancer31is related to the lack of physical activity. Despite the eforts to promote leisure physical activity, preva-lence rates of physical activity and sed-entary lifestyle have not had signiicant changes throughout the years.11
18.9% of the adult population reached the levels recommended by WHO27. Besides, almost one third of the population regu-larly consumes meat with fat and soft drinks. he intake of beans is highly prev-alent, especially among men, although it has presented a decreasing trend in the past few years for both genders11,32. Usually, women have better diets than men, but such habits also improve with higher levels of education and aging, in accordance with previous studies33,34. he healthy intake of food in populations with higher levels of schooling may be explained by the access to information in order to adopt healthier habits35, as well as the higher income to choose for food items36.
Alcohol abuse is a concern in the Brazilian adult population, especially among young men. Besides being a risk factor of hypertension, cirrhosis, stroke and cancer, alcohol consumption is associated with high rates of violence and accidents.
he poor health status self-evaluation was more prevalent among women and older age groups, which is similar to the indings of the recent National Household Sample Survey. his feature was expected because it measures the health status of populations, access to medical care, and the impact of diseases on the quality of life of individuals; besides, this indicator has been considered as an important mor-tality predictor, especially for the elderly population.
In relation to morbidity conditions, the prevalence of medical diagnoses of arterial hypertension, diabetes, heart disease and dyslipidemias is higher among women, which can be explained because more women seek medical care. he National Household Sample Survey also showed a high percentage of chronic disease in women, and even higher in older age groups. Considering that men present more risk factors such as smoking, alcohol con-sumption, excess weight and inadequate diets, the lowest self-reported chronic disease in men could be explained by the fact that men worry less about health and
do not seek medical care as much, which results in higher morbidity and mortality rates and a lower life expectancy. his sce-nario contributed to the establishment of the Brazilian national policy for the health of men, in 2009. he goal was to broaden the access for the male population to medical care and preventive exams40.
Hypertension is the most frequent chronic disease in the results of health surveys. However, the identiied values pre-sented variations according to the meth-odology used and the studied period30,41. Because it is limited to a reported diagnosis of the adult population living in Brazilian state capitals and the Federal District, where the access to diagnostic tests is easier, VIGITEL tends to present higher frequencies when compared to broader surveys, like the National Household Sample Survey. However, it is still under-estimated when compared to surveys con-ducted with biomedical measurements for diagnosis26,42,43.
At VIGITEL, diabetes was mostly reported by individuals aged 45 years or older, which is similar to the age group that presents the highest disease load in terms of Disability Adjusted Life Years (DALYs)44. In relation to the prevalence of arterial hypertension, most population studies did not ind a diference among genders45, unlike the results in this study and in the Bambuí survey (MG)46, in which it was more prevalent among women. Other studies34,45,47 also show that the higher prevalence in older age groups and in the population with a lower education level is a condition.
the cross-sectional study does not allow the cause-efect evaluation. VIGITEL is based on weighting factors to adjust esti-mates from the telephone survey in order to correct the diferences among the popu-lation who own and those who do not own a telephone line. he objective is to extrap-olate the results for the total population of the assessed locations9,11. In relation to the use of reported morbidity, previous studies conducted in the United States and
in Brazil showed that despite the possible underestimation or false reports, this kind of measuring is valid26,39,48.
Telephone surveys are useful to bring fast and low cost information4, thus becoming an important tool to monitor risk and protective factors of chronic non-communicable diseases and actions of health promotion, as well as the impacts on health policies addressed to face risk and control factors of chronic diseases.
References
1. World Health Organization . Chronic diseases. 2005 [updated 2005; cited 2008 Jul 17]. Available from: http:// www.who.int/topics/chronic_diseases/en/.
2. World Health Organization – Organização Panamericana de Saúde. Prevenção de doenças crônicas, um
investimento vital. Geneva: WHO Global Report, 2005. 36p.
3. Malta DC, Leal MC, Costa MFL, Moraes Neto OL. Inquéritos Nacionais de Saúde: experiência acumulada e proposta para o inquérito de saúde brasileiro. Rev Bras Epidemiol.2008;11 Suppl 1:159-67.
4. Mokdad AH, Remington PL. Measuring health behaviors in populations. Prev Chronic Dis. 2010;7(4):A75.
5. National Health Survey: Summary of Results, 2007-2008 (Reissue) Austrália Canberra: Australian Bureau of Statistics; 2009 Document Number: 4364.0. Available from: http://www.abs.gov.au/ausstats/[email protected]/mf/4364.0/
6. Summary of Surveys and Data Systems National Center for Health Statistics; June 2004 [updated 2004 Jun; cited 2010 Jun 9]; Current NCHS Surveys and Data Systems. Available from: http://www.cdc.gov/nchs/surveys.htm.
7. Slade GD, Brennan D, Spencer AJ. Methodological aspects of a computer-assisted telephone interview survey of oral health. Aust Dent J. 1995;40(5):306-10.
8. Centers for Disease Control and Prevention. Behavioral Risk Factor Surveillance System - BRFSS. [cited 2008 Jul 28]. Available from: http://www.cdc.gov/brfss/about.htm.
9. Moura EC, Morais Neto OL, Malta DC, Moura L, Silva NN, Bernal R, et al. Vigilância de Fatores de Risco para Doenças Crônicas por Inquérito Telefônico nas capitais dos 26 estados brasileiros e no Distrito Federal (2006). Rev Bras Epidemiol. 2008;11 Suppl 1:20-37.
10. Ministério da Saúde, SVS. Departamento de Análise de Situação de Saúde. Vigilância de Fatores de Risco e Proteção para Doenças Crônicas por Inquérito Telefônico, VIGITEL 2007. Brasília: DF; 2008.
11. Ministério da Saúde, SVS. Departamento de Análise de Situação de Saúde. Vigilância de Fatores de Risco e Proteção para Doenças Crônicas por Inquérito Telefônico, VIGITEL 2009. Brasília: DF; 2010.
12. Malta DC, Moura L, Souza FM, Rocha FM, Fernandes RM. Doenças Crônicas não transmissíveis: mortalidade e fatores de risco no Brasil, 1990 a 2006. Ministério da Saúde Departamento de Análise de Situação de Saúde Secretaria de Vigilância em Saúde Saúde Brasil 2008: 20 anos de Sistema Único de Saúde (SUS) no Brasil. Brasília: DF; 2009.
13. Brasil. Ministério do Planejamento, Orçamento e Gestão. Instituto Brasileiro de Geograia e Estatística – IBGE. Pesquisa Nacional por amostra de domicílios (PNAD 2008). Pesquisa Especial de Tabagismo (PETab). Rio de Janeiro: IBGE; 2009.
14. IBGE, Diretoria de Pesquisas, Coordenação de Trabalho e Rendimento. Pesquisa Nacional sobre Saúde e Nutrição (PNSN) 1989.
15. Centers for Disease Control and Prevention. Vital Signs:
current cigarette smoking among adults aged ≥18 Years
– United States, 2009. MMWR Morb Mortal Wkly Rep 2010;59(35): 1135-40.
16. Monteiro CA, Cavalcante TM, Moura EC, Claro RM, Szwarcwald CL. Population-based evidence of a strong decline in the prevalence of smokers in Brazil (1989-2003). Bull World Health Organ. 2007;85(7):527-34.
17. Cavalcante TM. O controle do Tabagismo e
Intersetorialidade. In: Ministério da Saúde. Secretaria de Vigilância em Saúde, Departamento de Análise de Situação em Saúde. Seminário Nacional de Vigilância em Doenças e Agravos Não Transmissíveis e Promoção da Saúde, Anais. Brasília: DF; 2006.
19. Malta DC, Moura L, Souza Mde F, Curado MP, Alencar AP, Alencar GP. Lung cancer, cancer of the trachea, and bronchial cancer: mortality trends in Brazil, 1980-2003. J Bras Pneumol. 2007;33(5):536-43.
20. Schmidt MI, Duncan BB, Stevens A, Luft V, Iser BPM, Moura L, et al. Doenças Crônicas não transmissíveis no Brasil: mortalidade, morbidade e fatores de risco. Saúde Brasil 2009: Uma análise da situação de saúde e da Agenda Nacional e Internacional de Prioridades em Saúde Ministério da Saúde Departamento de Análise de Situação de Saúde Secretaria de Vigilância em Saúde Brasília; 2010. p. 369.
21. POF. Pesquisa de Orçamentos Familiares 2008-2009. Antropometria e Estado Nutricional de Crianças, Adolescentes e Adultos no Brasil. Rio de Janeiro: IBGE, Ministério da Saúde. 2010.
22. IBGE, Diretoria de Pesquisas, Coordenação de Trabalho e Rendimento. Estudo Nacional da Despesa Familiar (ENDEF) 1974-1975.
23. Monteiro CA, Conde WL, de Castro IR. A tendência cambiante da relação entre escolaridade e risco de obesidade no Brasil (1975-1997). Cad Saúde Pública. 2003;19 Suppl 1:S67-75.
24. Monteiro CA, Conde WL, Popkin BM. Independent efects of income and education on the risk of obesity in the Brazilian adult population. J Nutr. 2001;131(3):881S-6S.
25. Malta DC, Moura EC, Castro AM, Cruz DKA, Morais Neto OL, Monteiro CA. Padrão de atividade física em adultos brasileiros: resultados de um inquérito por entrevistas telefônicas, 2006. Epidemiol e Serv Saúde. 2009;18(1):7-16.
26. Schmidt MI, Duncan BB, Hofmann JF, Moura L, Malta DC, Carvalho RM. Prevalence of diabetes and hypertension based on self-reported morbidity survey, Brazil, 2006. Rev Saúde Pública. 2009;43 Suppl 2:74-82.
27. World Health Organization. Global strategy on diet, physical activity and health. . Geneva: WHO; 2004 Document Number: WHA57.17. Available from: http:// www.who.int/dietphysicalactivity/strategy/eb11344/ strategy_english_web.pdf.
28. Flegal KM, Carroll MD, Ogden CL, Curtin LR. Prevalence and trends in obesity among US adults, 1999-2008. JAMA. 20;303(3):235-41.
29. Dias-da-Costa JS, Hallal PC, Wells JC, Daltoé T, Fuchs SC, Menezes AM, et al. Epidemiology of leisure-time physical activity: a population-based study in southern Brazil. Cad Saúde Pública. 2005;21(1):275-82.
30. Brasil. Ministério do Planejamento, Orçamento e Gestão. Instituto Brasileiro de Geograia e Estatística – IBGE. Pesquisa Nacional por amostra de domicílios (PNAD 2008), Um panorama da Saúde no Brasil: acesso e utilização dos serviços, condições de saúde e fatores de risco e proteção à saúde. Rio de Janeiro: IBGE; 2010.
31. World Health Organization. World Health Report 2002. Reducing risks, promoting healthy life. . Geneva: WHO;
2002 Available from http://www.who.int/whr/2002/en/ whr02_en.pdf
32. Ministério da Saúde, SVS. Departamento de Análise de Situação de Saúde. Vigilância de Fatores de Risco e Proteção para doenças crônicas por inquérito telefônico, VIGITEL 2006. Brasília: DF; 2007.
33. Szwarcwald CL, Viacava F, Vasconcellos MTL, Leal MC, Azevedo LO, Queiroz RSB, et al. Pesquisa Mundial de Saúde 2003: O Brasil em Números. RADIS/FIOCRUZ 2004; 23:14-.
34. Ministério da Saúde, Secretaria de Vigilância em Saúde. Instituto Nacional do Câncer. Inquérito domiciliar sobre comportamentos de risco e morbidade referida de doenças e agravos não transmissíveis: Brasil, 15 capitais e Distrito Federal. 2002-2003. Rio de Janeiro: INCA; 2004.
35. Jaime PC, Figueiredo IC, Moura EC, Malta DC. Factors associated with fruit and vegetable consumption in Brazil, 2006. Rev Saúde Pública. 2009;43 Suppl 2:57-64.
36. Claro RM, Monteiro CA. Family income, food prices, and household purchases of fruits and vegetables in Brazil. Rev Saúde Pública. 44(6):1014-20.
37. Mascarenhas MDM, Malta DC, Silva MMA, Carvalho CG, Monteiro RA, Morais Neto OL. Consumo de álcool entre vítimas de acidentes e violências atendidas em serviços de emergência no Brasil, 2006 e 2007. Cien Saúde Colet. 2009;14(5):1789-96.
38. Lima-Costa MF, Firmo JOA, Uchoa E. A estrutura da auto-avaliação da saúde entre idosos: projeto Bambuí. Rev Saúde Pública. 2004; 38(6):827-34.
39. Lima-Costa MF, Peixoto SV, Firmo JO. Validade da hipertensão arterial auto-referida e seus determinantes (projeto Bambuí). Rev Saúde Pública. 2004;38(5):637-42.
40. Política Nacional de Atenção Integral a Saúde do Homem – Princípios e Diretrizes. Secretaria de Atenção à Saúde, Departamento de Ações Programáticas Estratégicas. Brasília: DF Ministério da Saúde; 2008. p. 40.
41. INCA/SVS. Inquérito Domiciliar sobre Comportamentos de Risco e Morbidade Referida de Doenças e Agravos não Transmissíveis. Brasil, 15 capitais e Distrito Federal 2002–2003. Rio de Janeiro: INCA, 2004. ISBN 85-7318-098-6.. 186p. Available from: http://www.inca.gov.br/ inquerito/docs/completa.pdf.
42. Malerbi DA, Franco LJ. Multicenter study of the prevalence of diabetes mellitus and impaired glucose tolerance in the urban Brazilian population aged 30-69 yr. he Brazilian Cooperative Group on the Study of Diabetes Prevalence. Diabetes Care. 1992;15(11):1509-16.
43. Passos VM, Barreto SM, Diniz LM, Lima-Costa MF. Type 2 diabetes: prevalence and associated factors in a Brazilian community – the Bambui health and aging study. Sao Paulo Med J. 2005;123(2):66-71.
to diabetes mellitus in Brazil. Cad Saúde Pública. 2009;25(6):1234-44.
45. Passos VMA, Assis TD, Barreto SM. Hipertensão arterial no Brasil: estimativa de prevalência a partir de estudos de base populacional. Epidemiol Serv Saúde. 2006;15(1):35-45.
46. Barreto SM, Passos VM, Firmo JO, Guerra HL, Vidigal PG, Lima-Costa MF. Hypertension and clustering of cardiovascular risk factors in a community in Southeast Brazil – he Bambui Health and Ageing Study. Arq Bras Cardiol. 2001;77(6):576-81.
47. Piccini RX, Victora CG. Hipertensão arterial sistêmica em área urbana no sul do Brasil: prevalência e fatores de risco . Rev Saúde Pública. 1994;28(4):261-7.
48. Martin LM, Lef M, Calonge N, Garrett C, Nelson DE. Validation of self-reported chronic conditions and health services in a managed care population. Am J Prev Med. 2000;18(3):215-8.