*e-mail: [email protected]
1. Introduction
Cutting tools with titanium nitride (TiN) coating are widely used due its mechanical properties such as high wear resistance and low friction. A new and promising coating for the same application is diamond-like carbon (DLC). One of the primary functions is to improve the wear resistance and thus increase the durability of components and products for engineering coatings such as TiN and DLC. Robust wear testing techniques are required to determine those aspects of the coatings performance1, and most of them are based on friction and wear 2-5. Often, the test parameters involved depend of: the tribo system properties, the materials in contact, the surrounding and wear conditions6. There are few successful methods of wear test, for example: ball bearing, pin on disk and ball on disk. Nevertheless, those techniques are common, new approaches of data analyses are being raised by tribologists. Considerable progress has been made in the last decade with the development of the ball cratering test7. In this test, a ball is rotated and pressed against the coated test sample. Abrasive slurry is introduced between the ball and the test sample. After a ixed number of revolutions, the volume of the crater formed is used to calculate the wear. Advantages of this test are: the operation simplicity, the low cost of the apparatus and the small scale of the samples. Moreover, ball cratering test method can be used to evaluate a variety of coating including polymeric ilms, thin hard ceramic coatings, metallic coatings and thick
thermally sprayed coatings8. Alternative ball cratering test was proposed by Gee and Wicks9. They used a test system which enables sliding wear and friction test of TiN and DLC coatings without the presence of added abrasive.
Bearing steel ball produces a circular depression which is used to determine the wear rate of the coating and the substrate. The wear is conined to the coating alone and a wear rate is calculated by geometrical considerations. Next, a sequence of craters with different duration penetrates the coating, producing two boundaries on overall crater diameter and the portion of the crater in the substrate. Dimensional analysis of these features results in wear rates for both the substrate and the coating. A disadvantage is the reliability of ball cratering test which is related to the measurement accuracy. Thus, optical microscopy has become a conventional tool for measuring the diameter of the wear crater generated in the abrasion test, and a primary method of measurement. Proilometer (Pf) for ancillary measurements in order to evaluate the crater has been proposed in this work as alternative technique for analysis.
This paper discusses the methods to evaluate the shape of the crater formed in the ball cratering test and the inluence of the accuracy in the speciic wear rate of TiN and DLC coatings. The sets of coatings tested here were useful to provide information on the wear and friction performance of the DLC, giving guidance in the application of this coating in sliding wear applications, since TiN is widely known.
Methods of data analysis for the ball cratering test on TiN and DLC coated steel
W. M. Silvaa*, P. S. Souzab and J. R. Carneirob
aDepartment of Rural Engineering, São Paulo State University - UNESP, Rua José Barbosa de Barros, nº 1780, CEP 18610-307, Botucatu, SP, Brazil
bDepartment of Mechanical Engineering, Pontiical Catholic University of Minas Gerais – PUC Minas, Av. Dom José Gaspar nº 500, CEP 30535-610, Belo Horizonte MG, Brazil
Received: January 22, 2015; Revised: September 18, 2015; Accepted: November 17, 2015
Titanium nitride (TiN) coatings are widely used in machining because of its mechanical characteristics which modify the surface of the substrate increasing the capacity of load support and reduction of friction, while a coating as diamond-like carbon (DLC), which also has interesting mechanical properties, needs better attention. In this sense, the development of new coatings such as DLC is as important as wear analysis techniques. This work discusses the methods available to assess abrasive wear of coatings. For this, it has been used the data of the crater volume formed in ball cratering test and compared the difference between the speciic wear coeficients of substrate and coating (ks and kc). These coeficients depend of the methods used for data analyses, thus, it has been used four equations to calculate ks and kc. Moreover, proilometry (pf) has been used to calculate the volumes, and thus ks and kc. Also, the roughness of the coatings, the thickness, the images corresponding to the crater formed, the coeficient of friction, the data obtained in wear tests due to the volume removed and, in the end, a comparison between ks and kc by different methods of data analyzes are presented.
2. Material and Methods
2.1 Experimental set-up and coating
characterization
Two sets of coatings have been tested: titanium nitride (TiN) coating, which is widely used in the machining factories, and DLC which is a new and promising coating. For both coatings, it has been used M2 steel substrates. DC plasma in physical vapor deposition (PVD) system has been utilized to synthesize TiN coating, and vacuum arc discharge PVD with graphite cathode was used for DLC.
The ball cratering test conditions were AISI 52100 steel ball of 15 mm radius, constant velocity of 0.1 m/s, load of 0.3 N, diamond paste (3μm) and silica solution 20% diluted in ethylene glycol. The crater images were taken by optical microscope for measuring the shape of the crater in the conventional method. Alternative for measuring the crater was performed in 3D proilometer equipment Taylor-Robson, software TalyMap Universal. Images were carried out with ixed sample and the probe displacement with a resolution of 65 nm in z-axis, 250 nm and 1000 nm in x, y-axis. The results obtained by using the conventional method were useful as reference for the evaluation and comparison with the proilometry technique. Images of the coating thickness were obtained using scanning electron microscopy (SEM), Hitachi S-3400 VP. Top view of the coating morphology was evaluated by atomic force microscopy (AFM) Veeco
multimode Nanoscope V. AFM technique was also used to obtain the roughness by the Ra – factor, based on the relation:
( )
0 l a
1 R f x dx
l
= ∫ , where l is the sampling length of the proile
and f(x) is the functional form of the proile heights measured
from a reference line.
2.2 Data analyses methods of the ball cratering
test
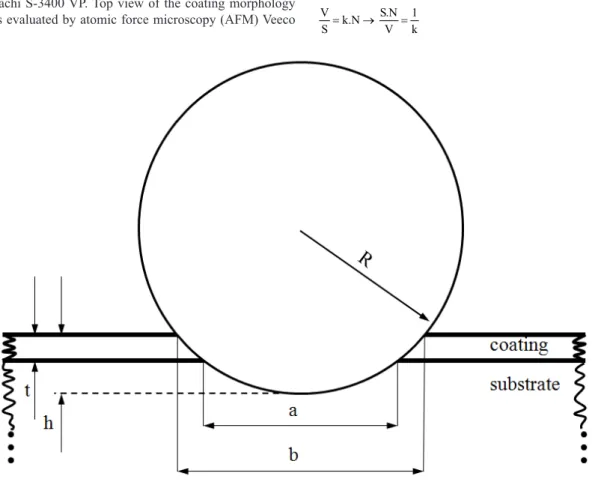
The ball cratering wear test is illustrated in Figure 1. Figure 1 shows a test illustration with a schematic diagram of the geometry of wear scars formed by ball cratering test with a sphere of radius R, internal crater diameter a, external crater diameter b, coating thickness t and the total penetration depth h into the sample. In this test, experimental data are provided by the analyses of the craters made for a predetermined number of ball cycle, then wear rates for both the substrate and the coating can be derived10.
The wear volume was calculated by a model for abrasive wear11 which is equivalent to the Archard equation:
V S.N
k
= (1)
Where k is the speciic wear rate or wear coeficient, V is the volume, S is the sliding distance and N, the normal load.
We are assuming the expression (2) to calculate k:
V S.N 1
k .N
S= → V =k (2).
Linear plot of SN/Vc versus Vs/Vc was used to obtain the wear coeficient of the coating (kc) and substrate (ks) as shown in Figure 2. Thus, an equation (3) can be obtained by
s
c s c c
V
S.N 1 1
V =k V +k (3)
where Vc and Vs are the volumes of coating and substrate, respectively12.
The thickness must be obtained via an independent method to ensure accuracy, thus avoiding the propagation of systematic errors in the inal result. The volumes of coating and substrate were calculated by (4) and (5) 13:
4 s a V 64 R π
= (4)
(
2)
c
t
V a 4Rt
4
π
= + (5)
The symmetrical formulation also allows both speciic wear rates from a single test and a linear plot. For coated substrate, where each component is assumed to have its own speciic wear rate, a combined wear equation (6) is given by:
c s
c s
V V
S.N
k k
= + (6)
Rearrangement of equation 2 can produce two equations to calculate ks and kc:
s s s V k S.N
= (7)
c c c V k S.N
= (8).
To estimate the wear coeficient of the material, Rutherford and Hutchings14 proposed that the volume V varies with distance S, and this is directly proportional by constant k and a normal force applied N according to the relation (9):
dV kN
dS= (9).
The wear equation (9) can be shown to be equivalent:
c s
c c s s
dV dV
dV
k N k N dS= dS + dS = +
(10), where: c c c dV k N
dS = (11)
and
s s s
dV k N
dS = (12).
Assuming that the speciic wear rates are constant, integration of these two equations gives (13) and (14):
c c c
V N dS
k = ∫ (13)
and s s s V N dS
k = ∫ (14)
therefore
c s
c s c s
V V
(N N )dS NdS S.N
k +k = ∫ + =∫ = (15).
According to Kusano et al. (2004), data analyses cannot be interpreted by just a single method, a use of the wrong method can lead to poor accuracy in the resulting speciic wear rates. To avoid this, four equations have been compared and used to the experimental data obtained. They are labeled as AT, Vs-AT, Vc-AT and DI. ‘AT’ method is the Rutherford formulation, using the inner crater diameter a and independently measured coating thickness t.‘Vs-AT’ and ‘Vc-AT’ method are the Allsopp formulation using the inner crater diameter a and the independently measured coating thickness. ‘Double intercept - DI’ method is the formulation which uses the inner diameter a and the predetermined coating thickness t 10. The equations related to ‘AT’, ‘Vs-AT’, ‘Vc-AT’ and DI are described in the Table 1.
3. Results and discussion
The tools covered with TiN normally have 4 μm thickness, as well the samples used here and shown in the cross section-view evaluated by SEM in Figure 3. In
Figure 2. Schematic diagram showing linear plot obtained by plotting S.N/Vc against Vs/Vc.
Table 1 - Data analysis methods.
Method Equation
AT s
c s s
V
SN 1 1 1
V k k V k
= − +
Vs-AT c
s c s s
V
SN 1 1
V =k V +k
Vc-AT s
c s c c
V
SN 1 1
V =k V +k
DI s c
s c
V V
1 1
this same Figure, the TiN coating morphology by AFM is presented inside, the TiN roughness obtained by AFM is 90 nm. As expected, the roughness of the TiN deposited by PVD system was low and follows the shape of the substrate, indicating that the coating has satisfactory adhesion. In the other hand, DLC is a new technology and needs better attention due adhesion issues that limits its use 15, 16, although is an interesting type of coating because of its high hardness and chemical inertness 17. The DLC with 1 μm thickness shows satisfactory adhesion, and the interface between coating and substrate is clear, as shown in Figure 4. Also, the morphology of DLC is homogeneous and the roughness calculated is 62 nm. Despite the DLC roughness is lower than TiN, other mechanical properties may inluence the wear results and discussed forward, apparently, the slight difference of roughness do not interfere signiicantly on the wear.
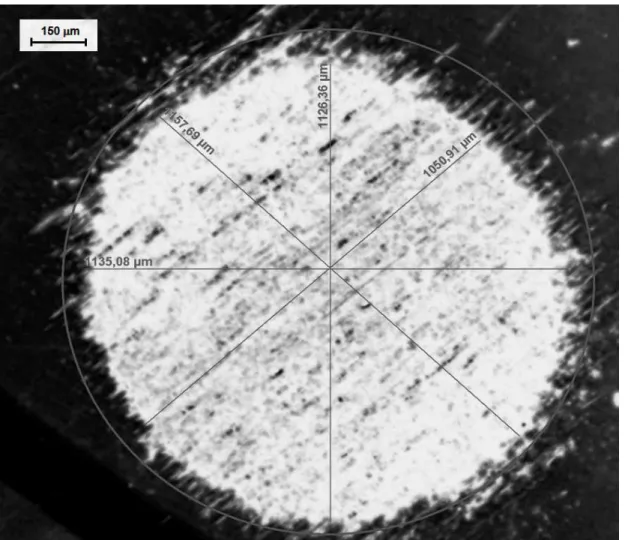
It is known that when perforation of the coating occurs, the procedure originally developed by Rutherford and Hutchings can be used 1, 7, 8-11. A series of tests were performed with different cycle number, and then the formation of the crater was caused by the contact-pressure at the center of the sphere with the sample. No dificulties were found to measure the crater in the TiN samples due the regular shape of the contour created in the pair substrate-ilm, as shown in Figure 5. The micrograph reveals a “ring” of considerable width at the outer edge of the crater. Differently, the samples of DLC showed a non perfect diameter of the crater, as shown in Figure 6. There were dificulties in deining the
edges of craters for DLC as indicated by the diameters variations; moreover, the grooves in the edge interfere in the measurements of the inner craters diameters, also scufing effect have occurred around the edge of the crater. This scufing effect can cause dificulties in determining the real edge of the crater. When the crater with irregular shape is observed, the coating volume calculated is strongly affected, since the formulas of the volumes (4 and 5) are dependent on internal diameter (a) and the thickness (t). Apart from a slight fuzziness of the crater edge this micrograph allows for a fair measurement of the corresponding crater intersect diameter. Interesting points are raised by Gee et al. (2003)1. They reported the same factors observed here which affect the accuracy of measurements: the dificulty in resolving the edges of craters; the method of scar size measurements; the fact that non-perfect crater shapes are often seen in tests; and the theory for analyzing results may not be appropriate for all materials and test conditions.
Images from the alternative technique suggested here are presented in Figure 7. The volume from the proile of the crater has been calculated to the pair substrate-ilm. Thus, results obtained by proilometry were useful for comparison with the volumes calculated by conventional method.
Figure 4. Cross-section view of the thickness of DLC coating by scanning electron microscopy and the morphology of the DLC coating by AFM (inside).
compared with the coeficient of friction (0.3) of DLC. Mechanical properties as hardness of DLC and Young modulus are related to the low coeficient of friction for DLC, however for TiN coating the non-uniform morphology, as
observed in the AFM image on Figure 3, can inluence the friction during the test.
From the slope of the linear its to the data, as shown in Figure 9, this method provides a simple indication whether kc Figure 6. Crater produced in DLC-coated steel sample by optical microscopy. The crater edge has grooves in which became dificult the
diameters measurements.
Figure 8. Coeficient of friction for TiN and DLC.
Figure 9. Plots of abrasion wear data obtained for TiN-coated M2 steel and DLC.
is greater or less than ks. An advantage is its potential accuracy since the value of S.N is generally much more accurate than the volumes calculated from the measured wear scar dimensions. Separate wear scars were formed after varying numbers of ball rotations and have been measured by optical microscopy. For each scar at least ive measurements of a and b were made parallel and perpendicular to the abrasion direction to obtain mean values of a and b.
The internal crater diameters and the external crater diameters for TiN and DLC were both measured as shown in Figure 10 and plotted against SN. There is a steady increase tendency in the size of internal and external TiN diameters, differently, a non-steady increase is observed for DLC.
Probably, the factors like thickness and wear resistance are responsible for the result of each coating.
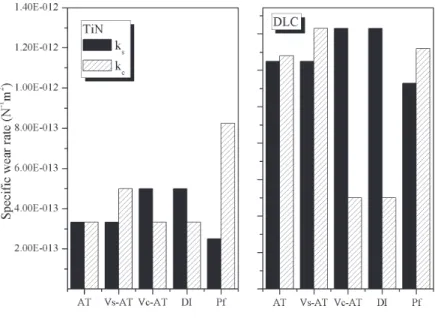
Figure 11. Evaluation of speciic wear rates of substrate and coating, ks and kc, using four equations of data analyses methods (AT, Vs-AT,
Vc-At and DI by conventional micrsocopy) compared with speciic wear rates of ks and kc from the data obtained using proilometry
(pf) technique.
Figure 10. Experimental data obtained from ball-cratering tests on TiN and DLC coated sample with mean values of the internal and external crater diameters.
results of speciic wear rate are not with the same tendency, the coeficient of the substrate (ks) often is greater than the coating (kc). However, in the proilometer method kc was greater than ks for both coatings, probably due poor accuracy. Therefore, the use of proilometer to measure the volume of the crater needs to be better understood, while Vc-At and DI are the best analyses methods.
4. Conclusions
speciic wear rate, once the use of correct equation. The use of proilometer for analysis of the crater from ball cratering test proved to be non-applicable and consistent if compared with the conventional method, due the proilometer analysis cannot discriminate between the coating and the portion of the substrate. Therefore, conventional method can be applied to a variety of test and abrasive material. Although it is realized that the method for deining the boundary between the DLC coating and the substrate for the gray color changes needs to
be better understood, it seems that the conventional method has the advantage on proilometer.
Acknowledgments
WMS would like to thank the help of André Bragança Carvalho França, Valéria Gomes, Dr. Claudinei José Oliveira, Dr. Gilmar Cordeiro da Silva and Dr. Pedro Paiva Brito.
References
1. Gee M, Gant A, Hutchings I, Bethke R, Schiffman K, Van Acker K, et al. Progress towards standardisation of ball cratering.
Wear. 2003; 255(1-6):1-13. http://dx.doi.org/10.1016/S0043-1648(03)00091-7.
2. Vanhulsel A, Velasco F, Jacobs R, Eersels L, Havermans D, Roberts E, et al. DLC solid lubricant coatings on ball bearings for space applications. Tribology International. 2007; 40(7):1186-1194. http://dx.doi.org/10.1016/j.triboint.2006.12.005. 3. Fildes J, Meyers S, Mulligan C and Kilaparti R. Evaluation of
the wear and abrasion resistance of hard coatings by ball-on-three-disk test methods —A case study. Wear. 2013; 302(1-2):1040-1049. http://dx.doi.org/10.1016/j.wear.2012.11.018. 4. Mello J, Binder R, Demas N and Polycarpou A. Effect of the
actual environment present in hermetic compressors on the tribological behavior of a Si-rich multifunctional DLC coating.
Wear. 2009; 267(5):907-915. http://dx.doi.org/10.1016/j. wear.2008.12.070.
5. Suzuki M, Saito T and Tanaka A. Tribological properties of DLC films against different steels. Wear. 2013; 304(1-2):83-87. http://dx.doi.org/10.1016/j.wear.2013.03.046.
6. Zeiler E, Klaffke D, Hiltner K, Grögler T, Rosiwal S and Singer R. Tribological performance of mechanically lapped chemical vapor deposited diamond coatings. Surface and Coatings Technology. 1999; 116–119:599-608. http://dx.doi. org/10.1016/S0257-8972(99)00136-X.
7. Gee M. The use of PC scanners in micro-abrasion wear testing.
Wear. 2005; 259(7):1448-1452. http://dx.doi.org/10.1016/j. wear.2005.02.090.
8. Gee M, Gant A, Hutchings I, Kusano Y, Schiffman K, Van Acker K, et al. Results from an interlaboratory exercise to validate the micro-scale abrasion test. Wear. 2005; 259(1):27-35. http:// dx.doi.org/10.1016/j.wear.2005.02.092.
9. Gee M and Wicks M. Ball crater testing for the measurement of the unlubricated sliding wear of wear-resistant coatings.
Surface and Coatings Technology. 2000; 133-134:376-382. http://dx.doi.org/10.1016/S0257-8972(00)00966-X.
10. Kusano Y, Acker K and Hutchings I. Methods of data analysis for the micro-scale abrasion test on coated substrates. Surface and Coatings Technology. 2004; 183(2):312-327. http://dx.doi. org/10.1016/j.surfcoat.2003.10.010.
11. Sabatini G, Ceschini L, Martini C, Williams J and Hutchings I. Improving sliding and abrasive wear behavior of cast A356 and wrought AA7075 aluminum alloys by plasma electrolytic oxidation. Materials & Design. 2010; 31(2):816-828. 12. Leroy C, Schiffman K, Acker K and von Stebut J. Ball Cratering
an efficient tool for 3 body microabrasion of coated systems.
Surface and Coatings Technology. 2005; 200(1-4):153-156. http://dx.doi.org/10.1016/j.surfcoat.2005.02.076.
13. Chen H, Xu C, Zhou Q, Hutchings I, Shipway P and Liu J. Micro-scale abrasive wear behavior of HVOF sprayed and laser-remelted conventional and nanostructured WC–Co coatings.
Wear. 2005; 258(1):333-338. http://dx.doi.org/10.1016/j. wear.2004.09.044.
14. Rutherford K and Hutchings I. A micro-abrasive wear test, with particular application to coated systems. Surface and Coatings Technology. 1996; 79(1):231-239. http://dx.doi. org/10.1016/0257-8972(95)02461-1.
15. Silva WM, Carneiro JRG and Trava-Airoldi VJ. XPS, XRD and laser raman analysis of surface modified of 6150 steel substrates for the deposition of thick and adherent diamond-like carbon coatings. Materials Research. 2013; 16(3):603-608. http:// dx.doi.org/10.1590/S1516-14392013005000027.
16. Silva WM, Trava-Airoldi VJ and Chung YW. Surface modification of 6150 steel substrates for the deposition of thick and adherent diamond-like carbon coatings. Surface and Coatings Technology. 2011; 205(12):3703-3707. http://dx.doi. org/10.1016/j.surfcoat.2011.01.013.