*e-mail: [email protected] Received: 08/19/2013 / Accepted: 10/28/2013
Segmenting mammographic microcalcifi cations using a semi-automatic
procedure based on Otsu’s method and morphological fi lters
Marcelo de Almeida Duarte*, André Victor Alvarenga, Carolina Maria Azevedo, Maria Julia Gregório Calas, Antonio Fernando Catelli Infantosi, Wagner Coelho de Albuquerque Pereira
Abstract Introduction: Breast cancer has the second highest world’s incidence rate, according to the Brazilian National Cancer Institute (INCa). Clinical examination and mammography are the best methods for early diagnosis. Computer-aided detection (CADe) and computer-aided diagnosis (CADx) systems are developed to improve mammographic diagnosis. Basically, CADx systems have three components: (i) segmentation, (ii) parameters extraction and selection, (iii) lesion classifi cation. The fi rst step for a CADx system is segmentation. Methods: A microcalcifi cation segmentation method is proposed, based on morphological operators, Otsu’s Method and radiologists’ knowledge. Pre-processing with top-hat operators improves contrast and reduces background noise. The Otsu’s method automatically selects the best grey-level threshold to segment microcalcifi cations, obtaining binary images. Following, inferior reconstruction and morphological dilatation operators are applied to reconstruct lost structure details and fi ll small fl aws in the segmented microcalcifi cations. Finally, the Canny edge detection is applied to identify microcalcifi cations contour candidates for each region-of-interest (ROI). Two experienced radiologists intervene in this semi-automatic method, fi rstly, selecting the ROI and, then, analyzing the segmentation result. The method was assessed in 1000 ROIs from 158 digital images (300 dpi, 8 bits). Results: Considering the radiologists opinion, the rates of ROIs adequately segmented to establish a diagnosis hypothesis were 97.8% for one radiologist and 97.3% for the other. Using the Area Overlap Measure (AOM) and the 2136 microcalcifi cations delineated by an experienced radiologist as gold standards, the method achieved an average AOM of 0.64±0.14, being 0.56±0.09 for small microcalcifi cations and 0.66±0.13 for the large ones. Moreover, AOM was 0.64±0.13 for the benign and 0.64±0.14 for the malignant lesions with no statistical differences between them. Conclusion: Based on these fi ndings, the proposed method could be used to develop a CADx system that could help early breast cancer detection.
Introduction
According to the Brazilian National Cancer Institute – INCa (Instituto..., 2012a), breast cancer has the second highest incidence rate in the world, being responsible for 22% of the new cases of cancer per year. Its incidence is growing in developed and developing countries and although most frequent in women, in 2008, it caused 125 (1.05%) men deaths in Brazil. Death rates related to breast cancer in Brazil are higher, mainly due to late diagnosis, when the disease is already in advanced stage (Instituto..., 2012a). Also according to INCa (Instituto..., 2012b), early detection and tumour removing in an initial phase
are the more eficient strategies to reduce death rates.
Clinical and mammographic examinations have
been considered the best methods to ind early signs
of breast cancer. The mammographic exam aims at identifying non-palpable breast lesions (Instituto..., 2012b). Nevertheless, several factors, such as the physicians’ knowledge and experience, the equipment quality and the presence of adipose and glandular tissues types, may interfere in the accuracy of
mammograms, making diagnosis dificult. Even if
mammography is carried out with adequate equipment
and by an experienced technician, the inal exam
quality is highly dependent on the breast tissue itself, as the more adipose it is, the easier to analyse and diagnose (Azevedo, 1994). Barlow (2002) reported a large number of errors and divergent results in mammographic exams made in USA, mainly due to the radiologists’ inexperience, besides the already
mentioned dificulties.
Microcalciications have been considered a relevant
sign of malignancy since they are present in a great number of malignant lesions. Based on histological examination, 60% to 80% of the carcinomas reveal
the presence of microcalciications although they
are detected in just 30% to 50% of mammograms (Halkiots etal., 2007). The dificulty of detecting
microcalciications in mammograms is due to their
variation in shape (from granular to rod shapes), orientation, brightness, diameter size and also the surrounding tissue (Wei etal., 2009). In an effort to
help in microcalciications diagnosis, Computer-Aided
Detection (CADe) and Computer-Aided Diagnosis
(CADx) systems have been developed (Elter and
Horsch, 2009; Nishikawa, 2007). Such systems are projected to help minimising the false-positive and false-negative rates of breast cancer diagnosis, and are usually based on parameters extracted
from microcalciications (De Santo etal., 2003; Veldkamp etal., 2000).
CADe systems aim at automatic detecting lesions
(including microcalciications), while CADx are used to perform their classiication. These latter systems
are generally used as a second opinion, aiming at
increasing the accuracy of radiologists’ inal decision
(Calas etal., 2012; Chen and Lee, 1997; Cheng etal.,
2003; Elter and Horsch, 2009; Jalalian etal., 2013; Nishikawa, 2007). CADx are basically composed of three steps: (i) segmentation, (ii) parameters
extraction and selection, (iii) lesions classiication.
Although the individual improvement of anyof them could enhance the whole system performance, the segmentation is considered a very important step in
CADx systems, since it deines the microcalciications
characteristics to be used in the next CADx steps (Arikidis etal., 2010; Paquerault etal., 2004; Timp and Karssemeijer, 2004).
Several techniques have been used to segment microcalcifications, such as active contours (Arikidis etal., 2008, 2010; Paquerault etal., 2004), grey-level histogram features associated to fuzzy
rule-based classiiers (Gravielides etal., 2002), methods based on image entropy (Mohanalin etal., 2009), wavelet analysis (Chen and Lee, 1997) and
morphological ilters (Halkiots etal., 2007; Stojic etal., 2006). Despite the various methods presented in
literature, segmenting individual microcalciications
is still an issue to be addressed (Arikidis etal., 2010). This work presents a microcalcification segmentation semi-automatic method, based on morphological operators and Otsu’s Method (Otsu, 1979). The method is applied to 1000 Regions of interest (ROIs) from images provided by the Digital Database for Screening Mammography (DDSM) – University of South Florida (University..., 2012). As a pre-processing procedure, top-hat morphological operators are used to enhance the image
contrast between microcalciications and background,
while Otsu’s Method automatically selects the best
grey-level threshold to segment microcalciications. As a post-processing stage, a set of morphological ilters is applied to ill up any small law in the segmented microcalciications. The proposed method incorporates
Methods
In this section, we firstly describe the used database, then the method developed to segment the
microcalciications present in a ROI and inally, the
evaluation methodologies of the results.
The database
The database is composed of 158 mammograms from 78 patients, extracted from three image sets of the DDSM database: benign_1, benign_2 and cancer_1. Similarly to other authors (De Santo etal., 2003; Fu etal., 2005; Stojic etal., 2005), in order to reduce the computational time, the number of bits of these images (300 dpi), originally 12 or 16, were reduced to 8 bits. Moreover, 1000 regions of interest (ROIs) up to 41 × 41 pixels (Arikidis etal., 2008) were selected by the double reading procedure. First, a ROI was chosen by an experienced radiologist
and then independently conirmed by another. Five
hundred ROIs were selected from images of the benign
databases (793 microcalciications) and another 500 from the cancer database (1343 microcalciications).
All ROIs were from delimited regions, already marked in the DDSM images (University..., 2012).
The microcalciications were also classiied by their
maximum diameters, following the criterion proposed by Arikidis etal. (2010). Thus, the small lesions
(608 microcalciications) were those with maximum
diameters smaller than 460 µm, otherwise they were
classiied as large lesions (1528 microcalciications).
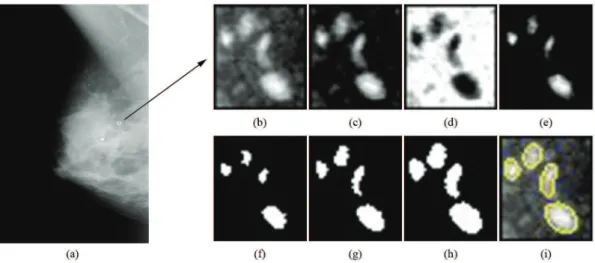
An example of a ROI extracted from a mammogram
(Figure 1a) with malignant large microcalciications
is depicted in Figure 1b.
Segmentation procedure
In order to improve the contrast and reduce the background noise of the DDSM images, a pre-processing procedure has been used. Firstly, to enhance structures smaller than the structuring
element (SE), a top-hat by opening by reconstruction was applied to the original ROI. Due to differences
in the sizes and shapes of microcalciications, this
morphological operator was always applied to the
original ROI, using three different SEs, that is, a cross-shaped SE of 3-pixel size, a disc-shaped SE of 5-pixel diameter, and a disc-shaped SE of 17-pixel
diameter, resulting in three different images, here called “thor”. Then, to remove the structures that present the highest grey-levels and also to enhance the background noise, these resulting images were
iltered by a top-hat by closing by reconstruction with
a disc SE of 51-pixel diameter, resulting in images
here called “thcr”. Finally, a point-wise subtraction between the images “thor” and “thcr” was performed and the “diff” images were obtained. In these images,
the possible microcalciications are emphasised whilst
the background noise is almost totally removed. All
SEs used in this procedure have been heuristically
chosen.
The pre-processing technique is illustrated in Figure 1. In this case, the original ROI (Figure 1b) was extracted from a medium lateral oblique view of a digital mammogram (Figure 1a). Firstly, the top-hat
by opening by reconstruction with a disc-shaped SE of 17-pixel diameter was applied, resulting the image depicted in Figure 1c. This latter image was then
iltered by the top-hat by closing by reconstruction (Figure 1d). After performing the point-wise subtraction between “thor” and “thcr” images, the possible
microcalciications (white structures) are emphasised
whilst the background noise is almost totally removed (Figure 1e).
Following the pre-processing procedure, the Otsu’s method was applied to the “diff” images. Hence, by automatically determining the grey-level threshold, binary images were obtained, as the one illustrated by Figure 1f. It is worth emphasizing that the Otsu’s method assumes that any image contains two classes of pixels (e.g. foreground and background) and calculates the optimum threshold separating those two classes so that their combined spread (intra-class variance) is minimal (Otsu, 1979).
As a post-processing procedure, an inferior reconstruction operator was applied to the binary
images (disc SE with 3-pixel diameter) to reconstruct
possible lost structure details (illustrated in Figure 1g). The binary images were used as mark, while the “diff” images were set as the reference mask for the reconstruction. Then, a morphological dilatation
(cross SE with 3-pixel size) was applied to ill any small law in the segmented microcalciications (exempliied by Figure 1h). Finally, the canny edge detection was applied to identify microcalciications
contours candidates for each ROI (illustrated in Figure 1i). Similarly to the pre-processing, here the
SEs were also heuristically determined.
The segmentation method was implemented in MATLAB (Mathworks Inc., Natick, MA) using the SDC Morphology Toolbox V1.6 (SDC Information Systems, Naperville, USA).
Evaluating the segmentation methodology
In a qualitative evaluation, two experienced radiologists (more than 30 and 15 years of practice, respectively) independently analyse the results. According to Cheng etal. (2003), radiologists’ opinions are well accepted for evaluating segmentations methods. This evaluation procedure has been carried out nearly two months after the ROIs double reading selection procedure previously described. For each of the 1000
selected ROIs, it was created a igure depicting the
original ROI and their three correspondent segmented
images (one for each SE for the top-hat by opening by reconstruction operator used in the pre-processing
procedure), containing the microcalciications contours candidates. These igures were then presented
independently and randomly to both radiologists.
For each igure, the radiologist should choose, among
the three segmented images, the one considered as the best for elaborating an adequate diagnosis hypothesis. If he is not able to elaborate a diagnosis hypothesis with any of them, none of the segmented images is considered adequate.
A quantitative evaluation process was carried out independently of the qualitative one. The most experienced radiologist manually delineated
(that is, segmented) the 2136 microcalciications of
the 1000 selected ROIs and these contours were taken as gold standards for calculating the Area Overlap Measure (AOM), expressed by (Arikidis etal., 2010):
area ( )
AOM
area ( )
∩ =
∪
M R
M R (1)
where M is the microcalciication manually delineated by the radiologist and R represents the segmentation obtained with the proposed method (that is, considered by the radiologist as the best one for elaborating an adequate diagnosis hypothesis). The symbol ∩ is the intersection, that is, the number of pixels common to both segmentation procedures and the symbol ∪ represents the union of the M and R areas. Hence, if there is no overlap between the delineated
microcalciication and the one from the proposed
method, AOM = 0. For a complete overlap, AOM = 1. The Wilcoxon non-parametric statistical test for paired data (Wilcoxon two-sided rank sum test, p-values < 0.05) was performed to evaluate if there
were signiicant differences between the results of AOMs from benign and malignant microcalciications,
and from small and large ones.
Results
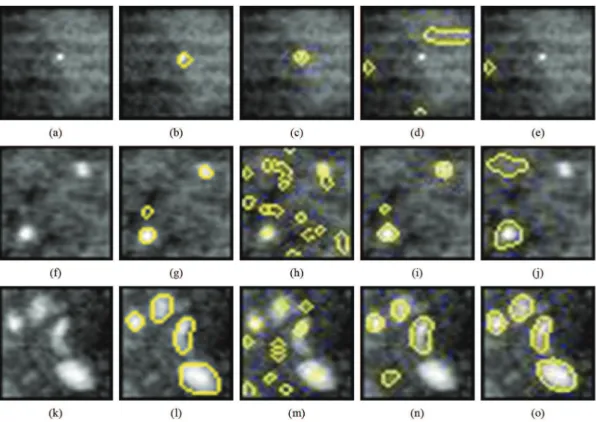
Figure 2 depicts three original ROIs and respective
segmented images obtained by using the different SEs
described in the pre-processing procedure (top-hat by opening by reconstruction operator). For the sake
of comparison, the microcalciications manually
delineated by the most experienced radiologist for each original ROI are also shown. According to both radiologists’ opinion, the most adequate segmentation was achieved by applying a 3-pixel
diameter cross-shaped SE (Figure 2c) to the ROI
of Figure 2a. On the other hand, for a different ROI (Figure 2f), they considered the image segmented with
the disc-shaped SE with 5-pixel diameter (Figure 2i)
as the most adequate one. Furthermore, for the ROI depicted in Figure 2k, the most adequate segmentation (Figure 2o) was achieved by applying the disc-shaped
For the 1000 selected ROIs, one of the radiologists indicated at least one adequate segmented image, among the three presented, in 97.8% of them, independently of being extracted from the benign or malignant image databases (Table 1). For the other radiologist, this value was 97.3%. Taking into account only the 500 ROIs extracted from the benign databases, the rates were 98.0% for one of the radiologists and 97.8% for the other. For 500 ROIs selected from the cancer database, these rates were 97.6% and 96.8%, respectively.
Taking the radiologists’ opinion separately
(Table 2), the 17-pixel diameter disc-shaped SE resulted in adequate microcalciications segmentation for at least
74.3% of the ROIs. The resulting segmentation with
the 5-pixel diameter disc-shaped SE was considered
adequate for at least 20.2% of the ROIs, while for
the 3-pixel size cross-shaped SE this igure was at
least 0.3%. In the worst case, the second radiologist
has considered that microcalciications presented
in 2.7% of the ROIs were inadequately segmented,
independent of the SE used.
Considering the joint radiologists’ opinion (Table 3), there is an agreement between them that
the microcalciication segmentation method proposed
here was adequate for 966 ROIs (96.6%), that is, both radiologists considered themselves able to formulate a diagnosis hypothesis with at least one of the three resulting segmented images. Also for ROIs with bright (Figure 3a) and dark (Figure 3b) backgrounds and close to artifacts (Figure 3c), according to the radiologists’ opinion, the method was capable to adequately
Figure 2. (a), (f) and (k) Original ROIs. (b), (g) and (l) their respective microcalciications manually delineated by the most experienced radiologist. Respective segmentation results obtained by using the cross-shaped SE with a 3-pixel size (c), (h) and (m); disc-shaped SE with a 5-pixel diameter (d), (i) and (n) and disc-shaped SE with a 17-pixel diameter (e), (j) and (o). For ROI (a), both radiologists indicated (c)
as the most adequate to formulate a diagnosis hypothesis. They also indicated (i) and (o) as the most adequate for (f) and (k), respectively.
Table 1. Rates of adequate (AD) and inadequate (INAD) microcalciications segmentation images, according to radiologists’ opinion, in
ROIs extracted from images of the benign and malignant databases.
AD
(benign) (benign)INAD (malignant)AD (malignant)INAD (total)AD INAD(total) Total 1st radiologist 490
(98.0%)
10 (2.0%)
488 (97.6%)
12 (2.4%)
978 (97.8%)
22
(2.2%) 1000
2nd radiologist 489 (97.8%)
11 (2.2%)
484 (96.8%)
16 (3.2%)
973 (97.3%)
27
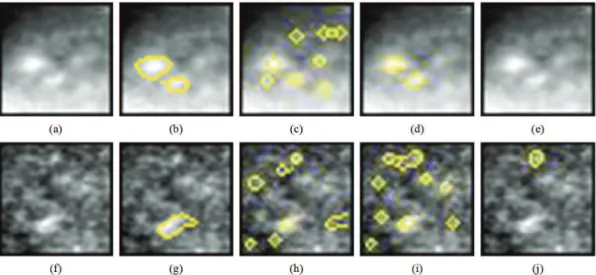
segment the microcalciications (Figures 3g, 3h and 3i, respectively), although with different SE. On the other hand, for ifteen ROIs (1.5%), both radiologists
considered the resulting segmentations, independent
of the SE used, as inadequate (e.g. Figures 4a and 4f).
For another nineteen ROIs (1.9%), the radiologists disagreed in indicating the same segmented image (e.g. Figures 5a and 5f).
Based on the 2136 microcalciications (from the
1000 selected ROIs) manually delineated by the most
experienced radiologist, the average Area Overlap Measure (AOM) was estimated as 0.64 ± 0.14. For the 793 benign lesions, AOM = 0.64 ± 0.13 while for the 1343 malignant ones, AOM = 0.64 ± 0.14. Furthermore,
there is no signiicant difference between the AOM of malignant and benign microcalciications (p = 0.81,
Wilcoxon non-parametric statistical test for paired
data). On the other hand, there is statistical signiicant
difference between small (AOM = 0.56 ± 0.09 for 608 lesions with maximum diameters smaller than
Table 2. Results of radiologists’ opinion separated by SE used to achieve an adequate segmentation for a diagnosis hypothesis.
3-pixel
cross-shaped disc-shaped5-pixel disc-shaped17-pixel Not Adequate Total 1st
radiologist (0.3%)3
202 (20.2%)
773 (77.3%)
22
(2.2%) 1000 2nd
radiologist (0.9%)9
221 (22.1%)
743 (74.3%)
27
(2.7%) 1000
Table 3. Rates of agreement between both radiologists, regarding segmentation adequacy for a possible diagnosis hypothesis.
Results (1stAdequate radiologist) (1Not Adequatest radiologist) Total
Adequate
(2nd radiologist) 966 (96.6%) 7 (0.7%) 973 (97.3%)
Not Adequate
(2nd radiologist) 12 (1.2%) 15 (1.5%) 27 (2.7%)
Total 978 (97.8%) 22 (2.2%) 1000 (100%)
Figure 4. Examples of original ROIs (a) and (f) for which both radiologists considered segmentation to be inadequate. (b) and (g) respective microcalciications manually delineated by the most experienced radiologist; (c) and (h) respective segmented images using the cross-shaped SE with a 3-pixel size; (d) and (i) disc-shaped SE with a 5-pixel diameter; and (e) and (j) disc-shaped SE with a 17-pixel diameter.
Figure 5. Examples of ROIs (a) and (f) for which the radiologists disagreed about the adequacy of the segmented images using: (c) and (h) the cross-shaped SE with a 3-pixel size, (d) and (i) disc-shaped SE with a 5-pixel diameter and (e) and (j) disc-shaped SE with a 17-pixel diameter. Images (b) and (g) are the microcalciications manually delineated by the most experienced radiologist. For (a), this radiologist
chose (d) as adequate while the other chose none of them. For (b), no segmentation was chosen by this radiologist, while the other pointed out (i) as adequate for a diagnosis hypothesis.
460 µm) and large (AOM = 0.66 ± 0.13 for 1528
lesions) microcalciications (p < 0.0001).
The cumulative distribution curves of the AOM for each case can be observed in Figures 6 and 7. In
Figure 6 one can see that for all microcalciications
(full line), more than 50% have AOM higher than 0.7, while at least 80% have AOM higher than 0.6.
malignant and benign microcalciications are similar.
In Figure 7, note that cumulative distribution curve of
AOM is higher for large microcalciications.
Discussion
This work was focused on the irst stage of a CADx system, which is segmenting microcalciications
independently of their sizes and shapes. With this aim, the proposed method, based on Otsu’s Method
and morphological operators iltering, always uses three different SEs for the top-hat by opening by reconstruction operator applied to the ROIs in the beginning of the pre-processing procedure. For each
ROI, three segmented images (one for each used SE
size and shape) are presented to the radiologist who chooses the image segmentation that allows elaborating the diagnosis hypothesis.
According to the radiologists’ opinion (Table 2), 77.3% (radiologist #1) and 74.3% (#2) of the ROIs
Figure 6. Cumulative distribution curves of the Area Overlap Measures for the MM method, considering (full line) all microcalciications; (dashed) malignant microcalciications; (dotted) benign microcalciications.
had microcalciications adequately segmented by using the 17-pixel disc-shaped SE. On the other hand,
the adequacy rates were 20.2% (#1) and 22.1 (#2) by
employing the 5-pixel diameter disc-shaped SE and
0.3% (#1) and 0.9% (#2) for the 3-pixel cross-shaped
SE. These results indicate the importance of using SE of different sizes and shapes to segment different microcalciications. Moreover, the importance of making the right choice of the SE can also be observed qualitatively in Figure 3, where microcalciications of
different sizes and also a ROI containing an artifact (Figure 3c) are properly segmented (Figure 3i).
Herein, the proposed segmentation procedure could not, in some cases, segment all individual
microcalciications in a ROI. Nevertheless, considering
the radiologists’ knowledge, those cases were still considered adequate since radiologists agreed about their diagnosis based on the segmented images. Taking into account the radiologists’ opinion independently, the resulting segmentations were considered inadequate to perform a diagnosis for no more than 2.2% of the benign lesions and 3.2% for the malignant ones. This
rate was 2.7%, considering all microcalciications
(Table 1). Moreover, considering the joint radiologists’ opinion about the adequacy (Table 3), they felt comfortable to indicate at least one segmented result as adequate to formulate a diagnosis hypothesis for
96.6% of the ROIs. They pointed out just ifteen
ROIs (1.5%) as not adequately segmented for this purpose (e.g. Figure 4). For nineteen ROIs (1.9%), the radiologists disagreed in indicating the same segmented image (e.g. Figure 5). In all these 34
ROIs, it was noticeable signiicant background noise
(e.g. Figures 4a, 4f, 5a and 5f), and very small
microcalciications (e.g. Figures 4a and 5f).
Duarte etal. (2010a, 2010b) used a different semi-automatic procedure to perform the segmentation
of microcalciications and their clusters present in
ROIs from images of a different database (13 digital mammograms from eight INCa patients and 41 digitalized ones from 12 patients of the Gaffrée & Guinle University Hospital). In these works, images were segmented according to the grey-levels
thresholds extracted from their morphological iltered
grey-levels histogram (the thresholds were taken as
the peaks of the iltered histogram). A set containing
several segmented images, one for each threshold, was presented to the radiologists and, in some cases, they had to examine more than 10 segmented ROIs candidates to choose just one as the best result, spending a long time to complete the entire task. In the present work, the segmentation method was improved by using the Otsu’s Method to automatically determine the grey-level threshold for the three images
generated by the application of the three SEs in the
top-hat by opening by reconstruction operator, in the pre-processing procedure. Hence, the radiologists can simply decide whether the segmentation is adequate or not for diagnosis purposes, just observing three different segmented images, demonstrating a clear evolution of the method.
Moreover, the rates of ROIs with microcalciications
considered as adequately segmented to establish a diagnosis hypothesis, according to two experienced radiologists, were 97.8% for one radiologist and 97.3% for the other (Table 1). These rates were higher than those (91.9% and 88.6% to each radiologist) achieved by Duarte etal. (2011), in which the same method proposed here was assessed with a different database (54 mammograms from INCa and Gaffrée & Guinle University Hospital patients). In this case, 236 ROIs were processed (also 300 dpi, 8 bits), containing malignant (104 ROIs) and benign (132 ROIs)
microcalciications.
Paquerault et al. (2004) also compared, qualitatively, the results obtained in the application of
two microcalciications segmentation methods: a Radial
Active Contours method (RAC), based on gradients, and a Region-Growing method (RG). The authors used a database with mammograms of 76 patients, selected from the archives of the Department of Radiology at the University of Chicago - US, containing
144 microcalciications clusters. The evaluation was
performed by two observers (O1 and O2) who were instructed to rate the accuracy of the segmentation based on how well the segmented contour agreed with their mentally visualized contours. The accuracy rates were 67.9 ± 22.9 (O1) and 31.4 ± 24.5 (O2) for the RG method, and 91.7 ± 3.2 (O1) and 83.2 ± 12.4 (O2), for the RAC. Hence, we have chosen the minimum rate for the RAC method by Paquerault etal. (2004) (83.2 – 12.4 = 70.8) to classify a segmented image as adequate, which results in considering 97.3%
of the ROIs as adequately segmented. This inding suggests an eficacy at least similar to the RAC method
proposed by Paquerault etal. (2004). The authors also implemented a third technique, based on the Watershed transform, but have not compared the accuracy rates obtained with this technique. It is important to quote that in these authors’ work, all segmentation methods
begin with manually identiied seed points, which
were carefully selected to represent the centers of
the individual microcalciications. In the method here
proposed, the seed point is never required.
before investigating two semi-automatic methods of
microcalciications segmentation: Adaptive Threshold
and Watershed Segmentation. The authors conclude, based on a qualitative radiologists’ evaluation, that Watershed segmentation method is more accurate than the Adaptive Threshold one, although being more time consuming.
By observing the cumulative distribution curves of the Area Overlap Measures in Figure 6, it can be seen
that more than 50% of the 2136 microcalciications (actually, 52.3% = 1117 microcalciications) have
AOM higher or equal than 0.7 and at least 80%
(1719 microcalciications = 80.5%) have AOM
higher or equal than 0.6 (full line curve). A similar behavior can be seen for the benign (dotted) and
malignant (dashed) microcalciications. Figure 7
shows that approximately 11% of the small (dotted)
microcalciications (11.5% = 70 microcalciications)
have AOM higher or equal than 0.7 and at least 55%
(377 microcalciications = 55.4%) have AOM higher or equal than 0.6. For the large microcalciications
(dashed), AOM was higher or equal than 0.7, approximately, for 60% of them (60.8% = 929
microcalciications) and it was higher or equal than 0.6 for at least 85% (1311 microcalciications = 85.8%).
Considering these results, we observed that the proposed method performed equally, independent of the kind of lesion (benign or malignant).
Additionally, considering that microcalciications shapes use to be determinant for the classiication of
lesion types (Jalalian etal., 2013; Paquerault etal., 2004; Veldkamp et al., 2000), these results
suggest that microcalciications shapes were not
impediments for this method to segment any kind of
microcalciication. However, the method is sensible to the microcalciications sizes.
Using the same database, but not exactly the same images, Arikidis etal. (2010) presented a method based
on Active Contours to segment microcalciications,
which also employs radiologists’ intervention. In that work, the seed to initialise the Active Contours should
be manually deined by a radiologist, and a ROI is deined as a square of 81 × 81 pixels, centered at the
seed point. Hence, based on this scheme, their method
will segment only the microcalciications individually
marked by the radiologist, which tends to be time consuming. The authors reported that the computational
time for segmenting each microcalciication was
0.42 s. Arikidis etal. (2010) assessed the results by comparing the obtained segmentation areas with the
ones manually deined by a radiologist, and pointed
out an AOM mean value of 0.61 ± 0.16 for large
microcalciications and 0.61 ± 0.14 for the small ones.
In our proposed method, this result was a slightly
higher for the large microcalciications (0.66 ± 0.13),
but a little smaller (0.56 ± 0.09) for the small lesions. Arikidis etal. (2010) did not present results based on
the microcalciications types.
In the proposed method, the computation time was 0.23 s to segment each ROI, independent of the
number of microcalciications, which could be up to
13. For this extreme case, the method described by Arikidis etal. (2010) would take 5.46 s to process all
the 13 microcalciications and hence some 23 times
the computation time of the method here proposed. Different from Paquerault etal. (2004) and Arikidis etal. (2010) methods, where the radiologists’ intervention is required in an intermediate stage of the segmentation procedure (e.g., introducing a seed point
to represent the microcalciication center), the proposed
method integrates the radiologists’ knowledge in a key step of the process, choosing the image segmentation that allows elaborating the diagnosis hypothesis. As a result of this synergy, the procedure applied to the studied ROIs was able to adequately segment more
than 97 % of the microcalciications.
Overall, this paper presents a semi-automatic method to segment microcalcifications from mammographic images, which incorporates the radiologists’ opinion in the final stage of the segmentation method. In the tested database, according to two experienced radiologists, the rates of ROIs
with microcalciications considered as adequately
segmented were 97.8% for one radiologist and 97.3% for the other. In a quantitative evaluation, the average Area Overlap Measure was 0.64 ± 0.14, considering
all 2136 microcalciications delineated. There were no
statistical differences between the AOMs calculated for the benign and the malignant lesions. These results encourage us to use the proposed segmentation method in extracting parameters from the segmented
microcalciications and clusters, intending to develop a classiier algorithm to discriminate malignant and
benign ones, which could integrate a CADx system.
Acknowledgments
The authors acknowledge the Brazilian agencies CNPq,
CAPES and FAPERJ for the inancial support, and
the Gama Filho University for technical and partial
inancial support.
References
Arikidis NS, Karahaliou A, Skiadopoulos S, Koriatis P, Likaki E, Panayiotakis G, Costaridou L. Size-adapted microcalciication segmentation in mammography utilizing scale-space signatures. Computerized Medical Imaging and Graphics. 2010; 34(6):487-93. http://dx.doi.org/10.1016/j. compmedimag.2009.12.009
Azevedo MC. Manual de radiologia da mama. Rio de Janeiro: INCa, DuPont, Microservice; 1994.
Barlow WE. Performance of diagnostic mammography for women with signs or symptoms of breast cancer. Journal of the National Cancer Institute. 2002; 94(1):1151-9. http:// dx.doi.org/10.1093/jnci/94.15.1151
Calas MJG, Gutfilen B, Pereira WCA. CAD e mamograia: por que usar essa ferramenta? Radiologia Brasileira. 2012; 45(1):46-52. http://dx.doi.org/10.1590/ S0100-39842012000100011
Chen CH, Lee GG. On digital mammogram segmentation and microcalciication detection using multiresolution wavelet analysis. Graphical Models and Image Processing. 1997; 59(5):349-64. http://dx.doi.org/10.1006/ gmip.1997.0443
Cheng HD, Cai X, Chen X, Hu L, Lou X. Computer-aided detection and classification of microcalciications in mammograms: a survey. Pattern Recognition. 2003; 36(12):2967-91. http://dx.doi.org/10.1016/ S0031-3203(03)00192-4
De Santo M, Molinara M, Tortorella F, Vento M. Automated classiication of clustered microcalciications by a multiple expert system. Pattern Recognition. 2003; 36(1):1467-77. http://dx.doi.org/10.1016/S0031-3203(03)00004-9
Duarte, MA, Alvarenga, AV, Azevedo, CM, Infantosi, AFC, Pereira, WCA. Microcalciications segmentation procedure based on morphological operators and histogram iltering. In: MEDICON2010: Proceedings of the 12nd Mediterranean Conference on Medical and Biological Engineering and Computing; 2010 May 27-30; Chalkidiki. Berlin: Springer-Verlag, 2010a. v. 29. p. 355-358.
Duarte MA, Alvarenga AV, Azevedo CM, Infantosi AFC, Pereira WCA. Segmenting microcalciications by Top-hat morphological operators and histogram iltering. In: CBEB 2010: Proceedings of the XXII Brazilian Congress on Biomedical Engineering; Nov 21-25 2010; Tiradentes. Rio de Janeiro: Soc. Bras. Eng. Biomédica; 2010b. p. 422-5. Duarte MA, Alvarenga AV, Azevedo CM, Infantosi AFC, Pereira WCA. Automatic microcalciications segmentation procedure based on Otsu’s method and morphological ilters. In: PAHCE 2011: Proceedings of Pan American Health Care Exchange; 2011 Mar 28 - Apr 1; Rio de Janeiro. Piscataway: IEEE; 2011. v. 1, p. 102-106.
Elter M, Horsch A. CADx of mammographic masses and clustered microcalciications: A review. Medical Physics. 2009; 36(6):2052-68. http://dx.doi. org/10.1118/1.3121511
Fu JC, Lee SK, Wong STC, Yeh JY, Wang AH, Wu HK. Image segmentation feature selection and pattern classiication for mammographic microcalciications. Computerized Medical
Imaging and Graphics. 2005; 29(1):419-29. http://dx.doi. org/10.1016/j.compmedimag.2005.03.002
Gravielides MA, Lo JY, Floyd CEF Jr. Parameter optimization of a computer-aided diagnosis scheme for the segmentation of microcalciication clusters in mammograms. Medical Physics. 2002; 29(4):475-83. http:// dx.doi.org/10.1118/1.1460874
Halkiots S, Botsis T, Rangoussi M. Automatic detection of clustered microcalciications in digital mammograms using mathematical morphology and neural networks. Signal Processing. 2007; 87(1):1559-68. http://dx.doi. org/10.1016/j.sigpro.2007.01.004
Instituto Nacional de Câncer - INCa. Tipos de Câncer, Mama [Internet]. Brasília: Ministério da Saúde; 2012a. [cited 2012 July 30]. Available from http://www2.inca. gov.br/wps/wcm/connect/tiposdecancer/site/home/mama.
Instituto Nacional de Câncer - INCa. Câncer de mama [Internet]. Brasília: Ministério da Saúde; 2012b. [cited 2012 July 30]. Available from http://www1.inca.gov.br/inca/ Arquivos/publicacoes/cancer_mama_2010.pdf.
Jalalian A, Mashoror SBT, Mahmudb HR, Saripan MIB, Ramli ARB, Karasi B. Computer-aided detection/diagnosis of breast cancer in mammography and ultrasound: a review. Clinical Imaging. 2013; 37(1):420-6. http://dx.doi. org/10.1016/j.clinimag.2012.09.024
Mohanalin J, Kalra PK, Kumar N. Microcalciication segmentation using normalized Tsallis entropy: an automatic “q” calculation by exploiting type II fuzzy sets. IETE Journal of Research. 2009; 25(2):90-6. http://dx.doi. org/10.4103/0377-2063.53240
Moradmand H, Setayeshi S, Targhi HK. Comparing methods for segmentation of microcalciication clusters in digitized mammograms. IJCSI International Journal of Computer Science. 2011; 8(6):104-8.
Nishikawa RM. Current status and future directions of computer-aided diagnosis in mammography. Computerized Medical Imaging and Graphics. 2007; 31(1):224-35. http:// dx.doi.org/10.1016/j.compmedimag.2007.02.009
Otsu N. A threshold selection method from gray-level histograms. IEEE Transactions on Systems, Man, and Cybernetics. 1979; 9(1):62-66. http://dx.doi.org/10.1109/ TSMC.1979.4310076
Paquerault S, Yarusso LM, Papaioannou J, Jiang Y. Radial gradient-based segmentation of mammographic microcalciications: observer evaluation and effect on CAD performance. Medical Physics. 2004; 31(9):2648-57. http:// dx.doi.org/10.1118/1.1767692
Stojic T, Reljin I, Reljin B. Local contrast enhancement in digital mammography by using mathematical morphology. In: ISSCS 2005: Proceedings of the International Symposium on Signals, Circuits and Systems; 2005; Iasi. Iasi; 2005. v. 2, n. 1, p. 609-12. http://dx.doi.org/10.1109/ISSCS.2005.1511314
Timp S, Karssemeijer N. A new 2D segmentation method based on dynamic programming applied to computer aided detection in mammography. Medical Physics. 2004; 31(5):958-71. http://dx.doi.org/10.1118/1.1688039
University of South Florida. DOD Breast Cancer Research Program, US Army Research and Material Command, Digital Database for Screening Mammography – DDSM [Internet]. University of South Florida; 2012. [cited 2012 July 30]. Available from http://marathon.csee.usf.edu/ Mammography/Database.html.
Veldkamp WJ, Karssemeijer N, Otten JDM, Hendriks JHCL. Automated classiication of clusters microcalciications into malignant and benign types. Medical Physics. 2000; 27(11):2600-8. http://dx.doi. org/10.1118/1.1318221
Wei L, Yanga Y, Nishikawa RM. Microcalciication classiication assisted by content-based image retrieval for breast cancer diagnosis. Pattern Recognit. 2009; 42(6):1126-32. http://dx.doi.org/10.1016/j.patcog.2008.08.028
Authors
Marcelo de Almeida Duarte*, Antonio Fernando Catelli Infantosi, Wagner Coelho de Albuquerque Pereira Programa de Engenharia Biomédica, Instituto Alberto Luiz Coimbra – COPPE, Universidade Federal do Rio de Janeiro – UFRJ, CP 68510, CEP 21941-972, Rio de Janeiro, RJ, Brasil.
Marcelo de Almeida Duarte
Electronic Engineering Department, Gama Filho University – UGF, Rio de Janeiro, RJ, Brazil.
André Victor Alvarenga
Laboratory of Ultrasound, National Institute of Metrology, Standardization and Industrial Quality – Inmetro, Rio de Janeiro, RJ, Brazil.
Carolina Maria Azevedo
Gaffrée & Guinle University Hospital, University of Rio de Janeiro – UNI-RIO, Rio de Janeiro, RJ, Brazil.
Maria Julia Gregório Calas