UNITARY INPUT DEA MODEL TO IDENTIFY BEEF CATTLE PRODUCTION SYSTEMS TYPOLOGIES
Eliane Gonc¸alves Gomes
1*, Urbano Gomes Pinto de Abreu
2,
Jo˜ao Carlos Correia Baptista Soares de Mello
3,
Thiago Bernardino de Carvalho
4and S´ergio de Zen
5Received July 1, 2010 / Accepted November 29, 2011
ABSTRACT.The cow-calf beef production sector in Brazil has a wide variety of operating systems. This suggests the identification and the characterization of homogeneous regions of production, with consequent implementation of actions to achieve its sustainability. In this paper we attempted to measure the perfor-mance of 21 livestock modal production systems, in their cow-calf phase. We measured the perforperfor-mance of these systems, considering husbandry and production variables. The proposed approach is based on data envelopment analysis (DEA). We used unitary input DEA model, with apparent input orientation, together with the efficiency measurements generated by the inverted DEA frontier. We identified five modal pro-duction systems typologies, using the isoefficiency layers approach. The results showed that the knowledge and the processes management are the most important factors for improving the efficiency of beef cattle production systems.
Keywords: Data Envelopment Analysis, Production Systems Characterization, Beef Cattle.
1 INTRODUCTION
Agribusiness is responsible for 25% of Brazilian GDP, 8% represented by livestock (CEPEA, 2009). Within this sector, the beef complex is consolidated as an important link in the production and international trade: Brazil is the largest exporter and the second largest producer of beef.
*Corresponding author
1Brazilian Agricultural Research Corporation, Embrapa Sede – SGE, Parque Estac¸˜ao Biol´ogica, Av. W3 Norte final, 70770-901 Bras´ılia, DF, Brazil. E-mail: [email protected]
2Embrapa Pantanal, Rua 21 de Setembro, 1880, 79320-90 Corumb´a, MS, Brazil. E-mail: [email protected] 3Fluminense Federal University, Production Engineering Department, Rua Passo da P´atria, 156, 24210-240 Niter´oi, RJ, Brazil. E-mail: [email protected]
4Center for Advanced Studies on Applied Economics, Av. P´adua Dias, 11, 13400-970 Piracicaba, SP, Brazil. E-mail: [email protected]
Thus, the study and the evaluation of beef cattle production systems are important tools for enhancing the performance of this sector. However, the studies about these systems and their productive performance, in the different Brazilian regions, are scarce (Arruda & Sugai, 1994).
The beef cattle production systems can be defined as the set of technologies and management practices, animal type, purpose of creation, race or racial grouping and ecological region where the activity is developed (Euclides Filho, 2000).
The central structure of the beef cattle production chain is the biological system of beef produc-tion, which includes the different stages of creation (cow-calf producproduc-tion, stocker producproduc-tion, feedlot beef production) and combinations, around which the producers are grouped (Cardoso, 1994). In Brazil, the cow-calf phase occurs predominantly in an extensive continuous grazing, with native and/or cultivated pastures, encompassing calves (until weaning or even one year old), cows, heifers and bulls.
Taking into account each phase of the beef cattle production systems and based on a cost-benefit analysis, it can be concluded that the cow-calf phase is the less profitable activity and the one that has the greater risk. However, it supports the entire structure of the production system and, according to Euclides Filho (2000), all technological investment that can improve efficiency will benefit the whole productive chain.
The systemic view has an undeniable importance in agriculture, although it is not yet sufficiently established in the Brazilian agricultural research. The aim of this study is to evaluate the per-formance of extensive livestock modal production systems in its cow-calf phase. We intend to measure the performance of these systems in some Brazilian municipalities, considering hus-bandry (zootechnical) and production variables, which have a direct impact on the income of the system. Additionally, we intend to identify types, or typologies, of some modal systems. We use data envelopment analysis (DEA), with unitary input and apparent, but false, input orientation. This is a DEA use as a multicriteria tool. The typologies are obtained according to the so called isoefficiency layers.
Typology is a theoretical construction based on a set of hypotheses about the structure or behav-ior of a system. It takes into account the diversity of components and their interrelationships. It is a categorization method based on the most important variables that compose the systems. In agricultural sciences, typologies have been used to support the characterization of the main pro-duction systems put in place by farmers in a given geographic area. The typologies of livestock production systems are based on the availability of production factors, qualitative information, and socio-economic, environmental and animal husbandry parameters. In the literature we can find different approaches to address this problem, focused on livestock systems (Halberget al., 2005; Castaldoet al., 2006; Severo & Miguel, 2006; Teixeira & Silva, 2007; Gasparet al., 2009; McDermottet al., 2010; Abreuet al., 2011) or not (Gomeset al., 2005; Laoubi & Yamao, 2009; Braitoet al., 2011).
selected for this case study. Then we present the proposed modeling, and the results are discussed in Section 5. Section 6 presents conclusions, followed by the bibliographic references cited throughout the paper.
2 DATA SOURCE
This paper and its findings are part of a project that aims at the diagnosis of the current situation of beef cattle production systems, featuring the agro-ecological and the socio-economic context where they belong to.
We evaluated 21 beef cattle modal production systems that performed only the cow-calf, in seven Brazilian states. Data were collected in the municipalities of the following states: Mato Grosso do Sul – MS (eight), Goi´as – GO (four), Rio Grande do Sul – RS (one), Minas Gerais – MG (four), Tocantins – TO (two), S˜ao Paulo – SP (one), Bahia – BA (one).
Panels were performed for collecting data, according to the methodology described by Centro de Estudos Avanc¸ados em Economia Aplicada (CEPEA, 2010). The primary data collection via the panel system allows the definition of representative properties, as described in Plaxico and Tweeten (1963). In the case of studies regarding rural production units, the same authors suggest the representative farm system as the ideal one. However, some definitions and assumptions should be adopted, the features must be constantly revisited and the production data often revised to reflect the technological advances.
The panel is an information retrieval procedure less costly than the census or the sample of farms. Another advantage is that it provides greater flexibility and versatility in the data updating, without compromising their quality.
The technique consists of a meeting with a group of one or more researchers, regional technicians and five to ten farmers (usually eight farmers, on average). Meetings are scheduled in advance by the rural unions and/or regional contacts. Themes and variables are previously determined in interviews with local technicians, and are then discussed with the farmers.
Despite the difficulty of characterizing a single property and a production system that is repre-sentative of the locality under study (here the city), the method seeks, through the experience of the participating famers, to characterize the property that is most commonly found in the re-gion (Carvalhoet al., 2008). In some areas, the impossibility of determining that typical farm imposes the choice of more than one property or production system as being the representatives. The implementation of the panel follows four main steps:
a) Step 1: Survey of production technical coefficients and regional information;
b) Step 2: Visit to the properties;
c) Step 3: Spreadsheets formatting;
The information obtained in Steps 1 and 2, referring to the operational processes that determine the production costs and the productivities, will be filled in the spreadsheets to facilitate Step 4.
The facilitators use a laptop computer and a device designed to project the sheets previously prepared (Step 3), so that all participants can interact, Different technical coefficients (quantity of inputs), price and frequency of use are presented to the group that discusses and refines the information. At the end of this debate, one can say that any characterization of the typical property in the region has the backing of the farmers. As a result, the productivity rates, costs of deployment, fixed and variable costs,i.e.all the figures resulting from the panel, tend to be quite close to the regional reality.
It is noteworthy that the rates and costs reported by each participant will not be related to their properties, but with a single farm, declared at the beginning of the panel as the one that best represents the size and the production systems of most of the local properties (Carvalho et al., 2009).
A preliminary analysis of the results of these panels, using multivariate techniques in order to classify the different modal systems, can be seen in Abreuet al. (2010). The authors identified six out of 18 variables as those that characterized the beef cattle modal production systems per-forming the cow-calf phase, namely, calving interval, offspring produced, age of cow at culling, multiparous cows birth rate, and cow replacement rate. These six variables were the basis for the study here presented.
3 DATA ENVELOPMENT ANALYSIS (DEA)
3.1 General aspects
DEA is an efficiency analysis approach based on mathematical programming models. Its goal is to calculate the efficiency of productive units, called decision making units or DMUs, knowing the level of resources used and the results obtained.
DEA optimizes each individual observation, in order to estimate a piecewise linear efficient frontier, composed of the units with the best practices in the evaluation sample (Pareto-Koopmans efficient units). These units are the reference or benchmarks for the inefficient ones.
The two most popular DEA models are the CCR (Charnes et al., 1978) and the BCC (Banker
et al., 1984). The CCR model assumes the hypothesis of constant returns to scale. The BCC model imposes variable returns to scale i.e. replaces the axiom of proportionality by the ax-iom of convexity. Traditionally there are two possible radial orientations to these models in the quest for efficiency frontier: input-oriented, when one seeks to minimize the resources remain-ing unchanged the production levels, and output-oriented, which implies increasremain-ing the products without changing the amounts of inputs used.
Model (1) represents the linear form of the input-oriented DEA CCR multipliers (a) and envelope (b) formulations. In (a),h0 is the efficiency of DMU 0 under consideration; xi k is the inputi,
the weight for inputi;uj is the weight assigned to output j;xi oandyj oare the inputsiand the outputs jof the DMU 0, respectively. In (b),h0is the efficiency of the DMU 0 under evaluation.
Note that the linear programming problems (a) and (b) are dual, and thus have the same objective function value,i.e. h0=θ0·λkis the contribution of DMU k in the calculation of the target of DMU 0 (the units with non-zeroλkare the benchmarks of the DMU 0).
The BCC, in its primal and dual formulations, can be obtained from the model (1), adding the convexity constraint to the envelope model –P
kλk =1 – and the scale factor to the multipliers model.
Max h0=
X
j
ujyj0 Min θ0
subject to subject to
X
i
vixi0=1 (a) h0xi0−
X
k
xi kλk ≥0, ∀i (b)
−X
i
vixi k+ X
j
ujyj k ≤0, ∀k −yj0+
X
k
yj kλk≥0, ∀j
u, v≥0 λk ≥0, ∀k
(1)
In order to model and to interpret correctly DEA results it’s necessary to know the properties of their models. Two of the most important are (Gomeset al., 2009b):
– In any DEA model, the DMU that presents the best (output j)
(input i) ratio will always be efficient. This property requires checking the existence of a causal relationship between each input and each output. Ignoring this relationship can lead to meaningless results (Gomeset al., 2009a, 2009c).
– The chief property of the CCR model, which in its fractional form is a homogeneous function of degree zero, is the proportionality between inputs and outputs at the frontier. This has the consequence that the increase (decrease) in the amount of inputs, causes a proportion increase (decrease) in to the value of the outputs.
3.2 Unitary input DEA model
The case study of this paper was based on a previous study, in which the variables were selected by means of multivariate methods to characterize beef cattle modal production systems. By analyzing these variables we noticed that they are secondary variables, in the sense that they are rates or combinations of primary variables. In this kind of situation, we do not have a classic production model – resources×products – to be modeled by DEA. These variables can be seen as the result of the productive system, which already include the possible resources (technology).
DEA model with outputs and a single unitary input. This model would be equivalent to an addi-tive multicriteria model, with the particularity that the alternaaddi-tives, here DMUs, assign weights to each criterion, here outputs, ignoring any decision-maker value judgment. That is, the DEA is used as a multicriteria tool, not as a classic efficiency measure technique.
Caporalettiet al. (1999) interpret this situation as a multiattribute model. This model is shown in (2).
Max h0=
X
j
ujyj0
subject to
X
j
ujyj k ≤1, ∀k
uj ≥0, ∀j
(2)
Soares de Mello et al. (2008a, 2008b, 2008c, 2009b) showed that this model resembles the input-oriented CCR model. However, the dual of model (2), presented in (3), does not allow the reduction of inputs interpretation, and is therefore immune to the common criticism that this model tries to reduce an input that is constant.
Min X
k
λk
subject to
X
k
yj kλk ≥yj0, ∀j
λk≥0, ∀k
(3)
Additionally, it can be shown that the variable returns to scale model does not make sense in this case. In fact, from model (3) it can be obtained model (4), by adding the convexity constraint. It is immediate to verify that the only feasible value for the objective function of this model is 1. Thus, its adoption would make all DMUs efficient, which is nonsense for evaluation purposes.
Min X
k
λk
subject to
X
k
yj kλk ≥yj0, ∀j
X
k
λk =1
λk≥0, ∀k
(4)
Applications of such models can be found in, for example, Thompsonet al.(1986); De Koeijer
al. (2008) and Soares de Melloet al. (2009a). A similar model, replacing the DEA constraints by the multicriteria constraint that the weights sum must equal one, can be found in Bana e Costa & Oliveira (2012); Lacerdaet al.(2011) and Gomeset al.(2008).
3.3 Inverted frontier
By allowing each DMU to choose its own set of weights, DEA becomes a benevolent evaluation technique. In its original formulations it’s allowed the assignment of zero weights to the mul-tipliers, as well as ties for the efficient DMUs. Because of this last feature it is impossible to obtain complete rankings of efficiency measures, and increasing discrimination in DEA has been studied in the literature. Angulo Meza & Lins (2002) and Adleret al.(2002) present a review of models for increased discrimination in DEA. Angulo Meza & Lins (2002) divide these models into two major groups: models that incorporate the decision-maker a priori information (weight restrictions, for example), and models that do not use this information in its calculation (super efficiency, cross-evaluation, among others).
The inverted frontier is an approach that fits within the second set of methods. It was originally proposed by Yamadaet al. (1994) and Entaniet al. (2002), and it considers inputs as outputs and vice versa. There are two interpretations for this situation: this frontier is composed by the DMUs with the worst management practices (pessimistic assessment), or the DMUs that are on the inverted frontier have best practices according to an opposite point of view. The second interpretation is used by Linset al.(2005) for real estate appraisals.
Angulo Mezaet al.(2005a) and Soares de Melloet al.(2008c) have used the first interpretation to propose an alternative approach to discriminate efficient DMUs. These authors developed an index that combines the two efficiencies (concerning to the original and to the inverted frontiers), called the composite index. According to Soares de Melloet al. (2008c), a DMU is considered really the best if it not only has good performance in the variables on which it is better (classic frontier), it also should not have a bad performance on the criterion that it is worse (inverted frontier). This composite index is calculated by the arithmetic average between the efficiency in relation to the original frontier and the inefficiency (1 – efficient) regarding the inverted frontier. Some alternatives for calculating the composite index can be seen in Pimenta and Soares de Mello (2005) and Souzaet al.(2007). This technique has been applied in many situations where it is necessary to increase discrimination. Examples can be found in education (Milioniet al., 2011) and air transport problems (Limaet al., 2011), for instance.
4 MODELLING
In order to structure any DEA model it is necessary to define the units to be evaluated (DMUs), the variables to be the modeled (inputs and outputs) and the specific DEA hypotheses (CCR, BCC, among others; input-oriented, output-oriented etc.).
cattle production systems in Brazil (Gomes, 2008). Abreuet al. (2006) analyzed the efficiency of a cattle production system in the Pantanal of Corumb´a, where technologies have been imple-mented over eight years (1995-2002). They took into account information on ten inputs spending categories and one output category. The authors used principle components multivariate analysis with the aim of reducing the number of input variables. The methodology identified the sources of inefficiencies in terms of unnecessary supplies expenditures, a fundamental aspect for the pro-ducer when making decisions. Additionally, the analysis enabled the evaluation of efficient years in relation to the inefficient ones, so that the efficient years were benchmarked for adopting new practices, improving livestock management and balancing the inputs spendings.
With the same economic data recorded during the above mentioned period, Abreuet al. (2008) evaluated two approaches for choosing variables for the DEA analysis: the first was a variant of the multicriteria variable selection method, which combines the conflicting goals of decision units better ordering and higher average efficiency, and the second includes multivariate statistics techniques. In both models (with six inputs and one output, and three inputs and one output, respectively) the efficiency results were analyzed over the classical and inverted DEA frontiers, beyond the composite index that combines both results. The best model, as assessed by linear trend analysis, was obtained with the proposed variant of the multicriteria variable selection method, whose composite index resulted in significant estimates of the regression (0.046) and determination (0.700) coefficients.
Gomes et al. (2011) evaluated the economic and the socio-environmental performance of 21 beef cattle modal production systems that perform only the raising phase, the same DMUs that are considered in this paper. The authors implemented two DEA BCC models following two different approaches. The economic model measured the ability of a production system to gen-erate revenue with the preservation of native forest, using labor, capital and current spending. In the socio-environmental approach, the production factor “labor” was modeled as an output, and the interest was to assess whether the capital costs generate economic, environmental and social benefits. Weights restrictions were imposed on the output variables of each model to explain the proposed approaches and to avoid inconsistent results. The results pointed out sources of inefficiency in terms of labor with low qualification, and use of questionable quality bulls, which are common in extensive systems. The authors state that these are some of the major bottlenecks in animal production systems as a whole.
4.1 DMUs
4.2 Variables
The variable selection in DEA is a step of great importance, as it determines the quality of the results. A model with many variables can lead to an extremely benevolent assessment, with several 100% efficient DMUs. In the case of cow-calf modal systems performance evaluation the variables were chosen based on the preliminary study of Abreuet al.(2010). These variables include biological and productive indices.
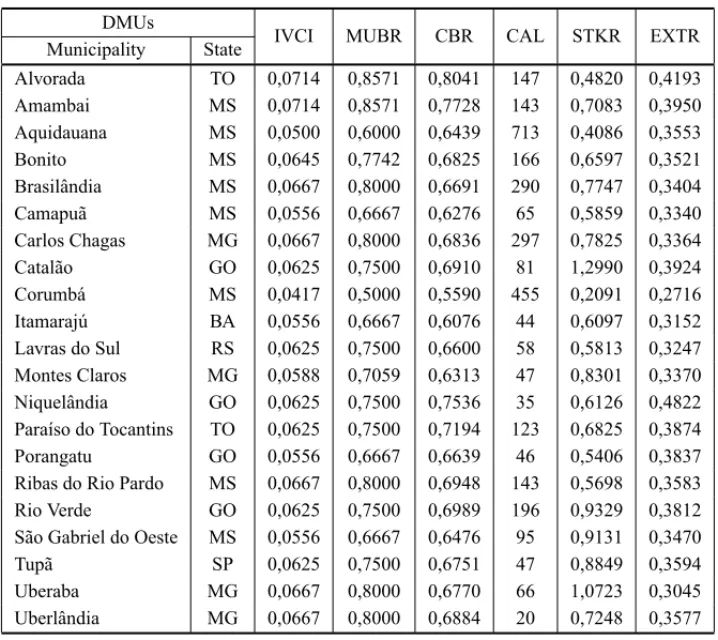
These variables are performance criteria, mostly calculated as rates or secondary variables. These are the outputs of the DEA model, which has a single and unitary input. The following variables were selected as outputs. Their values are summarized in Table 1.
Husbandry variables:
– Inverse of calving interval (IVCI): the interval between births corresponds to the time inter-val between two subsequent parturitions. The reverse was used in order to follow the same pattern of other variables: the higher the order of magnitude, the better the performance;
– Multiparous birth rate (MUBR): number of calves born during the annual cycle of birth, in relation to the number of multiparous cows in the breeding herd;
– Cow Birth rate (CBR): number of calves born during the annual cycle of birth in relation to the number of cows in the breeding herd.
Production variables:
– Number of calves (CAL): weaned calves in the herd during the annual cycle;
– Stocking rate (STKR): represents the number of animal units (beef cow with 450 kg of life weight) retained in the farm per unit of area during the year;
– Extraction rate (EXTR): represents the production of the cow herd that is traded over the annual livestock cycle.
It should be noted that since we used the Caporalettiet al. (1999) instead of the original DEA CCR, there are no restrictions on the use of indices and ratios as variables.
4.3 Model
In this paper we used a unitary input DEA model, based on the approach proposed by Caporaletti
Table 1– Variables.
DMUs
IVCI MUBR CBR CAL STKR EXTR
Municipality State
Alvorada TO 0,0714 0,8571 0,8041 147 0,4820 0,4193
Amambai MS 0,0714 0,8571 0,7728 143 0,7083 0,3950
Aquidauana MS 0,0500 0,6000 0,6439 713 0,4086 0,3553
Bonito MS 0,0645 0,7742 0,6825 166 0,6597 0,3521
Brasilˆandia MS 0,0667 0,8000 0,6691 290 0,7747 0,3404
Camapu˜a MS 0,0556 0,6667 0,6276 65 0,5859 0,3340
Carlos Chagas MG 0,0667 0,8000 0,6836 297 0,7825 0,3364
Catal˜ao GO 0,0625 0,7500 0,6910 81 1,2990 0,3924
Corumb´a MS 0,0417 0,5000 0,5590 455 0,2091 0,2716
Itamaraj´u BA 0,0556 0,6667 0,6076 44 0,6097 0,3152
Lavras do Sul RS 0,0625 0,7500 0,6600 58 0,5813 0,3247
Montes Claros MG 0,0588 0,7059 0,6313 47 0,8301 0,3370
Niquelˆandia GO 0,0625 0,7500 0,7536 35 0,6126 0,4822
Para´ıso do Tocantins TO 0,0625 0,7500 0,7194 123 0,6825 0,3874
Porangatu GO 0,0556 0,6667 0,6639 46 0,5406 0,3837
Ribas do Rio Pardo MS 0,0667 0,8000 0,6948 143 0,5698 0,3583
Rio Verde GO 0,0625 0,7500 0,6989 196 0,9329 0,3812
S˜ao Gabriel do Oeste MS 0,0556 0,6667 0,6476 95 0,9131 0,3470
Tup˜a SP 0,0625 0,7500 0,6751 47 0,8849 0,3594
Uberaba MG 0,0667 0,8000 0,6770 66 1,0723 0,3045
Uberlˆandia MG 0,0667 0,8000 0,6884 20 0,7248 0,3577
IVCI – inverse of calving interval, MUBR – multiparous cows birth rate, CBR – cows birth rate, CAL
– offspring produced, STKR – stocking rate, EXTR – extraction rate.
The use of the inverted frontier, instead of other techniques to increase discrimination, is justified by the following issues:
(a) It is an increasing discrimination method that does not need the decision-makers value judgments, which reduces the subjectivity;
(b) Among the existing methods, it is the easiest one. The Cross-Evaluation (Doyle & Green, 1994) and MCDEA-TRIMAP (Soares de Melloet al., 2009b; Climacoet al., 2010) require more calculations and advanced concepts. In addition to being more cumbersome, they are not easily interpreted by readers without strong DEA background.
5 RESULTS
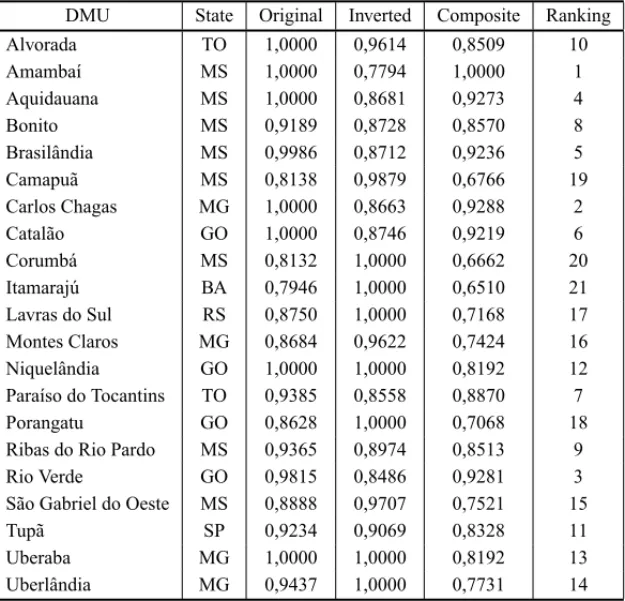
Table 2 shows the efficiency measurements in relation to the original and to the inverted DEA frontiers, beyond the composite index. The composite index is normalized by its maximum value, in order to obtain measures that range from 0 to 1. The column “Ranking” is based on the results of the normalized composite index (column “Composite”). Table 2 was obtained using the SIAD software (Angulo Mezaet al., 2005a, 2005b).
Table 2– Efficiency measurements and composite index.
DMU State Original Inverted Composite Ranking
Alvorada TO 1,0000 0,9614 0,8509 10
Amamba´ı MS 1,0000 0,7794 1,0000 1
Aquidauana MS 1,0000 0,8681 0,9273 4
Bonito MS 0,9189 0,8728 0,8570 8
Brasilˆandia MS 0,9986 0,8712 0,9236 5
Camapu˜a MS 0,8138 0,9879 0,6766 19
Carlos Chagas MG 1,0000 0,8663 0,9288 2
Catal˜ao GO 1,0000 0,8746 0,9219 6
Corumb´a MS 0,8132 1,0000 0,6662 20
Itamaraj´u BA 0,7946 1,0000 0,6510 21
Lavras do Sul RS 0,8750 1,0000 0,7168 17
Montes Claros MG 0,8684 0,9622 0,7424 16
Niquelˆandia GO 1,0000 1,0000 0,8192 12
Para´ıso do Tocantins TO 0,9385 0,8558 0,8870 7
Porangatu GO 0,8628 1,0000 0,7068 18
Ribas do Rio Pardo MS 0,9365 0,8974 0,8513 9
Rio Verde GO 0,9815 0,8486 0,9281 3
S˜ao Gabriel do Oeste MS 0,8888 0,9707 0,7521 15
Tup˜a SP 0,9234 0,9069 0,8328 11
Uberaba MG 1,0000 1,0000 0,8192 13
Uberlˆandia MG 0,9437 1,0000 0,7731 14
From the 21 beef cattle modal production systems evaluated, which performed only the cow-calf stage, seven were DEA efficient: Alvorada, Amamba´ı, Aquidauana, Catal˜ao, Carlos Chagas, Niquelˆandia, and Uberaba. The DMUs Alvorada and Amamba´ı have the highest values of IVCI and MUBR. Alvorada also has the largest value of CBR. The highest values of the outputs CAL, STKR and EXTR are presented respectively by Aquidauana, Catal˜ao and Niquelˆandia.
Uberaba and Niquelˆandia were efficient from the opposite point of view. Along with Corumb´a, Itamaraj´u, Lavras do Sul, Porangatu and Uberlˆandia, these DMUs comprise the inverted frontier,
i.e. these DMUs are the ones with the worst performances. Corumb´a has the lowest values for all outputs, except the lowest number of calves, which belongs to Uberlˆandia.
production indices. Taken individually, the modal system of this municipality did not provide any index better than other modal system. On the other hand, the modal system of the municipality of Itamaraj´u had the worst performance, according to the same criteria, although it was not the worst performer in the various indices discussed. The result is consistent with that observed by Abreuet al.(2006).
Abreuet al.(2010) identified four groups of beef cattle production systems, based on three hus-bandry and three production variables. The authors employed multivariate analysis and clusters methods to that end, as described by Zambrano and Lima (2004). They noticed that two la-tent factors: “reproductive efficiency factor” and “shelf-life of beef cattle management factor”. Through multivariate and canonical discriminant analysis, and considering 21 beef cattle systems that performed only the cow-calf phase and 11 that performed the complete cycle, Abreuet al.
(2011) found strongly discriminated groups. This analysis reflected the different technological levels of the cow-calf and of the complete cycle production systems in the country, from the most extensive in the Pantanal region to the more intensive ones.
In the DEA literature there are some proposals to group DMUs based on efficiency measures. One of these approaches is based on the isoefficiency layers, and is known as Tiered DEA model. The layers obtained by this model have been used as a ranking tool (Barret al., 2000), which in multicriteria context is known as aPα, as defined by Roy and Bouyssou (1993). This model was also used to cluster DMUs, where each layer represents a group (Soares de Melloet al.2005) or performance level (Bougnol and Dul´a, 2006). Gomeset al.(2009c) used this approach to group farmers according to categories of sustainability. This proposal is similar to Pβ multicriteria problem, as defined by Roy & Bouyssou (1993).
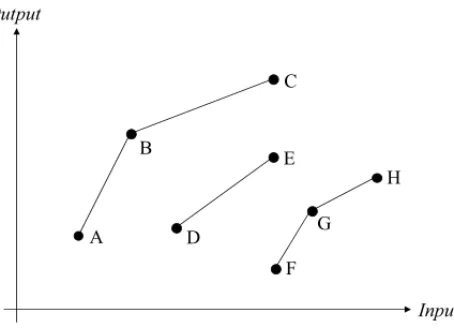
Isoefficiency layers are obtained as follows: the 100% efficient DMUs comprise the first layer. These DMUs are removed from the sample and a new DEA model is run. The efficient DMUs in this subset belong to the second layer. This procedure is repeated until there are no DMUs to withdraw. Figure 1 illustrates the procedure for the bi-dimensional case. DMUs A, B and C belong to the original DEA frontier and compose the 1st layer. The 2nd and 3rd layers are
composed, respectively, by the units D and E, and F, G and H.
A B
C
D
E
F G
H
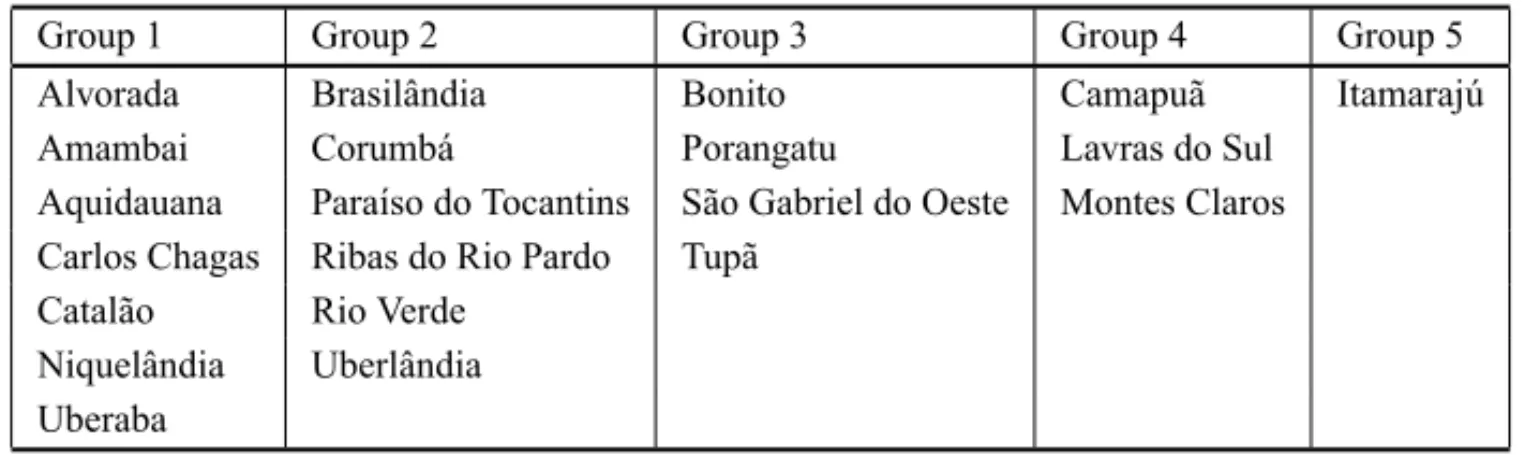
Table 3 summarizes the results of the use of the isoefficiency layers approach to group the cow-calf modal production systems, according to the efficiency measurements calculated by the uni-tary input DEA model. We found five clusters. It should be noted that, for these layers, we used only the results on the efficient frontier and ignored the results of the inverted frontier.
The systems belonging to Group 1 are characterized by shorter calving intervals and higher birth rates, both for cows as for multiparous, with a high number of calves produced within each scale of production. These systems were the best performers in relation to husbandry and production aspects. All systems belonging to this group had the best performance value in, at least, one indicator. The mean values for IVCI, MUBR, CBR, CAL, STKR and EXTR were, respectively, 15.7 months, 77%, 72%, 212 calves, 0.76 animal unit per hectare and 38%. These mean values are higher than those of the other groups.
Table 3– Cow-calf modal production systems clusters, according to the isoefficiency layers.
Group 1 Group 2 Group 3 Group 4 Group 5
Alvorada Brasilˆandia Bonito Camapu˜a Itamaraj´u
Amambai Corumb´a Porangatu Lavras do Sul
Aquidauana Para´ıso do Tocantins S˜ao Gabriel do Oeste Montes Claros Carlos Chagas Ribas do Rio Pardo Tup˜a
Catal˜ao Rio Verde Niquelˆandia Uberlˆandia Uberaba
Group 2 modal systems have large scale of production, but negative correlation with other bio-logical and productive indices. These systems are probably grounded in large extensive cow-calf herds with large number of cows and calves. The average of the calves produced in this group was similar to Group 1 (204 calves), but other indicators were lower.
On the other hand, the modal systems of Group 3 have as main feature the stocking rate to be negatively correlated(−0.74)with the extraction rate, which indicates systems in which the number of animals in the breeding herd tends to be excessive. These systems would need to adjust the stocking rate to achieve best performance indices. The average stocking rate was estimated at 0.75 animal unit per hectare, similar to that observed in Group 1, but with the lower zootechnical and productive performances.
Group 4 production systems show negative correlation between the extraction rate and the pro-duction indices IVCI(−0.75), MUBR(−0.75)and CBR(−0.94), but positive(0.70)between extraction rate and stocking rate. These systems likely have losses in animal production, because the efficient cow-calf production systems extraction rate should increase proportionally with the zootechnical indices best performance. The group, on average, has the lowest number of calves produced regarding the other groups.
6 CONCLUDING REMARKS
In this paper we evaluated comparatively extensive livestock modal production systems that performed only the cow-calf stage. We measured the performance of these systems in 21 mu-nicipalities in Brazil, considering husbandry and production indicators. The unitary input DEA model with apparent input orientation, together with the efficiency measures generated by the inverted DEA frontier, allowed ranking these systems based on their performance. In accordance with the characteristics of this type of model, it can be said that this is a multicriteria approach to DEA.
The unitary input DEA model was also used to group the DMUs through isoefficiency layers. This approach enabled clustering the modal production systems, according to the efficiency mea-sures. Each cluster can be understood as a cow-calf model production system typology. The results indicate that knowledge and processes management, managed together in a systemic way, are the most important factors for improving efficiency in beef cattle production systems.
Modal systems in Group 1 were characterized by outperforming others, both in husbandry (IVCI, MUBR and CBR), and in production variables (CAL, STKR and EXTR). Groups 2 and 3 had, respectively, CAL and STKR similar to that observed in Group 1, but with lower performance in other indicators. This probably occurred due to the Group 2 systems that are very extensive, with emphasis on the scale of production without balancing with other indices improvement. Modal systems of Group 3 showed high stocking rate in relation to the number of animals, which probably hampered the zootechnical performance and, consequently, the productive one. Group 4 systems had weak performances and negative correlations between husbandry variables and EXTR. This indicates the need of a general analysis of the managerial aspects, as the expected result is that the improvement of production indices should provide more efficiency and thus higher EXTR (positive correlation between variables). For systems of Group 4 it was the reverse. Probably the husbandry indices were not reflected directly in increasing the number of calves, which may result from loss of animals through the production process, signaling the need for more efficient management. The Itamaraj ´u modal system (Group 5) showed lower performance in most of the variables considered.
The beef cattle production systems in Brazil are developed in almost all municipalities, which reflect the big range of production systems. Local conditions of natural resources, social and eco-nomic profile of the farmer, land ownership and land use, besides the ecoeco-nomic conditions, are causes of differences in the systems. In regional terms, natural resources play a fundamental role in the classification of livestock systems. The use of DEA provided the proposal of typologies, which are important for public policies suggestions that may contribute to develop this economic activity. Future studies will include the socio-environmental analysis that will provide support to quantify sustainability, based on economic, social and environmental variables inherent to the activity.
ACKNOWLEDGMENTS
REFERENCES
[1] ABREUUGP, CARVALHOTB & MORAESAS. 2008.An´alise do Prec¸o do Bezerro Pago no Pantanal da Nhecolˆandia, no per´ıodo de 2001 a 2008.Comunicado T´ecnico, 70. Embrapa Pantanal, Corumb´a.
[2] ABREUUGP, CARVALHOTB & ZENS. 2010. Caracterizac¸˜ao produtiva dos sistemas de cria de gado de corte no Brasil.Anais da 47aReuni˜ao Anual da Sociedade Brasileira de Zootecnia, Salvador.
[3] ABREUUGP, CARVALHOTB & ZENS. 2011. Tipologia de sistemas de produc¸˜ao em pecu´aria de corte no Brasil.Anais da 48aReuni˜ao Anual da Sociedade Brasileira de Zootecnia, Bel´em.
[4] ABREUUGP, GOMESEG, LOPESPS, TORRESRA & SANTOSHN. 2008. Avaliac¸˜ao sistˆemica da introduc¸˜ao de tecnologias na pecu´aria de gado de corte do Pantanal por meio de modelos de an´alise envolt´oria de dados (DEA).Revista Brasileira de Zootecnia,37(11): 2069–2076.
[5] ABREUUGP, LOPES PS, BAPTISTA AJMS, TORRES RA & SANTOS HN. 2006. Avaliac¸˜ao da introduc¸˜ao de tecnologias no sistema de produc¸˜ao de gado de corte no Pantanal. An´alise de eficiˆencia.
Revista Brasileira de Zootecnia,35(3): 1242–1250.
[6] ADLERN, FRIEDMANL & SINUANY-STERNZ. 2002. Review of ranking methods in the data en-velopment analysis context.European Journal of Operational Research,140(2): 249–265.
[7] ANGULOMEZAL & LINSMPE. 2002. Review of methods for increasing discrimination in data envelopment analysis.Annals of Operations Research,116(1-4): 225–242.
[8] ANGULO-MEZAL, BIONDINETOL, SOARES DEMELLOJCCB & GOMESEG. 2005a. ISYDS – Integrated System for Decision Support (SIAD Sistema Integrado de Apoio `a Decis˜ao): A Software Package for Data Envelopment Analysis Model.Pesquisa Operacional,25(3): 493–503.
[9] ANGULOMEZALA, BONDINETOL, SOARES DEMELLOJCCB, GOMESEG & COELHOPHG. 2005b. Free software for Decision Analysis a software package for Data Envelopment models.
Proceedings of the 7thInternational Conference on Enterprise Information Systems, pp. 207–212, Miami.
[10] ARRUDAZJDE& SUGAIY. 1994.Regionalizac¸˜ao da pecu´aria bovina no Brasil. Empresa Brasileira de Pesquisa Agropecu´aria.Relat´orio T´ecnico. Centro de Pesquisa Nacional de Gado de Corte – Campo Grande: Embrapa – CNPGC, 144 p.
[11] BANA ECOSTACA & OLIVEIRA MD. 2012. A multicriteria decision analysis model for faculty evaluation.Omega,40(4): 424–436.
[12] BANKERRD, CHARNES A & COOPER WW. 1984. Some models for estimating technical scale inefficiencies in data envelopment analysis.Management Science,30(9): 1078–109.
[13] BARBA-ROMEROS & POMEROLJC. 1997.Decisiones Multicriterio: Fundamentos Te ´oricos y Uti-lizaci´on Pr´actica.Universidad de Alcal´a.
[14] BARR RS, DURCHHOLZML & SEIFORD L. 2000.Peeling the DEA onion: Layering and rank-ordering DMUs using tiered DEA.Technical Report, Southern Methodist University.
[15] BOUGNOLM-L & DULA´ JH. 2006. Validating DEA as a ranking tool: an application of DEA to assess performance in higher education.Annals of Operations Research,145(1): 339–365.
[17] CAPORALETTI LE, DULA´ JH & WOMERNK. 1999. Performance evaluation based on multiple attributes with nonparametric frontiers.Omega,27(6): 637–645.
[18] CARDOSOEG. 1994.A cadeia produtiva da pecu ´aria bovina de corte.Documentos, 49. Embrapa Gado de Corte, Campo Grande.
[19] CARVALHOTB, ZENS & FERREIRAPC. 2008. Caracterizac¸˜ao da atividade pecu´aria de engorda nos principais pa´ıses produtores de carne bovina.Anais da 46aReuni˜ao da Sociedade Brasileira de
Economia, Administrac¸˜ao e Sociologia Rural, Rio Branco.
[20] CARVALHOTB, ZENS & TAVARESECN. 2009. Comparac¸˜ao de custo de produc¸˜ao na atividade de pecu´aria de engorda nos principais pa´ıses produtores de carne bovina.Anais da 47aReuni˜ao da Sociedade Brasileira de Economia, Administrac¸ ˜ao e Sociologia Rural, Porto Alegre.
[21] CASTALDOA, ACERO R, PEREA J, MARTOSJ, VALERIOD & GARCIAA. 2006. Tipologia de los sistemas de producci ´on de engorde bovino em La pampa Argentinas.Archivos de Zootecnia,55: 183–193.
[22] CEPEA – CENTRO DE ESTUDOS AVANC¸ADOS EM ECONOMIA APLICADA. 2010. Metodolo-gia do ´ındice de prec¸os dos insumos utilizados na produc¸ ˜ao pecu´aria brasileira.Dispon´ıvel em: <http://www.cepea.esalq.usp.br/boi/metodologiacna.pdf>. Acesso em: 24 marc¸o 2010.
[23] CHARNESA, COOPERWW & RHODESE. 1978. Measuring the efficiency of decision-making units.
European Journal of Operational Research,2(6): 429–444.
[24] CL´IMACO JCN, SOARES DE MELLO JCCB & ANGULO MEZA L. 2010. A study of highways performance with a MOLP-DEA model and an interactive tri-criteria linear programming package (TRIMAP).Brazilian Journal of Operations and Production Management,7(1): 163–179.
[25] COOKWD. 2004. Qualitative data in DEA. In:Handbook on Data Envelopment Analysis[edited by COOPERWC, SEIFORDLM & ZHUJ], Kluwer, 153–175.
[26] DE KOEIJER TJ, WOSSINK GAA, STRUIK PC & RENKEMA JA. 2002. Measuring agricultural sustainability in terms of efficiency: the case of Dutch sugar beet growers.Journal of Environmental Management,66(1): 9–17.
[27] DOYLE J & GREENR. 1994. Efficiency and cross-efficiency in DEA: Derivations, meanings and uses.Journal of the Operational Research Society,45(5): 567–578.
[28] ENTANI T, MAEDA Y & TANAKA H. 2002. Dual Models of Interval DEA and its extensions to interval data.European Journal of Operational Research,136(1): 32–45.
[29] EUCLIDESFILHOK. 2000.Produc¸˜ao de bovinos de corte e o trin ˆomio gen´otipo-ambiente-mercado.
Documentos, 85. Embrapa Gado de Corte, Campo Grande.
[30] GASPAR P, MES´IASFJ, ESCRIBANOM & PULIDOF. 2009. Assessing the technical efficiency of extensive livestock farming systems in Extremadura, Spain.Livestock Science,121(1): 7–14.
[31] GOMESEG, SOARES DEMELLOJCCB, ABREUUGPDE, CARVALHOTBDE& ZENSDE. 2011. Avaliac¸˜ao dos desempenhos econˆomico e socioambiental de sistemas modais de pecu´aria de cria com modelos DEA com restric¸ ˜oes aos pesos.Anais do XLIII Congresso da Sociedade Brasileira de Pesquisa Operacional, Ubatuba.
[33] GOMESEG, GREGOCR, SOARES DEMELLOJCCB, VALLADARESGS, MANGABEIRAJAC & MIRANDAEE. 2009a. Dependˆencia espacial da eficiˆencia do uso da terra em assentamento rural na Amazˆonia.Produc¸˜ao,19(2): 417–432.
[34] GOMESEG, MANGABEIRAJADEC & SOARES DEMELLOJCCB. 2005. An´alise de envolt´oria de dados para avaliac¸˜ao de eficiˆencia e caracterizac¸˜ao de tipologias em agricultura: um estudo de caso.
Revista de Economia e Sociologia Rural,43(4): 607–631.
[35] GOMESEG, SOARES DEMELLOJCCB & MANGABEIRAJAC. 2009b. Estudo da sustentabilidade agr´ıcola em um munic´ıpio amazˆonico com an´alise envolt´oria de dados.Pesquisa Operacional,29(1): 23–42.
[36] GOMESEG, SOARES DEMELLOJCCB & MANGABEIRAJAC. 2008. ´Indice multicrit´erio de bem estar social rural em um munic´ıpio da regi˜ao amazˆonica.Pesquisa Operacional,28(1): 141–160.
[37] GOMESEG, SOARES DEMELLOJCCB, SOUZAGS, ANGULOMEZAL & MANGABEIRAJAC. 2009c. Efficiency and sustainability assessment for a group of farmers in the Brazilian Amazon.
Annals of Operations Research,169(1): 167–181.
[38] GOMESEG, SOUZAGS & VIVALDILJ. 2008. Two-stage inference in experimental design using DEA: an application to intercropping and evidence from randomization theory.Pesquisa Operacional, 28(2): 339–354.
[39] HALBERGNA, VANDERWERFHMG, BASSET-MENSC, DALGAARDR & DEBOERIJM. 2005. Environmental assessment tools for the evaluation and improvement of European livestock production systems.Livestock Production Systems,96(1): 33–50.
[40] LACERDAFG, CHAVESMCC, GOMESJ ´UNIORSF, SOARES DEMELLOJCCB & PEREIRAER. 2011. Avaliac¸˜ao do desempenho dos pa´ıses nos jogos Pan-Americanos e verificac¸˜ao da ocorrˆencia de Home Advantage.Pesquisa Operacional,31(2): 391–403.
[41] LAOUBIK & YAMAOM. 2009. A typology of irrigated farms as a tool for sustainable agricultural de-velopment in irrigation schemes: The case of the East Mitidja scheme, Algeria.International Journal of Social Economics,36(8): 813–831.
[42] LIMAVS, SOARES DEMELLOJCCB & ANGULOMEZAL. 2011. Cost-benefit analysis in selected air trips using a non parametric method.African Journal of Business Management,5(21): 9678–9685.
[43] LINSMPE, NOVAESLFL & LEGEYLFL. 2005. Real estate value assessment: a double perspective data envelopment analysis.Annals of Operations Research,138(1): 79–96.
[44] LOVELLCAK & PASTORJT. 1999. Radial DEA models without inputs or without outputs.European Journal of Operational Research,118(1): 46–51.
[45] MCDEERMOTT JJ, STAALSJ, FREEMANHA, HERRERO M & VAN DE STEEG JA. 2010. Sus-taining intensification of smallholder livestock systems in the tropics.Livestock Science,130(1-3): 95–109.
[46] MILIONI AZ, FERRARIDB & SCARPELRA. 2011. Uma an´alise dos resultados do IGC usando DEA.Anais do XLIII Simp´osio Brasileiro de Pesquisa Operacional, 2011, Ubatuba.
[48] PLAXICOJS & TWEETENLG. 1963. Representative farms for policy and projection research. Jour-nal of Farm Economics,45(5): 1458–1465.
[49] ROYB & BOUYSSOUD. 1993.Aide multicrit`ere `a la d´ecision: m´ethods et cas.Ed. Economica, Paris.
[50] SEVEROCM & MIGUELPA. 2006. A sustentabilidade dos sistemas de produc¸˜ao de bovinocultura de corte do Estado do Rio Grande do Sul.Redes,11(3): 213–234.
[51] SOARES DEMELLOJCCB & GOMESEG. 2004. Eficiˆencias aeroportu´arias: uma abordagem com-parativa com an´alise de envolt´oria de dados.Revista de Economia e Administrac¸ ˜ao,3(1): 15–23.
[52] SOARES DEMELLOJCCB, ANGULOMEZAL & BRANCO DASILVABP. 2008a. Some rankings for the Athens Olympic Games using DEA models with a constant input.Investigac¸˜ao Operacional, 8(1): 77–89.
[53] SOARES DEMELLOJCCB, ANGULOMEZAL & BRANCO DASILVABP. 2009a. A ranking for the Olympic Games with unitary input DEA models.IMA Journal of Management Mathematics,20(2): 201–211.
[54] SOARES DEMELLOJCCB, CL´IMACOJCN & ANGULOMEZAL. 2009b. Efficiency evaluation of a small number of DMUs: an approach based on Li and Reeves’ model.Pesquisa Operacional,29(1): 97–110.
[55] SOARES DE MELLO JCCB, GOMESEG, ANGULOMEZA L & BIONDI NETO L. 2008b. Cross evaluation using weight restrictions in unitary input DEA models: theoretical aspects and application to Olympic Games ranking.WSEAS Transactions on Systems,7(1): 31–39.
[56] SOARES DEMELLOJCCB, GOMESEG, ANGULOMEZAL & LETAFR. 2008c. DEA Advanced Models for Geometric Evaluation of used Lathes.WSEAS Transactions on Systems,7(5): 500–520.
[57] SOARES DE MELLO JCCB, GOMES EG, GOMESLFAM, BIONDINETOL & ANGULO MEZA L. 2005. Avaliac¸˜ao do tamanho de aeroportos portugueses com relac¸ ˜oes multicrit´erio de superac¸˜ao.
Pesquisa Operacional,25(3): 313–330.
[58] SOUZAGS, GOMESEG, MAGALHAES˜ MC & AVILAAFD. 2007. Economic efficiency of Embrapa research centers and the influence of contextual variables.Pesquisa Operacional,27(1): 15–26.
[59] SOUZAWFS & SOUZAGS. 2007. Infra-estrutura portu´aria nacional de apoio ao com´ercio exterior: hierarquizac¸˜ao das unidades portu´arias.Engevista,9(1): 4–13.
[60] TEIXEIRAJRF & SILVAMADA. 2007. Tipologia de sistemas de produc¸˜ao bovina com ˆenfase na ocorrˆencia de ectoparasitoses.Revista Brasileira de Zootecnia,36(6): 2176–2183.
[61] THOMPSONRG, SINGLETONJRFD, THRALLRM & SMITHBA. 1986. Comparative evaluation for locating a high-energy physics lab in Texas.Interfaces,16(6): 35–49.
[62] YAMADAY, MATUIT & SUGIYAMAM. 1994. New analysis of efficiency based on DEA.Journal of the Operations Research Society of Japan,37(2): 158–167.
[63] ZAMBRANOC & LIMAJE. 2004. An´alise estat´ıstica multivariada de dados socioecon ˆomicos. In: