http://dx.doi.org/10.1590/0104-530X1531-14
Resumo: Este artigo apresenta os resultados de um estudo cujo objetivo foi o de avaliar os efeitos da abordagem analítica e da gestão orientada para processos sobre o desempenho organizacional de pequenas e médias empresas brasileiras, bem como a importância do porte (tamanho da irma) como variável moderadora de tais efeitos. No trabalho de campo, foi realizado um survey com 469 empresas participantes de diferentes segmentos da economia industrial e de serviços do Brasil. O tratamento dos dados incluiu testes descritivos, de coniabilidade de escalas e a modelagem de equações estruturais. Uma parcela importante da variação do desempenho das empresas estudadas (47,50%) foi explicada pelos regressores do modelo estrutural. Os achados da pesquisa também evidenciaram diferenças estatisticamente signiicativas quando confrontados os resultados das médias e pequenas empresas da amostra, sugerindo que o porte pode ser um elemento mediador das relações investigadas, ampliando o potencial de futuras pesquisas sobre o tema.
Palavras-chave: Abordagem analítica; Gestão orientada para processos; Desempenho organizacional; Porte da irma; Modelagem de equações estruturais.
Abstract: The paper compiles the results of a study which addressed the effects of business process orientation and business analytics on the performance of small and medium companies in Brazil, as well as the importance of size as a moderator of these effects. A survey was conducted with 469 companies from various segments of Brazil’s industrial and services economies. Data analysis included descriptive analysis, reliability tests, and structural equation modeling. A signiicant portion of the companies’ performance variation (47.5%) was explained by the regressors of the structural model, and the indings also indicate signiicant statistical disparities between medium and small companies, suggesting size might be a moderator in the investigated relationships, reinforcing the potential for future research on the theme.
Keywords: Analytical approach; Business process orientation; Organizational performance; Company size; Structural equation modeling.
The effects of analytical and business process
orientation approaches the on performance of
small and medium industrial and service
enterprises in Brazil
Os efeitos da abordagem analítica e da gestão orientada para processos sobre o desempenho organizacional de micro e
pequenas empresas brasileiras dos setores da indústria e de serviços
Marcelo Bronzo Ladeira1 Paulo Tarso Vilela de Resende2 Marcos Paulo Valadares de Oliveira3
Kevin McCormack4 Paulo Renato de Sousa2 Reinaldo Lopes Ferreira2
1 Departamento de Ciências Administrativas, Centro de Pós-graduação e Pesquisas em Administração – CEPEAD, Universidade
Federal de Minas Gerais – UFMG, Av. Antônio Carlos, 6627, Campus Universitário, CEP 31270-901, Belo Horizonte, MG, Brazil, e-mail: [email protected]
2 Fundação Dom Cabral, Av. Princesa Diana, 760, Alphaville/Lagoa dos Ingleses, CEP 34000-000, Nova Lima, MG, Brazil,
e-mail: [email protected]; [email protected]; [email protected]
3 Programa de Pós-graduação em Administração, Centro de Ciências Jurídicas e Econômicas, Universidade Federal do Espírito Santo
– UFES, Rua Ludwik Macal, 809/501, Jardim da Penha, CEP 29060-030, Vitória, ES, Brazil, e-mail: [email protected]
4 DRK Research, Willow Bridge Lane, 5425, NC 27526-8484, Raleigh, United States of America, e-mail: [email protected]
Received June 15, 2014 - Accepted Aug. 10, 2014
1 Introduction
The Business Process Management (BPM) and
the analytical approach procedures are effective initiatives in promoting the performance of
organizations and supply chains (Hammer, 2007a; Reijers, 2006; Davenport, 2006; Lambert et al., 2005; Croxton et al., 2001), set in two important areas of scientiic knowledge and best practice of
contemporary business management.
BPM consists of a set of theories, concepts, practices and technological artifacts which, in different ways, support the goal of managing business processes and effectiveness in the implementation
of corporate strategies (Skrinjar & Trkman, 2013; Trkman, 2010; Trkman et al., 2010; ABPMP, 2009).
There are various interaction points between the
BPM (Business Process Management) approach
and the guidance regarding business processes,
the BPO (Business Process Orientation). BPO is multi-dimensional, a unique and complex ield
comprised of various heuristics that reinforce and promote the logic of customer centrality. Commonly, BPO is associated with the design of organizational structures characterized by more effective business processes through commitment to permanent analytic efforts that promote incremental improvements and
optimization of business processes (Kohlbacher & Gruenwald, 2011; Smith & Fingar, 2003).
Along with BPO, analytical capabilities are also enablers to leverage effective performance results. Analytical capabilities can be considered as powerful weapons at the service of business strategy, especially
involving extensive use of critical data, explanatory
and predictive models, and management based on
facts used to guide decision-making. Despite studies
that indicate clear associations between BPO and
organizational performance (Sidorova & Isik, 2010; Hammer, 2007a, b; Mansar & Reijers, 2007; Grover & Malhotra, 1997), there is lack of research that
addresses the problem of quantifying the jointly effects of both BPO and analytical capabilities
over organizational performance (Trkman, 2010).
This study aims to cover those gaps by providing empirical evidences of the relationships comprising the level of BPO, the analytical capabilities, and effects of these variables over organizational performance, considering a sample of small and medium companies in Brazil, and identifying whether such effects are moderated by company’s size.
The structure of this paper is as follows. First,
the dimensions of BPO, Analytical Indicators and
Organizational Performance are presented. Then, the conceptual model and the research hypothesis are
identiied, followed by measurement scales and the structural model composition. In the methodological
section, the research strategy is described as well as the procedures adopted for collecting and treating
the data. The next part presents the descriptive
statistics and the structural equation modelling results for the global sample and for the sample
subsets (i.e. size and sector of activity - industry vs. commerce/services). Results are discussed and, in
the last section of the paper, study limitations and potential areas for further research on the theme are presented.
2 Theoretical background,
hypothesis and research questions
2.1 Business processes orientationThe BPO is a complex and multidimensional
construct, especially since it involves contents from
sub-areas of knowledge from operations, marketing,
and industrial engineering.
Business processes can be considered as a set of interrelated activities based on inputs and transformative resources, conducted to produce a good,
service, or both. Value delivery itself, as the result
of a process, is the condition for its effectiveness, and it is nearly always the result of an effort from
multiple functional areas of a company (Hammer & Stanton, 1999; Davenport & Short, 1990).
Process-oriented organizations are named with
various terms: horizontal organization (Ostroff, 1999; Byrne, 1993), process-centered organization (Doebeli et al., 2011; Hammer, 1996), process-focused organization (Gardner, 2004), and customer-centric organization (Bergh et al., 2012) to name a few.
A point in common for the designations is the fact that the BPO approach implies transformation of traditional structures. For this transformative
potential, the BPO approach depends on an extensive repertory of knowledge related to BPM, involving
design and analysis of processes, management
of process performance, and new IT and systems needed to sustain organizational structures (Skrinjar & Trkman, 2013).
The BPO construct domain could come to be delimited from some dimensions, such as those
referenced in the works of McCormack et al. (2003), Kohlbacher & Gruenwald (2011), and Willaert et al. (2007): i) the role of leadership in the construction of a vision of processes in the organization; ii) the
development and implementation of methodologies for mapping and documentation of processes;
iii) the establishment of performance targets for
the processes, aligned to the strategic objectives of
company business units; iv) the implementation of
suitable to models of management processes; v) the
presence of more horizontal organizational structures, in which resource coordination principles value the integration of the value stream in the organization’s
key processes; vi) the development of values and a culture positively identiied with the principles of process management; vii) the management of relationships and integration of value streams (goods and information) with external customers; viii) the
management of relationships and integration of value
streams (goods and information) with the organization’s suppliers; and ix) the intensive utilization of new
information technologies, promoting assertiveness
of the decision-making processes, further integration
of the value stream and more effective control over the performance of business processes. Given the potential relevance and recognition of the BPO construct for the competitiveness of companies,
Hypothesis 1 of the research is presented:
H1: There is a positive and statistically signiicant
association between business process orientation
(BPO) and organizational performance.
2.2 Analytical indicators
A considerable number of organizational performance results depend on the capabilities to be more agile, proactive, and responsive. These requirements—already important presently—are predicted to be even more critical in the near future, indicating analytical capabilities imbedded in business processes, in
systems of IT governance, and in decision-making
will be preconditions for future organizational success and sustainability. There are also indications that new capabilities to identify data patterns, anticipate events, to stimuli and optimize information from the business environment will constitute bases for
competition in the future (Davenport, 2006, 2013; Peterson, 2013; Oliveira et al., 2012; Lovett, 2012; Trkman et al., 2010).
The analytical approach (Business Analytics - BA) also proves to be a dificult concept term and its deinition includes a set of iterative actions of
collection, treatment and utilization of data relating to the business processes of companies, or their
supply chains. It is strongly dependent upon a
quantitative approach in the treatment of such data by means of statistical tests, both descriptive and multivariate in nature.
BA capabilities can be directed to several goals such as greater effectiveness of organizations in
describing their reality (i.e., descriptive analytics), analysis of problems (i.e., diagnostic analytics),
predicting future results based on present decisions or
actions (i.e., predictive analytics), and prescription of best practices for scenarios or company actions (i.e., prescriptive analytics) (Peterson, 2013; Davenport, 2013; Lovett, 2012; Davenport & Harris, 2007).
BA solutions combine disparate components for effective implementation: people, processes, and technological platforms. These components
interconnect to make extraction of value from large masses of data existing in a company’s business environment viable. Implementation of BA solutions
by an organization indicates that it recognizes the importance of a culture of measurement in business and developing capabilities, whether to measure customer preferences or interact with consumers more deeply. The scope of applications for these
solutions is extremely varied, including minimizing
process costs, improving assertiveness in predictive
models, growing market share, among others (Peterson, 2013; Lovett, 2012; Hedgebeth, 2007; Azvine et al., 2005).
In this sense, BA applications could be used to exploit data in order to discover new patterns and
relationships between them, or use quantitative
analysis to explain why certain speciic results
occurred for the organization. BA solutions could
also contribute to an organization’s knowledge
repository to simulate effects of certain business decisions, or in the anticipation of possible results of a decision using predictive models, important in
competitive scenarios marked by growing uncertainty
and turmoil.
Due to the convergence of proposals, we assume a strong, positive relationship between development of analytical capabilities and organizational performance.
We argue that extensive use of analytic indicators,
combined with BPO, influences performance
decisively. Nevertheless, despite the fact that the
potential associations between these concepts are
very clear, it remains necessary, from a scientiic
and business practices point of view, to quantify, measure and validate these associations. Given the relevance of the analitical approach and its potential association with the processes approach,
Hypothesis 2 of the research is presented:
H2: There is a positive and statistically signiicant
association between business process orientation
(BPO) and the use of analytical indicators by
companies.
Hypothesis 3 has also been tested in this study
H3. There is a positive and statistically signiicant
association between the use of analytical indicators and organizational performance.
2.3 Competitive performance and BSC Model
An impressive turning point occurred in recent decades, regarding organizational performance
measurement systems. In an extensive bibliographical review, Kennerley & Neely (2003) point out that
traditional performance measures were developed
with strong inancial-accountability biases, and
although companies valued them for decades, they are no longer appropriate from a contemporary perspective.The reasons for this statement can be
justiied since traditional inancial measurement systems are: (i) unable to supply important information concerning future business performance. Instead,
they are committed to generating short-term results
(Kaplan, 1986; Hayes & Abernathy, 1980); (ii) not
necessarily oriented to competitors and customers, but can have an intrinsic focus on functional
performance (Neely et al., 1995; Kaplan & Norton, 1992); (iii) devoid of strategic focus (Skinner, 1974); and (iv) potential inhibitors of innovation (Richardson & Gordon, 1980).
Among diverse performance measurement systems that have been disseminated broadly in business and
scientiic communities, the importance assumed by the Balanced Scorecard (BSC) over the last 30 years is distinct. Bourne et al. (2002) argue that BSC could
be elevated to one of the most important management tools developed in the last hundred years.
We discuss indicators that link to each of the four
BSC dimensions. These indicators can be customized
according to the speciics of each business model in which the BSC is implemented: (i) Financial perspective: Proit margin; cash low; revenue; return on assets (ROA); (ii) Customer/market
perspective: perception of product or service quality by the organization’s clients; degree of customer loyalty; degree of success in attracting
new clients; total value of property; (iii) Process
perspective; waste reduction; reduction of service lead times; reduction of the development time for new products; development of processes with
customers and suppliers; lexibility to respond to quantitative and qualitative variations in inal demand;
reduction of unit cost of production; reduction of costs of logistical services; technological and human capabilities embedded in business processes;
(iv) Learning and growth perspective:. quality of
human resources; potential for professional growth of employees in their areas of competence; level of
the workforce’s commitment; convergence between
human capabilities available in the company and strategic demands of the organization; organization’s
ability to generate knowledge from the execution
of their business processes.
By considering the synergistic associations of BPO and the use of analytical indicators on organizational performance, we pose the fourth hypothesis of this study:
H4: Both business process orientation and the use of analytical indicators affect positively the BSC dimensions of performance.
2.4 Small and medium businesses
In almost all national economies, small and
medium-sized companies play an important role in terms of job creation and the growth of economic
wealth of countries (Koh et al., 2007). Compared
to large organizations, small and medium ones have
speciic characteristics in terms of resource scaling,
organizational structures and management models,
among other characteristics. It would be inappropriate
to approach them as a “miniature” or “reduced scale” version of structures and business models of
large corporations (Beaver & Prince, 2004; Welsh & White, 1981; D’Amboise & Muldowney, 1988).
Small and medium enterprises are potentially likely to face greater barriers or obstacles in certain contexts. In the case of innovative products and processes, for example, particular dificulties may arise: (i) the lack of suficient inancial resources to carry out
isolated activities of research and development of new
products or processes (Carpenter & Petersen, 2002); (ii) the limited diversity of forms or mechanisms to
induce other companies to promote joint investments
necessary for innovation (James et al., 2013; Teece, 1986); (iii) access to physical assets and third-party
capabilities required for the commercialization of
innovations (Gans & Stern, 2003; Teece, 1986),
among other relevant issues.
It is not because they are smaller companies that
resource management processes in small and medium
companies are less complex. Yet given the particular needs or speciicities of small and medium-sized organizations (in terms of their capabilities or constraints), many solutions developed for large
companies, in respect to the management of resources and processes, development of techniques, heuristic and modeling design may not fully adhere to the
Two aspects are particularly interesting in the
study of Huin et al. (2002). First, the fact that the
containment of hierarchical levels - characteristic of small and medium structures – demands that
their chief oficers get directly involved in many
strategic and operational business decisions, and
with different stakeholders of the organization (intermediate customers, end users, suppliers and line employees, among others). This research also
corroborates the fact that functional boundaries
are not clearly deined in business models and
structures of small and medium-sized businesses, often requiring the same management professional,
for example, in the coordination of resources and
processes in an interfunctional approach.
Harris & Rae (2009) highlighted the immense
opportunities for smaller companies following the development of the internet, in particular the access to critical information in different formats and methods of communication. Small businesses’ accesss to the
huge mass of data found in social networks, blogs, forums and virtual networking groups allows, in exponential progression, them to get and make
strategic use of information relevant to the future performance of their businesses. The authors argue in this regard that the development of analytical approaches for small and medium companies is a real phenomenon and that has been favored by the power and growing relevance of online communities.
In addition to the relationship between company
and customer, there is growing evidence that internet-based solutions can enable companies,
regardless of size, to increase the eficiency and eficacy of management in electronic markets, and intermediaries (Adebanjo et al., 2006). Different studies (Loukis et al., 2012; Cheng et al., 2010; McIvor & Humphreys, 2004; Ranganathan et al., 2004; Lancioni et al., 2000), among others, recognize that new types of information technology (especially solutions based on the internet) deine relevant
structural conditions in order to emulate collaborative practices between companies. Considering then, on
the one hand, the speciicities of smaller organizations
vis-à-vis the structures of large corporations, but
also stressing that disparities in size exist and are
important among small and medium organizations,
the ifth hypothesis of this investigation is identiied
as follows:
H5: Disparities exist among small and medium
companies when comparing business process orientation, the use of analytical indicators and their impact on organizational performance.
3 Conceptual research model and
indicators
3.1 The model
The conceptual hypothetical model for the study consists of three constructs: BPO, Analytical
Indicators and Organizational Performance.
The BPO construct is represented in the structural model as a second-order latent variable,
consisting of nine latent variables of the irst order. The measurement models of these nine irst order latent variables present a relective nature, totaling 37 indicators. The irst-order constructs of BPO and
its respective traits were adapted from the models
validated by McCormack et al. (2003), Kohlbacher & Gruenwald (2011) and Willaert et al. (2007).
The Analytical Indicators construct, also relective in nature, is represented in the model as a irst-order latent construct comprising 9 indicators extracted
from the BPO model and process maturity model
developed by Lockamy & McCormack (2004), and are detailed in McCormack (2007).
Finally, the Organizational Performance construct, represented in the model as a second-order latent
variable, consists of four irst order constructs, also relective in nature, with all its 15 indicators, was
comprised of traits based on the four dimensions of performance that are traditionally developed on
BSC models (Kaplan & Norton, 1992, 1996). Both the irst order latent variables and the
measurements items for all these constructs are summarized on Charts 1, 2 and 3, on the Appendix A of this document.
4 Research design
4.1 Sampling design and large-scale data collection
In our study, the population consisted of small
and medium companies from the industrial and
commerce/services production sectors of the Brazilian
economy. For the characterization of size, it was
adopted the IBGE methodology (Brazilian Institute of Geography and Statistics), and that resonates
with methodologies of research institutions in other
countries: number of formal employees directly linked
to the business and annual gross operating revenue. The study’s target population was a diverse group of small and medium organizations from
business consulting worldwide and the irst school for executive education in Latin America (Financial Times, 2013).
The use of key informants in research for obtaining
organizational data is a widely used approach. Several pieces of research in organizations have
relied on an approach based on key informants in
order to capture the understanding of organizational
functioning (Braunscheidel & Suresh, 2009; Cao & Zhang, 2011; Carr & Smeltzer, 1999; Carter & Jennings, 2002; Kiessling et al., 2012; Oliveira, 2009). Key informants are different from typical
respondents to questionnaires. They are usually chosen for their formal position in the organization
and their knowledge of key issues of the study,
favoring the contribution of generalizations about behavior patterns and investigated organizational
phenomena (Gupta et al., 2000; Kumar et al, 1993; Seidler, 1974).
Using a database of companies linked to executive
education programs from the Fundação Dom Cabral,
which included approximately 2200 companies, a
pre-test was conducted to validate the instrument and generate an estimated standard deviation for the population, further used for sampling calculation.
The pre-test was conducted with 35 companies,
selected randomly from the FDC database. Based on an analysis of standard deviation indices
(obtained from a sum of indicators from each of the three constructs of the model), the parameter selected for inal calculations in the sample was BPO since
it had the standard deviation with greatest variance.
The inal size calculation for the sample involved specifying a conidence interval of 95% (z = 1.96), and a maximum sampling error of 3. The value of the error corresponded to a 2.34% range for BPO during the pre-test, which rose to 128 points. Based on parameters from Anderson et al. (2009)
and considering the reliability and error estimates
speciied for the study, statistics from the pre-test identiied a recommended sample size - a minimum of 448 cases.
Access to data involved face-to-face application of questionnaires. The questionnaire was developed based on the literature with structured questions
based on the Likert ive-point scale (Likert, 1932). A strategy to make data collection possible was to collect it during executive courses sponsored by the FDC. From August 2013 to January 2014, over several weeks of classroom courses of FDC executive education, participants were presented with the concepts and operational deinitions of the
variables in the model.
After 06 months of data collection, respondents from 476 companies had answered the questionnaire,
surpassing the number of cases recommended in the
sample planning (448 cases).Prior to calculating
descriptive statistics, scale reliabilities were analyzed, combined with an analysis of missing data and outliers.
Prior to calculating descriptive statistics, scale reliabilities were analyzed, combined with an analysis of missing data and outliers. Reliability
was assessed using Cronbach’s alpha coeficient for the relective constructs. Values exceeded 0.75 in all
cases, suggesting reliability and convergent validity. Regarding missing data, univariate tests showed that for seven organizations, the number
of non-responses was higher than 10% of the total
variables in the model. Given the importance of this
percentage, we eliminated these 7 companies from
the sample, reducing it to 469 cases. Due to their low percentage, the remaining cases with missing data were treated using substitutes of the median of the two points neighboring the variable without a response.
Results from outliers did not suggest a non-random
pattern that would necessitate removal. The inal sample of 469 cases was comprised of 286 smalland 178 medium companies. Five companies did not
respond to questions regarding size. The highest
percentage (62.5%) was comprised of organizations from the commerce/services sector (293 companies) and the remainder from the industrial sector (144). The inal sample of 469 cases was comprised of 286 small and 178 medium companies, according to
the analysis of the number of formal employees and annual gross operating revenue. Five companies did not respond to questions regarding size. According
to the sector, the highest percentage (62.5%) was comprised of organizations from the commerce / services sector (293 companies) and the remainder from the industrial sector (144). Of all samples, a small percentage of companies (32 companies, 6.8%) did
not report their business sector.
5 Results
5.1 Statistical description of the data and correlations: global sample
Bivariate correlations were used to describe relationships among constructs. Results suggest a strong and positive correlation between the model constructs. The strongest correlations were observed in the medium-sized group of companies, but in all
cases they were statistically signiicant (p <0.01)
(Table 2). This inding suggests a favorable situation for larger companies.
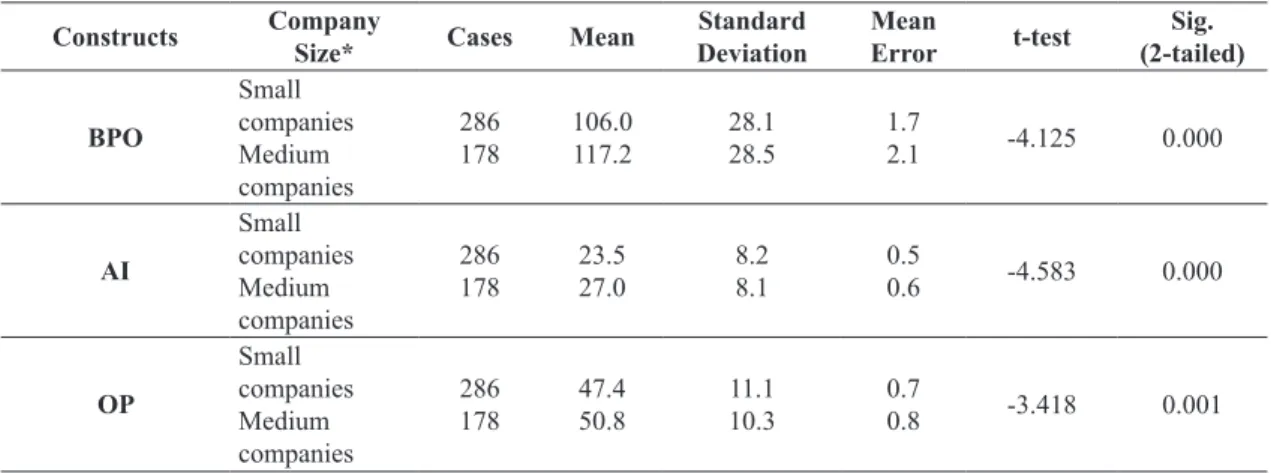
One purpose was to discover at what point differences in mean scores from the two groups
(i.e., small and medium companies) were signiicant.
To accomplish this, a t-test comparison of means was used, the results of which suggested rejection of the null hypothesis, that there are no differences
between the means of groups (p < 0.001).
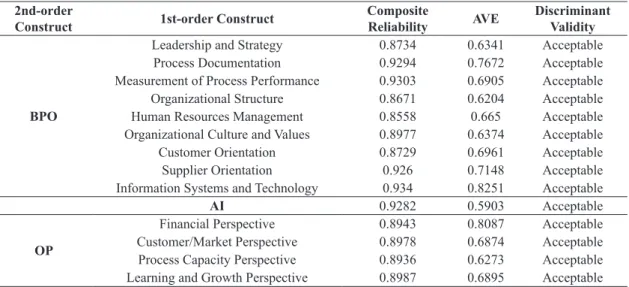
5.2 Test of the measurement models
Since all constructs were taken as relective, the steps recommended by Hair et al. (2014) to evaluate
measurement models were followed. To test internal consistency and reliability, composite reliabilities were estimated. All of them were satisfactory, with
values between 0.6 and 0.95. To evaluate discriminant validity, both cross-loadings and the Fornell-Larcker
method were used. Evaluating the cross-loading
table, taking all indicators’ outer loadings with the
associated construct and comparing with the outer loadings on other constructs, all results showed
discriminant validity. The Fornell-Larcker method was used to compare the square root values of AVEs for each relective construct with latent variable
correlation scores, which suggested no problems
regarding discriminant validity (Table 3).
The bootstrapping method was used to assess measurement models. Results from the t- tests showed that all relationships between manifest variables and
latent constructs were valid (p < 0.001). Therefore,
measurement models were validated, indicating that the manifest variables represented the constructs
well. The speciication of the structural research
model rejects the null hypothesis of absence of
statistically signiicant associations between the
level of guidance to business processes, the use of analytical indicators and organizational performance for the sample companies. This null hypothesis was
rejected at a high signiicance level (p-value < 0.001).
This indicates a low probability of obtaining a data pattern, as found in this sample, if the null hypothesis was true. After access the measurement model, Table 4 shows results of structural model test, identifying direct effects among model constructs.
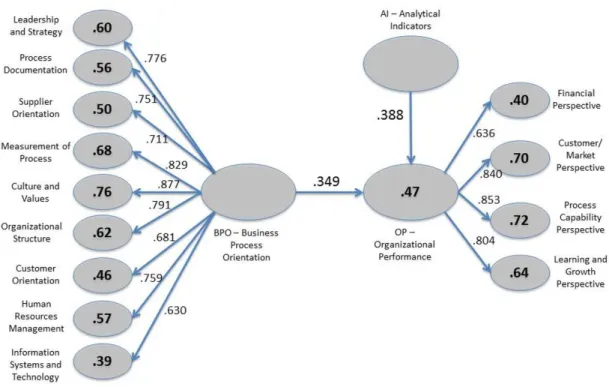
The values of coeficients of determination (R2), obtained by multiple regression of the model
variables, indicate that a substantial portion of the
variations in the constructs of irst and second order models can be explained by variations of covariates in such constructs. The two calculated extreme
values related to the latent variable performance
in two of its dimensions deserve mention: inancial (R2 = 0.40) and capacity in processes (R2 = 0.72).
Importantly, the data also indicates a substantial
variation in the overall performance of the sample
companies (47.50%). This can be explained by
variations in the structural model covariates, that is, the dimensions of BPO and analytical indicators.
The Figure 1 summarizes the results of the
structural model, identifying values for coeficients of determination and direct effects (paths) between
Table 1. Correlations among model constructs.
Correlation Small
Companies
Medium Companies
BPO⇔AI 0.712* 0.768*
AI⇔OP 0.584* 0.702*
BPO⇔OP 0.565* 0.747*
N = 469 cases. * All correlations signiicant at p<0.01 (2-tailed). Source: Research data.
Table 2. Cross tabulation of scores obtained on the dimensions of the research model with respect to company size:
small × medium companies.
Constructs Company
Size* Cases Mean
Standard Deviation
Mean
Error t-test
Sig. (2-tailed)
BPO
Small companies Medium companies
286
178 106.0117.2 28.128.5 1.72.1 -4.125 0.000
AI
Small companies Medium companies
286
178 23.527.0 8.28.1 0.50.6 -4.583 0.000
OP
Small companies Medium companies
286
178 47.450.8 10.311.1 0.70.8 -3.418 0.001
the main model constructs and between those and the indicators.
Path coeficients (direct effects) can be classiied
generally at three levels of impact; values between
zero and 0.3 are weak, 0.3 to 0.7 strong, and over 0.7 very strong. Data presented by average show very strong signiicance of direct effects in the structural
theoretical model constructs. Furthermore, it is this data that refutes the null hypothesis of differences
between model path coeficients confronted the
original sample and the samples generated by
bootstrapping. In other words, the structural model
was supported since relationships between constructs
were proven to be signiicant, and the direct effects were conirmed by the bootstrapping statistic test.
To assess how well the structural research model
its the data collected, the Goodness of Fit – GoF test was employed. This index is useful in measuring
Table 4. Bootstrapping and the test of the structural model: direct effects.
Original Sample
Sample mean
Standard Deviations
Standard
Error T Statistic p-value
BPO ➔Leadership and Strategy 0.7761 0.7771 0.0187 0.0187 41.5725 0.000
BPO ➔Process Documentation 0.7512 0.7504 0.0224 0.0224 33.6075 0.000 BPO ➔Measurement of Process
Performance 0.8289 0.8292 0.0174 0.0174 47.6307 0.000
BPO ➔Organizational Structure 0.7908 0.7916 0.0174 0.0174 45.4670 0.000 BPO ➔Human Resources
Management 0.7585 0.7600 0.0244 0.0244 31.0595 0.000
BPO ➔Organizational Culture
and Values 0.8767 0.8771 0.0113 0.0113 77.6285 0.000
BPO ➔Customer Orientation 0.6813 0.6811 0.0279 0.0279 24.4149 0.000 BPO ➔Supplier Orientation 0.7107 0.7102 0.0255 0.0255 27.8869 0.000 BPO ➔Information Systems
and Technology 0.6296 0.6299 0.0307 0.0307 20.5201 0.000
BPO ➔Performance 0.3497 0.3443 0.0576 0.0576 6.0661 0.000
AI ➔Performance 0.3882 0.3938 0.0553 0.0553 7.0229 0.000
OP ➔Financial Perspective 0.6365 0.6364 0.0303 0.0303 20.9849 0.000 OP ➔Customer/Market
Perspective 0.8406 0.8406 0.0181 0.0181 46.4027 0.000
OP ➔Process Capacity
Perspective 0.8529 0.8534 0.0159 0.0159 53.6547 0.000
OP ➔Learning and Growth
Perspective 0.8040 0.8037 0.0197 0.0197 40.8704 0.000
Source: Research data.
Table 3. Summary of the assessment of relective measurement models.
2nd-order
Construct 1st-order Construct
Composite
Reliability AVE
Discriminant Validity
BPO
Leadership and Strategy 0.8734 0.6341 Acceptable
Process Documentation 0.9294 0.7672 Acceptable
Measurement of Process Performance 0.9303 0.6905 Acceptable
Organizational Structure 0.8671 0.6204 Acceptable
Human Resources Management 0.8558 0.665 Acceptable
Organizational Culture and Values 0.8977 0.6374 Acceptable
Customer Orientation 0.8729 0.6961 Acceptable
Supplier Orientation 0.926 0.7148 Acceptable
Information Systems and Technology 0.934 0.8251 Acceptable
AI 0.9282 0.5903 Acceptable
OP
Financial Perspective 0.8943 0.8087 Acceptable
Customer/Market Perspective 0.8978 0.6874 Acceptable
Process Capacity Perspective 0.8936 0.6273 Acceptable
Learning and Growth Perspective 0.8987 0.6895 Acceptable
the it of both measurement and structural modes (Vinzi et al., 2010). The GoF was calculated from
the geometric mean of the commonalities and values
were estimated for determining the coeficients of the model. In general, the GoF results lie between 0 and 1. Although no speciic limits exist to discriminate weak, moderate and substantial value indices (relative to the overall it of the model), conservative inferences
allow show that the higher the GoF estimation, the better the model performance. As can be seen in the following Equation 1, the value of GoF estimated
in the study was 0.61, indicating a good it of the
model to the data collected.
2 x R
0.600071 x 0.625479 0.612643
GoF commonalities
GoF
=
==
(w1)
Finally, the f2 effect test was employed, which
produces additional information to that obtained
by calculating the coeficients of determination (R2) (Hair et al., 2014). The test allows for the
omission of exogenous constructs of the model,
one at a time, to identify whether they have or not a substantial impact on one or more endogenous
constructs of the model (in the case of research, the performance). According Hair et al. (2014),
for testing the f2 effect, values between 0.02 and
0.15 may be taken as representative. Evaluating the
f2 effect, both BPO (0.103) and AC (0.128) were
proven to inluence OP.
6 Discussion and further analysis
This study’s indings corroborate extant studies thatpurpose that both BPO and Analytical Capabilities
can be taken to explain variance in organizational performance (Davenport, 2013; Klatt et al., 2011; Houy et al., 2010).The percentage of organizational performance variance that was explained by the companies of our structural model can be taken as very high (47,50%). This result has important
implications from the perspective of consolidation of
theories that seek to explain the effects of BPO and
analytical approach to organizational performance. The result is equally relevant in a practical sense, as it allows companies to identify the best initiatives and management efforts necessary and that which can generate the greatest impact on organizational performance.
The two groups of companies in the sample (i.e., small and medium companies) were compared
based on correlations among pairs of constructs i.e.,
(BPO versus Analytical Capabilities, BPO versus
Organizational Performance, and Analytical Capabilities
versus Organizational Performance). The strongest correlations (signiicant at p value <0.01) were found
Figure 1. Structural Model Test (coeficients and path coeficients of determination): Global sample = 469 companies,
in the group of medium-sized businesses, indicating
that size is an important issue and should be taken
as a moderator of the phenomena investigated in this study. Our analyzes indicate that the greater the size of the organization, the potentially higher are the BPO levels and the use of analytical indicators
of these companies, and equally more signiicant
the joint effects of these factors on organizational performance are.
Tests demonstrate disparities between groups
(small and medium companies). The t-test comparison
of means The T-test comparison of means refutes
the null hypothesis (that there exist no differences between the averages of the two groups) to a very high level of signiicance (p value <0.001). This leads to a conident conclusion that there are statistically signiicant differences between the mean values
found for the two groups. The more intensive use of analytical indicators and the degree of orientation to business processes, in the case of medium-sized
companies (probably with concomitant higher levels of maturity of their processes), the stronger the
effect on the performance of these organizations.
Examining direct effects among constructs in our study, the following evidences were identiied (i) priority opportunities for management actions on the part of the investigated companies, (ii) priority opportunities for the development of scientiic
research on the subject of the research:
• Organizational Culture and Values: In this
investigation, direct effects of BPO on
cultural/value aspects were greatest among all relationships relected by BPO; the coeficient
of determination was highest among all the factors in the model. Results demonstrate that effects related to dissemination of values and of a culture of processes for organizational performance are important. This requires deliberate action and strategy by managers, promoting recognition of the importance of processes to all company employees, contributions that each process offers in providing value to an organization’s customers, how various business processes interrelate, and how they
are affected by the experiences of individual and group work (Kohlbacher & Gruenwald, 2011; Willaert et al., 2007; Mertens et al., 2011).
• Performance Measures: Assuring alignment
between strategic business objectives and performance of organizational processes is an important for the competitiveness of companies.
Yet, in addition it represents a condition that in
order to be addressed, demands improvements in measurement systems, and at times requires continuous evaluation of the quality of an
organization’s metric system (Hammer, 2007b; Ndede-Amadi, 2004). In our study, the direct
effect of BPO on process performance and
the coeficient of determination obtained
from the regression reinforce the perception of the importance of a culture of measurement
addressed by BPO assumptions. In particular, the
need for organizations to develop measurement
systems with multiple measures that relect the
scope of business objectives, and can serve
the interests of the various stakeholders that are directly linked to the business (Sidorova & Isik, 2010; Yen, 2009).
• Process Documentation: Business processes must be duly speciied so they can be executed correctly (Kohlbacher & Gruenwald, 2011; Hammer, 2007a; McCormack et al., 2003). In this study, the direct effects of BPO on
process documentation and the percentage variance for this factor in the function of BPO
were expressive.
• Information Systems and Technology: Effective integration of the physical and information low
in business processes, which are essentially inter-functional, increasingly depend on employing new information technologies. Our results suggest that the magnitude of the direct effect on the relationship between BPO and information
systems and technology is signiicant,as well
as the percentage of variance as a function of latent variable BPO in the structural model. These effects are understandable; for the greater
part of organizations in the sample, IT had been
effective at promoting integration of data from
various organizational functions, making rapid
access to data on process performance available in real time and supporting implementation of strategies.
• Customer and Supplier Orientation: BPO
implementation and practices are not circumscribed
within intra-organizational limits. Our indings
• Organizational Performance: Companies frequently ind it dificult to deine what to
measure and how to measure what they need to
measure (i.e., which key performance indicators and metrics, respectively) to implement strategies (Cokins, 2010). BSC dimensions (construct dependent on the structural model of this research) are useful when balancing
performance areas critical to an organization, regardless of the size and sector of the activity
(Sundin et al., 2010; Kaplan & Norton, 1992, 1996).
This study conirms the substantial effects of BPO and Analytical Indicators regressors on the four relective factors that comprise the performance construct: process capabilities, customers/markets, learning/growth and inancial perspective. Particularly, the inancial perspective showed an effect that despite being expressive was lowest when compared to the
other effects on the performance construct. All effects
were considered signiicant at p-value <0.0001, that is, one can say with statistical conidence that
the probability that these effects have occurred by chance is virtually nil.
The research indings support all ive hypotheses of this study, at high level of signiicance (p < 0.01):
▪ BPO and Organizational Performance (Hypothesis1): indicating that the more process oriented a irm is the better the organizational performance in the studied dimensions (market, inancial, learning and capabilities in process). ▪ BPO and Analytical Indicators (Hypothesis2):
indicating a strong positive association between business process orientation and the use of analytical indicators by companies.
▪ Analytical Indicators and Organizational Performance (Hypothesis3): indicating that
the greater the use of analytical indicators by companies, the better their organizational performance.
▪ BPO, Analytical Indicators and Organizational Performance (Hypothesis 4): business process
orientation and analytical indicators have a
synergistic impact and explained a considerable
portion of organizational performance variance.
▪ The effects of BPO and analytical indicators over organizational performance were inluenced
by company size, as this moderator variable altered the strength of the relationships between
those constructs (Hypothesis 5).
7 Limitations, future research and
conclusions
The indings of this study support validation of our
conceptual model and statistical tests demonstrate positive effects of processes orientation and analytical capabilities over organizational performance.
The study identiies another important difference
between small and medium companies, with a high
level of statistical signiicance, showing that size
can be an important moderating variable in the relationship between the studied constructs.
Although the sample were composed of a heterogeneous set of companies, Although the sample were composed of a heterogeneous set of companies, we recognize that other variables, yet not directly
considered in this study, are suficiently important
to be considered in future studies. The type and
degree of complexity of production of goods and
services; the level of customization of products; the patterns of demand; the production strategies; the business rules and others factors cannot be ignored in their relevance to the problem addressed in this
research. Therefore, a detailed examination of the
importance of these factors to the relationships investigated in this study will be of value in future studies on the topic.
A relevant study in this sense, would be focused on
describing the extent to which production strategies
and business demand patterns affect interest in the implementation of an approach to processes or the use of analytical processes in conducting of business.
In this sense, further studies may identify the existence
of differences with regards to the importance and the parameters for the implementation of BPO and analytical approaches when presented with companies with production strategies in make to stock environments and business models operated
in other conditions (for example, in make to order and engineering to order regimes). There are critical
success factors in these implementations, and it
would also be useful to recognize the extent to
which these factors are the same, for such different business models.
Although our model regressors explained a
considerable portion of performance variance, other independent variables and moderators were not considered in this study. Besides this, Another
limitation is related to our exclusive dependence
on quantitative tests to evaluate the relationships between the latent variables of the model, or the
fact that data were collected from key informants
selected by a criterion of accessibility, constituting a non-probabilistic sample.
All of these limitations are important; they adjust
projections and contributions restricted in some way.
However,, due to the relevance of the questions and methodological rigor in work, indings are robust, reinforce theoretical knowledge accumulated on the topic, and have a potential inluence on the scope
of companies’ management decisions. The results
demonstrate the beneits obtained when organizations seek to improve simultaneously and in a synergistic
way their business process orientation and their
analytical capabilities, making them more assertive
in their strategic planning and support of decisions – of operational or strategic nature - affecting their performance and competitiveness at the present time, but also affecting the critical results that may
inluence their survival in the future.
Acknowledgements
The authors would like to thank Fundação de
Amparo à Pesquisa do Estado de Minas Gerais
(FAPEMIG) for their support and assistance with
this project.
References
Adebanjo, D., Kehoe, D., Galligan, P., & Mahoney, F. (2006). Overcoming the barriers to e-cluster development in a low product complexity business sector. International Journal of Operations & Production Management, 26(8), 924-939. http://dx.doi.org/10.1108/01443570610678675. Anderson, D. R., Sweeney, D. J., & Williams, T. A. (2009).
Essentials of statistics for business and economics (5. ed.). Mason: Thomson South-Western.
Association of Business Process Management Professionals – ABPMP. (2009). ABPMP CBoK: guide to the BPM common body of knowledge. St. Paul.
Azvine, B., Cui, Z., & Nauck, D. (2005). Towards real-time business intelligence. BT Technology Journal, 23(3), 214-225. http://dx.doi.org/10.1007/s10550-005-0043-0. Beaver, G., & Prince, C. (2004). Management, strategy
and policy in the UK small business sector: a critical review. Journal of Small Business and Enterprise Development, 11(1), 34-49. http://dx.doi. org/10.1108/14626000410519083.
Bergh, J. V., Thijs, S., Isik, O., & Viaene, S. (2012). The world is not enough: customer centricity and processes (pp. 1-6). London: BPTrends.
Bourne, M., Neely, A., Platts, K., & Mills, J. (2002). The success and failure of performance measurement initiatives. International Journal of Operations & Production Management, 22(11), 1288-1310. http:// dx.doi.org/10.1108/01443570210450329.
Braunscheidel, M. J., & Suresh, N. C. (2009). The organizational antecedents of a firm’s supply chain agility for risk mitigation and response. Journal of
Operations Management, 27(2), 119-140. http://dx.doi. org/10.1016/j.jom.2008.09.006.
Byrne, J. A. (1993, 20 de dezembro). The horizontal
corporation. Business Week, 76-81.
Cao, M., & Zhang, Q. (2011). Supply chain collaboration: impact on collaborative advantage and firm performance. Journal of Operations Management, 29(3), 163-180. http://dx.doi.org/10.1016/j.jom.2010.12.008. Carpenter, R. E., & Petersen, B. C. (2002). Is the growth
of small firms constrained by internal finance? The Review of Economics and Statistics, 84(2), 298-309. http://dx.doi.org/10.1162/003465302317411541. Carr, A. S., & Smeltzer, L. R. (1999). The relationship
of strategic purchasing to supply chain management. European Journal of Purchasing & Supply Management, 5(1), 43-51. http://dx.doi.org/10.1016/S0969-7012(98)00022-7.
Carter, C. R., & Jennings, M. M. (2002). Social responsibility and supply chain relationships. Transportation Research Part E, Logistics and Transportation Review, 38(1), 37-52. http://dx.doi.org/10.1016/S1366-5545(01)00008-4. Cheng, H. C., Chen, M. C., & Mao, C. K. (2010). The
evolutionary process and collaboration in supply chains. Industrial Management & Data Systems, 110(3), 453-474. http://dx.doi.org/10.1108/02635571011030079. Cokins, G. (2010). The promise and perils of the balanced
scorecard. Journal of Corporate Accounting & Finance, 21(3), 19-28. http://dx.doi.org/10.1002/jcaf.20576. Croxton, K. L., García-Dastugue, S. J., Lambert, D.
M., & Rogers, D. S. (2001). The supply chain management processes. The International Journal of Logistics Management, 12(2), 13-36. http://dx.doi. org/10.1108/09574090110806271.
D’Amboise, G., & Muldowney, M. (1988). Management theory for small business: attempts and requirements. Academy of Management Review, 13(2), 226-239. Davenport, T. H. (2006). Competing on analytics. Harvard
Business Review, 84(1), 98-107. PMid:16447373.
Davenport, T. H., & Harris, J. G. (2007). Competing on analytics. Boston: Harvard Business School Press.
Davenport, T. H., & Short, J. E. (1990). The new industrial engineering: information technology and business process redesign. Sloan Management Review, 31(4), 11-27.
Davenport, T. (2013). Enterprise analytics: optimize performance, process, and decisions through big data. Upper Saddle River: International Institute for Analytics, Pearson Education Inc.
Financial Times. (2013). Business education. Recuperado em 18 de dezembro de 2015, de http://rankings.ft.com/ businessschoolrankings/fundacao-dom-cabral Gans, J. S., & Stern, S. (2003). The product market and
the market for ‘ideas’: commercialization strategies for technology entrepreneurs. Research Policy, 32(2), 333-350. http://dx.doi.org/10.1016/S0048-7333(02)00103-8. Gardner, R. (2004). The process-focuses organization:
a transition strategy for success. Milwaukee: ASQ Quality Press.
Grover, V., & Malhotra, M. K. (1997). Business process reengineering: a tutorial on the concept, evolution, method, technology and application. Journal of Operations Management, 15(3), 193-213. http://dx.doi. org/10.1016/S0272-6963(96)00104-0.
Gupta, N., Shaw, J. D., & Delery, J. E. (2000). Correlates of response outcomes among organizational key informants. Organizational Research Methods, 3(4), 323-347. http://dx.doi.org/10.1177/109442810034002. Hair, J. F., Hult, G. T. M., Ringle, C. M., & Sarstedt, M.
(2014). A primer on partial least squares structural equation modeling (PLS-SEM). Thousand Oaks: Sage. Hammer, M. (1996). Beyond reengineering: how the
process centered organization is changing our work and our lives. New York: HarperCollins.
Hammer, M. (2007a). The process audit. Harvard Business Review, 85(4), 111-123. PMid:17432158.
Hammer, M. (2007b). The 7 deadly sins of performance measurement. MIT Sloan Management Review, 48(3), 19-28.
Hammer, M., & Stanton, S. (1999). How process enterprises really work. Harvard Business Review, 77(6), 108-118, 216. PMid:10662000.
Harris, L., & Rae, A. (2009). Social networks: the future of marketing for small business. The Journal of Business Strategy, 30(5), 24-31. http://dx.doi. org/10.1108/02756660910987581.
Hayes, R. H., & Abernathy, W. J. (1980). Managing our way to economic decline. Harvard Business Review, 58(4), 67-77.
Hedgebeth, D. (2007). Data-driven decision making for the enterprise: an overview of business intelligence applications. The Journal of Information and Knowledge Management Systems, 37(4), 414-420.
Houy, C., Fettke, P., & Loos, P. (2010). Empirical research in business process management: analysis of an emerging field of research. Business Process Management Journal, 16(4), 619-661. http://dx.doi. org/10.1108/14637151011065946.
Huin, S. F., Luong, L. H. S., & Abhary, K. (2002). Internal supply chain planning determinants in small and medium sized manufacturers. International Journal of Physical
Distribution & Logistics Management, 32(9), 771-782. http://dx.doi.org/10.1108/09600030210452440. James, S. D., Leiblein, M. J., & Lu, S. (2013). How
firms capture value from their innovations. Journal of Management, 39(5), 1123-1155. http://dx.doi. org/10.1177/0149206313488211.
Kaplan, R. S. (1986). Accounting lag: the obsolescence of cost accounting systems. California Management Review, 28(2), 174-199. http://dx.doi.org/10.2307/41165195. Kaplan, R. S., & Norton, D. P. (1992). The balanced
scorecard: measures that drive performance. Harvard Business Review, 70(1), 71-79. PMid:10119714.
Kaplan, R., & Norton, D. (1996). Using the Balanced Scorecard as a strategic management system. Harvard Business Review, 74(1), 75-85.
Kennerley, M., & Neely, A. (2003). Measuring performance in a changing business environment. International Journal of Operations & Production Management, 23(2), 213-229. http://dx.doi.org/10.1108/01443570310458465.
Kiessling, T., Harvey, M., & Moeller, M. (2012). Supply-chain corporate venturing through acquisition: key management team retention. Journal of World Business, 47(1), 81-92. http://dx.doi.org/10.1016/j. jwb.2010.10.023.
Klatt, T., Schlaefke, M., & Moeller, K. (2011). Integrating business analytics into strategic planning for better performance. The Journal of Business Strategy, 32(6), 30-39. http://dx.doi.org/10.1108/02756661111180113. Koh, S. C. L., Demirbag, M., Bayraktar, E., Tatoglu,
E., & Zaim, S. (2007). The impact of supply chain management practices on performance of SMEs. Industrial Management & Data Systems, 107(1), 103-124. http://dx.doi.org/10.1108/02635570710719089.
Kohlbacher, M., & Gruenwald, S. (2011). Process orientation: conceptualization and measurement. Business Process Management Journal, 17(2), 267-283. http://dx.doi. org/10.1108/14637151111122347.
Kumar, N., Stern, L. W., & Anderson, J. C. (1993). Conducting interorganizational research using key informants. Academy of Management Journal, 36(6), 1633-1651. http://dx.doi.org/10.2307/256824. Lambert, D. M., García-Dastugue, S. J., & Croxton,
K. L. (2005). An evaluation of process oriented supply chain management frameworks. Journal of Business Logistics, 26(1), 25-51. http://dx.doi. org/10.1002/j.2158-1592.2005.tb00193.x.
Lancioni, R. A., Smith, M. F., & Oliva, T. A. (2000). The role of the Internet in supply chain management. Industrial Marketing Management, 29(1), 45-56. http:// dx.doi.org/10.1016/S0019-8501(99)00111-X. Likert, R. (1932). A technique for the measurement of
Lockamy, A. 3rd, & McCormack, K. (2004). The development of a supply chain management process maturity model using the concepts of business process orientation. Supply Chain Management: An International Journal, 9(4), 272-278. http://dx.doi. org/10.1108/13598540410550019.
Loukis, E., Pazalos, K., & Salagara, A. (2012). Transforming e-services evaluation data into business analytics using value models. Electronic Commerce Research and Applications, 1(2), 129-141. http://dx.doi.org/10.1016/j. elerap.2011.12.004.
Lovett, J. (2012). Building a culture of measurement. Portland: Web Analytics Demystified. Recuperado em 10 de novembro de 2014, de http://www.webanalyticsdemystified. com/downloads/Demystified_Building-a-Culture-of-Measurement_SponsoredBy_Webtrends.pdf Mansar, S. L., & Reijers, H. A. (2007). Best practices in
business process redesign: use and impact. Business Process Management Journal, 13(2), 193-213. http:// dx.doi.org/10.1108/14637150710740455.
McCormack, K. (2007). Business process maturity: theory and application. Charleston: BookSurge.
McCormack, K., Johnson, W., & Walker, W. (2003). Supply chain networks and business process orientation: advanced strategies and best practices (APICS Series On Resource Management). Boca Raton: CRC Press. McIvor, R., & Humphreys, P. (2004). The implications of
electronic B2B intermediaries for the buyer-supplier interface. International Journal of Operations & Production Management, 24(3), 241-269. http://dx.doi. org/10.1108/01443570410519024.
Mertens, W., Bergh, J., Viaene, S., & Pander, F. S. (2011). How BPM impacts jobs: an exploratory ield study. Gent: Vlerick Leuven Gent Management School. White paper.
Ndede-Amadi, A. A. (2004). What strategic alignment, process redesign, enterprise resource planning, and e-commerce have in common: enterprise-wide computing. Business Process Management Journal, 10(2), 184-199. http://dx.doi.org/10.1108/14637150410530253.
Neely, A., Gregory, M., & Platts, K. (1995). Performance measurement system design: a literature review and research agenda. International Journal of Operations & Production Management, 15(4), 80-116. http:// dx.doi.org/10.1108/01443579510083622.
Oliveira, M. P. V. (2009). Modelo de Maturidade de Processos em Cadeias de Suprimentos: precedências e os pontos-chave de transição (Tese de doutorado). Faculdade de Ciências Econômicas, Universidade Federal de Minas Gerais, Belo Horizonte.
Oliveira, M. P. V., Mccormack, K., & Trkman, P. (2012). Business analytics in supply chains: the contingent effect of business process maturity. Expert Systems
with Applications, 9(5), 5488-5498. http://dx.doi. org/10.1016/j.eswa.2011.11.073.
Ostroff, F. (1999). The horizontal organization. New York: Oxford University Press.
Peterson, E. T. (2013). Ten tips to better leverage your existing investment in digital analytics and optimization. Recuperado em 10 de novembro de 2014, de http:// www.webanalyticsdemystified.com/downloads/Web_ Analytics_Demystified_ Digital_Insight_Management.pdf Ranganathan, C., Dhaliwal, J. S., & Teo, T. S. H. (2004).
Assimilation and diffusion of web technologies in supply-chain management: an examination of key drivers and performance impacts. International Journal of Electronic Commerce, 9(1), 127-161.
Reijers, H. A. (2006). Implementing BPM systems: the role of process orientation. Business Process Management Journal, 12(4), 389-409. http://dx.doi. org/10.1108/14637150610678041.
Richardson, P. R., & Gordon, J. R. M. (1980). Measuring total manufacturing performance. Sloan Management Review, 21(2), 47-58.
Seidler, J. (1974). On using informants: a technique for collecting quantitative data and controlling measurement error in organization analysis. American Sociological Review, 39(6), 816. http://dx.doi.org/10.2307/2094155.
Sidorova, A., & Isik, O. (2010). Business process research: a cross-disciplinary review. Business Process Management Journal, 16(4), 566-597. http://dx.doi. org/10.1108/14637151011065928.
Skinner, W. (1974). The decline, fall and renewal of manufacturing plants. Industrial Engineering, 6, 32-38.
Skrinjar, R., & Trkman, P. (2013). Increasing process orientation with business process management: critical practices. International Journal of Information Management, 33(1), 48-60. http://dx.doi.org/10.1016/j. ijinfomgt.2012.05.011.
Smith, H., & Fingar, P. (2003). Business process management: the third wave. Tampa: Meghan-Kiffer Press.
Sundin, H., Granlund, M., & Brown, D. A. (2010). Balancing multiple competing objectives with a Balanced Scorecard. European Accounting Review, 19(2), 203-246. http://dx.doi.org/10.1080/09638180903118736.
Teece, D. J. (1986). Profiting from technological innovation: Implications for integration, collaboration, licensing and public policy. Research Policy, 15(6), 285-305. http://dx.doi.org/10.1016/0048-7333(86)90027-2. Trkman, P. (2010). The critical success factors of
business process management. International Journal of Information Management, 30(2), 125-134. http:// dx.doi.org/10.1016/j.ijinfomgt.2009.07.003. Trkman, P., McCormack, K., Oliveira, M. P. V., & Ladeira,
chain performance. Decision Support Systems, 49(3), 318-327. http://dx.doi.org/10.1016/j.dss.2010.03.007. Vinzi, V. E., Chin, W. W., Henseler, J., & Wang, H. (2010).
Handbook of partial least squares. Berlin: Springer.. http://dx.doi.org/10.1007/978-3-540-32827-8. Welsh, J. A., & White, J. F. (1981). A small business is
not a little big business. Harvard Business Review, 59(4), 18-32.
Willaert, P., Bergh, J. V., Willems, J., & Deschoolmeester, D. (2007). The process oriented organization: a holistic view. Developing a framework for business process orientation maturity. In Business Process Management: Lecture Notes in Computer Science, Proceedings of the 5th International Conference/BPM (pp. 1-15). Brisbane: Springer. Yen, V. C. (2009). An integrated model for business process
Appendix A. Measurement model indicators.
Chart 1. BPO: latent variables and items.
2nd-order Construct
1st-order
Construct Items/Indicators
BPO
Leadership and Strategy
•Results aligned with the planned strategy. • Management committed to process improvement. • Strategies communicated throughout entire organization. • Effectiveness of strategic planning.
Process documentation
• Level of process documentation—basic and advanced.
• Deinition and documentation of responsibilities for processes and tasks. • Existence of a formal and standardized method for mapping processes. • Existence of a formal and standardized method for new process design.
Measurement of process performance
• Degree of development of performance indicators for processes. • Degree of implementation of performance goals for processes. • Usability of performance results to continuously improve processes. • Degree of alignment of process metrics with organizational strategies. • Governance on process measurement efforts
• Changing processes metrics.
Organizational structure
• Degree of integration of physical and information lows among departments.
• Effectiveness of coordination of interdepartmental activities.
• Formal presence in the organizational chart of the manager (owner) of the processes.
• Formal inclusion in organizational chart of the ofice or manager responsible for managing process improvements.
Human Resources Management
• Training organization’s collaborators on process management. • Training organization’s collaborators to change or implement new
processes in the organization.
• Degree of autonomy and responsibility of collaborators in decision-making.
Organizational Culture and Values
• Valuing of culture of processes in the organization. • Effort to align the processes goals among functional areas. • Effectiveness in managing interdepartmental conlicts.
• Frequency of meetings dedicated exclusively to the goals of process enhancement.
• Clear vision of collaborators regarding the company‘s structural model (functional- versus process-oriented)
Customer Orientation
• Centrality of customer in company business model. • Goods and services produced to meet customer expectations
• Intensive use of customer feedback to improve quality of products and processes.
Supplier Orientation
• Interest in developing programs to improve relationships with suppliers. • Effective integration of physical and information lows with suppliers. • Sharing information related to processes changes among contracted
organizations. • CPFR initiatives.
• Creation of formal teams comprised of contractors and contracted members to manage speed improvements of supply processes.
Information Systems and
Technology
• Data integration coming from various organizational areas.
• Use of information systems to support and facilitate improvements to business processes.
• Data accessible and reliable.
Chart 3. Organizational performance: latent variables and items.
2nd-order Construct
1st-order
Construct Items/Indicators
Organizational Performance
Financial perspective
• Financial result: proitability and increased revenue in recent years. • Financial result: cost reduction in the last two years.
Customer/Market perspective
• Eficiency in customer loyalty. • Eficiency in attracting new customers. • Evolution of company’s market share. • Customer satisfaction.
Process Capacity perspective
• Consistency in meeting promised delivery deadlines. • Reduction in time to service orders.
• Reduction in time to develop new products.
• Eficiency in managing inter-organizational processes with suppliers.
• Eficiency in managing inter-organizational processes with customers.
Learning and Growth perspective
• Percentage of employees with growth potential for process management capabilities.
• Labor force commitment to reach process performance goals. • Advance in knowledge regarding process management among
functional leaders or processes in the organization. • Labor force competencies in process management.
Source: The authors.
Chart 2. Analytical Indicators: latent variables and items.
1st-order
Construct Items/Indicators
Analytical Capabilities
• Evaluation of business proitability by segment of customers served. • Recognition of the demand patterns for company products.
• Use of mathematical methods and statistical models to predict demand. • Strategic actions based on client demands.
• Strategic actions based on customer proiles/customer segment. • Reliability of prediction methods used by the company.
• Effectiveness of production planning and control (PPP) regarding business proitability goals.
• Simulation of inancial and operational impact of future changes on production programming.
• Monitoring and analysis of forecasting errors.