ISSN 0104-6632 Printed in Brazil
Brazilian Journal
of Chemical
Engineering
Vol. 21, No. 02 pp. 325 - 333, April - June 2004
THE INFLUENCE OF THE MOISTURE CONTENT
OF MICROCRYSTALLINE CELLULOSE ON THE
COATING PROCESS IN A FLUIDIZED BED
O. S. Silva, S. C. S. Rocha
*and S. C. Marsal
Laboratory of Fluid-Dynamics and Drying, LFS, School of Chemical Engineering, State University of Campinas, Phone +(55) (19) 3788-3929, Fax +(55) (19) 3788-3922,
Cx.P. 6066, 13083-970, Campinas - SP, Brazil E-mail: rocha@feq.unicamp.br
(Received: February 13 2003 ; Accepted: October 16, 2003)
Abstract -The objective of this work was to study the coating of microcrystalline cellulose with a polymeric suspension in a fluidized bed. The coating operation was carried out using a fluidized bed with top spraying by a double-fluid nozzle. The fluidized bed consists of a cylindrical column made of plexiglass with a height of 0.6 m and an inner diameter of 0.14 m. The polymeric coating suspension was formulated using Eudragit® as the basic component. As the quality of the coating product is greatly affected by the spraying characteristics, the influence of the flow rate of the coating suspension and the moisture content of the particles on the agglomeration index and efficiency of the process of coating microcrystalline cellulose was analyzed.
Keywords: coating, fluidization, moisture content, microcrystalline cellulose.
INTRODUCTION The literature presents works concerning the
process of granule coating in the pharmaceutical area in fluid-dynamically active equipment, like the Glatt and Wurster process (Fukumori et al., 1991; Ichikawaet al., 1993; Heng et al., 1996 and Altaf et al., 1998), aiming mainly at analyzing the product in terms of formulation, additives and efficiency of the release kinetics. However, it’s necessary to study the effect of operational variables aiming at process optimization. Knowledge of the process allows design of the fluidized bed equipment to operate under optimized conditions. Microcrystalline cellulose in solid formulations of oral dosage is the main excipient used in the pharmaceutical industry due to its low reactivity with the active ingredients. In this work, two ranges of particle sizes were used: -0.420 + 0.300 mm for experiments 1 to 3 and --0.420 + 0.210 mm for experiments 4 and 5, with mean diameters of 0.330 and 0.308 mm, respectively. The objective of this work was to study the coating of The process of particles coating has been widely
microcrystalline cellulose with polymeric suspension in a fluidized bed and to analyze the efficiency of the process, the relative growth of particles, the agglomeration index and the effect of the moisture content of the particles before the bed collapsed.
MATERIALS AND METHODS
Materials
To study the fluid dynamics and coating in the fluidized bed, microcrystalline cellulose – MICROCEL, with a bulk density of 0.98 g/cm3 and a sphericity of 0.62, obtained for both sizes of particles, 0.330 and 0.308 mm was used.
Development of the coating suspension aimed at achieving an uniform and smooth coating surface. An aqueous polymeric suspension with a solids weight concentration of 12 % was utilized. The
polymer applied was Eudragit£ and the formulation included a pigment suspension of talc, titanium dioxide, magnesium stearate and lake colorant. This suspension had been used previously in polymer coating of urea in a spouted bed (Donida and Rocha, 2000). Table 1 shows the composition of this suspension.
The polymeric suspension, having Eudragit® as its basic component, is atomized on the of particles bed by a double-fluid nozzle. Preceding the coating experiments, the effects of the atomization air on the fluid-dynamic behavior of particles of microcrystalline cellulose in the fluidized bed were analyzed under different operational conditions of pressure and atomization air flow rate. Visual observations of the bed dynamics were made during the experiments, before collapse of the fluidized regime. In this stage, temperature, bed pressure drop and the moisture content of the particles were measured in order to identify the causes of bed collapse.
Table 1: Composition of coating suspension
Reactants (%) weight
Eudragit L30-D55 16.7
PEG 6000 0.75
Talc 2.75
Magnesium stearate 1.00
Titanium dioxide 1.40
Lake colorant 0.60
Triethyl citrate 0.50
Water 76.30
1 - blower 2 - heat exchanger 3 - drawer valve 4 - static pressure 5 - orifice plate 6 - electrical resistance 7 - compressed air line 8 - Bourdon manometer 9 - inlet bed
10 - plenum chamber 11 - perforated plate 12 - nozzle 13 - sampler 14 - cyclone
15 - suspension reservoir 16 - peristaltic pump 17 - thermocouple 18 - manometer
Experimental Setup
The experimental setup used in this study is shown schematically in Figure 1. The fluidization column was constructed of plexiglass having an inner diameter of 0.14 m and a height of 0.6 m. A 0.2 m high plenum chamber (10) is placed to the lower end of the column. The air distributor is a stainless-steel perforated plate with a free area of 5 %. Before entering the bed, the air is preheated by an electrical heater and the fluidizing air flow rate is measured by an orifice plate. The elutriated particles are collected at the column outlet by a cyclone. The nozzle atomizer (12) was supplied by a compressed air line (7) and the coating suspension was conveyed by a peristaltic pump (16).
a) Measuring Flow Rate of the Fluidization Air
The airflow rate is controlled by a drawer valve. There is an orifice plate on this line, where differential pressure is measured in a flange connected to the plate by a U-tube differential manometer whose manometric fluid has a density of 0.75 g/cm3.
Through the calibration equation for the orifice plate, the airflow rate is calculated as a function of the differential pressure on the plate. This equation was developed based on Ower and Pankhurst (1977):
1.5 0.5
0.5 sta
P P 0.22
Q 0.718 .
273.15 T P 273.15 T
ª '
'
ª º «
« »
¬ ¼ «¬
º » »¼(1)
where'P is the bed pressure drop, T is gas temperature and Psta is the absolute static pressure in the bed.
The mean velocity of the air in the bed is calculated by the following ratio:
g t
Q U
.A
U (2)
whereUgis gas density and At is the cross-sectional area of the bed.
The operational velocity, Uop, was of 15 cm/s, corresponding to 2.6 times the minimum fluidization velocity, Umf. In this work, Umf was determined by Richardson’s classic method (Richardson, 1971).
Atomization System
The atomization air is supplied by a blower of 10 cv, displacement of 1.1 m3/min and maximum
pressure of 175 psi. The line of compressed air has an inner diameter of one inch. The coating suspension is in 2,000 mL container under magnetic stirring.
The top spraying was done by a double-fluid nozzle, supplied with compressed air and the coating suspension conveyed by a Masterflex peristaltic pump.
Fluid Dynamics of the Bed
Before the coating experiments, preliminary tests were conducted with microcrystalline cellulose, aiming to establish appropriate fluidization conditions, based on observation of bed dynamics, related to operational velocity. A fluidization run was carried out during 2 h to verify the occurrence of particle damage by friction in the bed. After 0, 1 and 2 h samples of 50 g were collected to verify the breakage of particles by screen analysis with sieving and also with photos of the particles obtained by microscopy. This experiment was carried out with the load that had the best conditions for the fluidization regime, 0.7 kg of MICROCEL (Silva and Rocha, 2002).
Continuous Feeding of Coating Suspension
The process begins with air fluidization supplied by a blower of 2 cv with an empty bed. The air is heated to the desired temperature (60oC) by a group of four resistances in the fluidization air line.
After stabilizing bed temperature, the valve for air fluidization is closed and a load of 0.7 kg of MICROCEL is introduced into the bed. Soon after, the valve is opened and adjusted to the operational velocity, defined previously as 15 cm/s, to provide a good movement of the particles into the bed. The choice of load and of operational velocity was based on preliminary tests and by the limiting conditions of the equipment (Silva and Rocha., 2002).
The next step is atomization of the coating suspension, as described in the section on atomization system. When the coating suspension reaches the nozzle, it comes in contact with the compressed air and produces a spray on the particles bed.
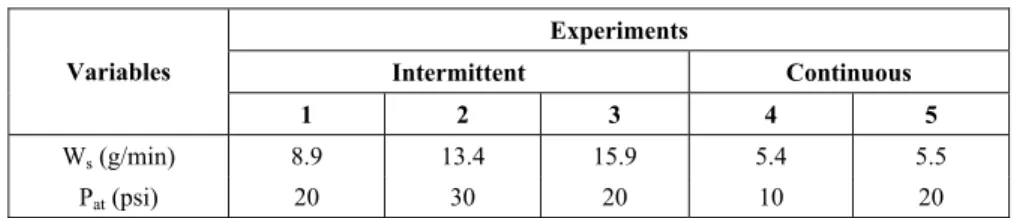
a) Process Condition
The operational conditions were defined in preliminary experiments and are given in Table 2, where Ws is the suspension flow rate and Pat is the atomization pressure. The inlet air temperature was maintained at 60 oC and the load in the bed at 0.7 kg for all the experiments. The pressure drop in the bed ranged from 490 to 505 Pa, in agreement with the resistance that the bed offers during the coating process.
Coating with Intermittent Feeding of Suspension
For the experiments using a coating suspension flow rate higter than 6 g/min with an atomization
pressure of 20 and 30 psi, it was necessary to conduct the coating process with intermittent feeding of suspension due to the tendency of the bed to collapse. At each interruption of the coating suspension, a sample of particles was collected from inside the bed. Bed temperature and pressure drop were measured and the fluid-dynamic behavior of the particles in the bed was observed. Also, the moisture content of the particles was determined three times by the Karl Fischer's method and then averaged.
Atomization of the coating suspension was restarted when the bed showed a good movement of particles until the need for a new interruption, which was visually verified by the occurrence of dead zones and a reduction in particle movement.
Table 2: Operational conditions
Experiments
Intermittent Continuous
Variables
1 2 3 4 5
Ws (g/min) 8.9 13.4 15.9 5.4 5.5
Pat (psi) 20 30 20 10 20
Determination of Coating Efficiency, the Agglomeration Index and Particle Growth
In the fluidized-bed coating process, MICROCEL granules grow by a layering mechanism. Each time the solids pass through the spray zone, a thin liquid layer is added to the granules and quickly solidifies. For evaluation of coating efficiency,K, the definition used by various researchers (Kucharski and Kmiéc, 1988; Oliveira, 1992; Ayub, 1993; Silva and Rocha, 2002), as in Equation 5, was adapted.
f i
s s p
mass of solid adhering to particles total mass of solid supplied to the bed
M M
W C t
K
(5)
where Mf is the final load of particles, Mo is the initial load of particles, Ws is the suspension flow rate, Cs is the suspension concentration and tp is the process time.
After they were sieved a small quantity of the coated particles had a diameter larger than 0.42 mm.
These particles were defined as agglomerated and an agglomeration index was determined by Equation 6.
agl
t
M
Agl 100
M (6)
where Magl is the total weight of agglomerates and Mt is the total mass of the product.
The mass relative growth was calculated by Equation 7.
f i
i
M M
100 M
G (7)
The moisture content of the particles during the coating process was determined by the Karl Fischer method.
RESULTS AND DISCUSSION
Fluid Dynamics and Coating
does not cause significant breakage. However, it was verified that around 2 % of the material had a diameter smaller than 0.100 mm in the two ranges of particle size studied. The two size ranges of particle sizes used in this work showed similar behavior and adequate solids movement during fluidization.
It was verified during the experiments that most of these fine particles were picked up in the initial instants of fluidization, evidencing that they were still linked to the larger particles (dp = 0.300 mm) by electrostatic forces. More than 60 % of the fines picked up by the cyclone contain particles smaller than 0.075 mm. This result indicates that the particles are quite cohesive in this size range (dp < 0.100 mm). When they are attached to the large particles, it is difficult to separate them by sieving. Thus, to continue this study, the total particle load is fluidized for five minutes before starting the coating process.
Figure 2 shows photos of the particles (40X magnified). In photo (a), particles of MICROCEL before fluidization can be observed; in (b), particles submitted to fluidization for 2 h are seen; in (c), the coated particles are shown and in (d), the formation of agglomerate during the coating process can be observed.
The formation of undesirable agglomerates indicates a shift in coating regime from layering to coalescence. It´s possible to observe the result of this behavior in Figure 2d. The range of the agglomeration index attained was from 0.4 to 4 %.
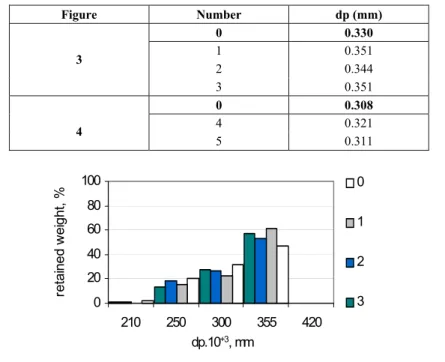
Five experiments on coating of MICROCEL were carried out using an Eudragit®polymeric suspension. After the experiments, the size distribution of these coated particles by sieving was analyzed. The distribution histograms are presented in Figures 3 and 4, were the experiments are identified with numbers from 1 to 5. In runs 1 to 3, the uncoated particles used are in the following size range: -0.420+0.300 mm. For experiments 4 and 5, this range was enlarged to -0.420+0.210 mm. The number "0" in Figures 3 and 4 represents the distribution of the uncoated particles of MICROCEL, having mean diameters of 0.330 and 0.308 mm, respectively. In Table 3 the mean diameters of the particles are presented for the two size ranges, before and after coating.
In the size distribution shown in Figures 3 and 4, it can be observed that an accentuated relative growth occurred for the mean range of particle sizes of around 0.355 mm independent of the size range used. Comparing the graphic behavior of these size distributions with the values in Table 3, it can be observed that this result contributed towards obtaining high values for the mean diameter of the particles, as in experiments 1, 3 and 4.
For coatings using the -0.420 + 0.210 mm range of particle sizes, runs 3 and 4, a larger amount of fine powder was collected by the cyclone (2.2 and 3.75 %) than for to the -0.420 + 0.300 mm range of particle sizes which had values lower than 0.5 %, for runs 1, 2 and 3.
(a) (b)
(c) (d)
Table 3: Particle-size distributions of MICROCEL before and after the coating process
Figure Number dp (mm)
0 0.330
1 0.351
2 0.344
3
3 0.351
0 0.308
4 0.321
4
5 0.311
0 20 40 60 80 100
420 355 300 250 210
dp.10+3, mm
re
ta
in
e
d
w
e
ig
h
t,
%
0
1
2
3
Figure 3: Particle-size distributions of MICROCEL for experiments 1, 2 and 3.
GSPP
UH
WDLQH
GZ
HLJ
KW
Figure 4: Particle-size distributions of MICROCEL for experiments 4 and 5.
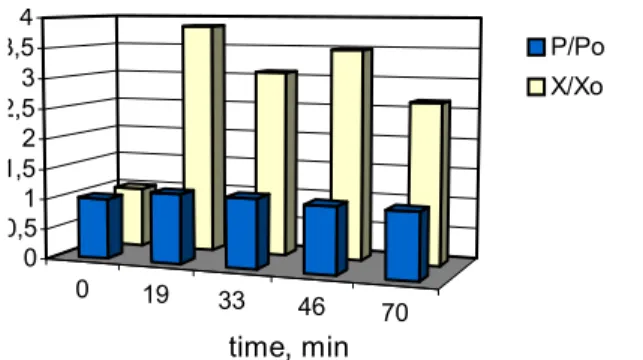
Determination of Moisture Content the Particles Before Collapse of the Bed
The experimental results point out that the suspension flow rate, associated with atomization pressure, has an important influence on the coating process. Packing of the bed was observed for the runs conducted with high coating suspension flow rates: 8.9; 13.4 and 15.9 g/min. This evidence was preceeded by the following effects:
1) a reduction in particle movement into the bed; 2) a decrease in temperature in the atomization region; 3) a small increase in bed pressure drop;
4) channeling.
In all experiments, moisture content of the particles was measured at each interruption of the
0 19 33
46 70 0
0,5 1 1,5 2 2,5 3 3,5 4
time, min
P/Po X/Xo
0 19 33
46 70 0
1 2 3 4
time, min
T/To X/Xo
Figure 5: The influence of bed temperature and moisture content of the particle versus process time. Po = 495Pa
and Xo = 8 %.
Figure 6: The influence of bed temperature and moisture content of the particle versus process time. To = 34oC
and Xo = 8 %.
Analysis of Efficiency, Growth and the Agglomeration Index
The results of the coating experiments are presented according to the experimental procedure used for the feeding of the coating suspension: intermittent or continuous.
a) Intermittent Feeding of the Coating Suspension
The results of coating experiments 1, 2 and 5 are shown in Table 4. It can be observed that run 5 had high efficiency, high relative growth and a high agglomeration index, as this run was carried out with a size distribution with a large number of small particles, a high coating suspension flow rate and a long process time. A larger number of fine particles was collected by the cyclone (3.75 %) than in runs 1 and 2, which produced a percentage of agglomeration lower than 0.5 %.
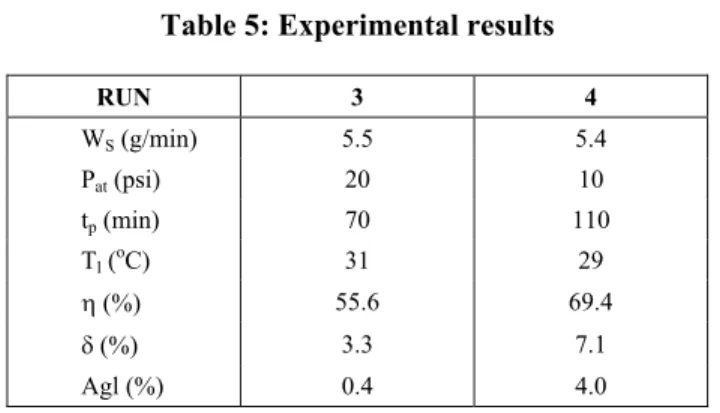
b) Continuous Feeding of Suspension
The results obtained for coating runs 3 and 4 are presented in Table 5. The results indicate that when the -0.420 + 0.210 mm range of particle sizes is used one can obtain higher efficiency, higher relative growth and a higher agglomeration index. Similar behavior was found for the experiments conducted with feeding of the coating suspension in an intermittent way.
With the results presented here it is not possible to guarantee that the film formed during the coating process has the same thickness for all the particles. However, analyzing the colored surface of the particles by optical microscope, one can verify an uniform film involving the whole particle surface. It is also observed that there is not any particle without coating in the product, indicating the process viability.
Table 4: Experimental results
RUN 1 2 5
WS (g/min) 8.9 13.4 15.9
Pat(psi) 20 30 20
tp(min) 40 35 70
Tl (oC) 32 27 29
K (%) 80.3 78.2 86.4
G (%) 4.4 5.6 17.5
Table 5: Experimental results
RUN 3 4
WS (g/min) 5.5 5.4
Pat (psi) 20 10
tp (min) 70 110
Tl (oC) 31 29
K (%) 55.6 69.4
G (%) 3.3 7.1
Agl (%) 0.4 4.0
CONCLUSIONS
From the results presented and analyzed here, the following conclusions can be drawn:
1) the two ranges of particle sizes used in this work showed similar behavior and adequate solids movement during the fluidization;
2) the relative growth of particles was evidenced more for a particle diameter of 0.355 mm, as shown by the retained weight versus particle diameter histogram, independent of the initial size range used; 3) the utilization of suspension flow rates higher than 6 g/min was possible only with intermittent feeding; 4) the coating experiments using the -0.420 + 0.210 mm range of particle sizes had a larger number of agglomerates (4 and 2 %), a larger number of fines collected by the cyclone (2.2 and 3.7 %) and a greater relative growth of particles, while another distribution (-0.420 + 0.300 mm) had amounts smaller than 0.5 % for all the parameters;
5) the moisture content of the particles during coating was the most important factor in identifying the beginning of collapse of the bed;
6) satisfactory values were obtained for coating efficiency, up to 86 % were obtained for two operational conditions when the suspension was fed in an intermittent way with Ws = 8.9 and 15.9 g/min, Pat = 20 psi, T = 60 oC;
7) It’s possible to carry out the coating process with this range of particle sizes in a fluidized bed only with intermittent feeding of the suspension. To understand the influence of operational variables in the process, it’s necessary to study it by experimental design.
NOMENCLATURE
Agl Agglomeration index %
At Cross-sectional area of the bed cm2 CS Suspension concentration g/min
dp Particle diameter mm
Magl Total weight of agglomerates g
Mo Initial load of particles g
Mf Final load of particles g
Mt Total mass of product g
Pat Atomization pressure psi
Pestá Static pressure drop in air line cm H2O
Q Airflow rate kg/min
tp Process time min
Tg Gas temperature oC
Tl Bed temperature oC
U Gas superficial velocity cm/s
Uop Operational velocity cm/s
Ws Suspension flow rate g/min
'P Pressure drop Pa
G Relative growth %
'P Pressure drop on the orifice plate cm H2O
Ug Gas density g/cm3
ACKNOWLEDGMENT
The authors are grateful to Foundation for Research Support of the State of São Paulo, FAPESP, for the financial aid received.
REFERENCES
Ayub, G.E.S., Recobrimento de Comprimidos em Leito de Jorro Bidimensional: Análise do Crescimento e Transferência de Calor Gás-Partícula. Masters’ thesis, Universidade Estadual de Campinas, Campinas (1993).
Donida, M.W. and Rocha, S. C. S., Polymer – coated urea in a two – dimensional spouted bed, Proceedings of the 12th International Drying Symposium – IDS’2000, paper no 357, The Netherlands (2000).
Fukumori, Y., Ichikawa, H., Yamaoka, Y., Akaho, E., Takeuchi, Y., Fukuda, T., Kanamori, R. and Osako, Y., Effect of Additives on Physical Properties of Fine Ethyl Cellulose Microcapsules Prepared by the Wurster Process, Chemical and Pharmaceutical Bulletin, 39, No. 1, 164 (1991). Heng, P.W.S., Wan, L.S.C. and Tan, Y.T.F.,
Relationship Between Aggregation of HPMC Coated Spheroids and Tackiness/Viscosity /Additives of the Coating Formulations, International Journal of Pharmaceutics, 138, 57 (1996).
Ichikawa, H., Jono, K., Tokumitsu, H., Fukuda, T and Fukumori, Y., Coating of Pharmaceutical
Powders by Fluidized Bed Process - V. Agglomeration and Efficiency in the Coating with Aqueous Latices of Copoly (Ethyl Acrylate-Methyl Crylate-2-Hydroxysthyl Metha-Crylate), Chemical and Pharmaceutical Bulletin, 41, No. 6, 1132 (1993).
Kucharski, J. and Kmiéc, A., The Effect of Process Parameters on Mass Distributions and the Efficiency of Tablets Coating in a Spouted Bed, Drying’88,II, 27 (1988).
Oliveira, W.P., Recobrimento de Partículas em Leito de Jorro. Masters’ thesis, Universidade Federal de São Carlos, São Carlos (1992).
Ower, E. and Pankhurst, R.C., The Measurement of Air Flow, 5th Edition, Pergamon Press, p.148 (1977).
Richardson, J.F. Incipient Fluidization and Particulate Systems. Fluidization, Davidson, J.F. and Harrison, D. eds., Academic Press, London (1971).