Vol. 52, n. 2 : pp. 427-436, March-April 2009
ISSN 1516-8913 Printed in Brazil BRAZILIAN ARCHIVES OF
BIOLOGY AND TECHNOLOGY
A N I N T E R N A T I O N A L J O U R N A L
A Study of Ion-Exchange Chromatography in an Expanded
Bed for Bovine Albumin Recovery
João Batista Severo Jr.
1, Roberto Rodrigues de Souza
1,
José Carlos Curvelo Santana
2and
Elias Basile Tambourgi
2*1Departamento de Engenharia Química; Campus Universitário "Prof José Aloísio de Campos"; Universidade Federal
de Sergipe; Av. Marechal Rondon s/n; 49100-000; São Cristóvão - SE - Brasil. 2Faculdade de Engenharia Química; Campus Universitário "Zeferino Vaz"; Universidade Estadual de Campinas; Av. Albert Einstein, 500; 13083-970; C.P.: 6066; Campinas - SP - Brasil
ABSTRACT
In the present work, the effect of bed expansion on BSA adsorption on Amberlite IRA 410 ion-exchange resin was studied. The hydrodynamic behavior of an expanded bed adsorption column on effects of the biomolecules and salt addition and temperature were studied to optimize the conditions for BSA recovery on ion-exchange resin. Residence time distribution showed that HEPT, axial dispersion and the Pecletl number increased with temperature and bed height, bed voidage and linear velocity. The binding capacity of the resin increased with bed height. The Amberlite IRA 410 ion-exchange showed an affinity for BSA with a recovery yield of 78.36 % of total protein.
Key words: BSA, protein adsorption, breakthrough curves, Amberlite IRA 410 ion-exchange resin, distribution residence time study, Richardson-Zack coefficient
*
Author for correspondence: [email protected]
INTRODUCTION
Expanded bed adsorption (EBA) is a downstream process developed from protein chromatography, but different in that shows the fluidized chromatographic adsorbent bed. It permits crude feeding into the chromatographic column without an initial treatment to eliminate the biological material suspension, and as the bed expands, it increases adsorbent surface contact, making interaction with the targeted molecules more effective (Amersham Pharmacia Biotech, 1997; Fernandez-Lahore et al., 2001; Roy et al., 1999). In the present work, studies on expanded bed adsorption behaviors were made to achieve a
better understanding of the effects of adsorbent type and size (Dainiak et al. 2002; Yamamoto et al., 2001), bed height, linear velocity (Mullick and Flickinger, 1999), fluidization and elution solutions effects on residence time distribution (RTD) (Fernadez-Lahore et al., 2001; Santos, 2001) for application in recovery of important biomolecules
.
PAA-Amberlite-458. The binding capacity of pure shikimic acid was about 81 mg for mL of adsorbent for both cross-linked PAA-Amberlite and native Amberlite in the fluidized mode of column operation. Binding capacity dropped to 17 and 15 mg/mL, respectively, when filtered fermentation broth was done and to about 10 mg/mL for cross-linked PAA-Amberlite when the fermentation broth containing cells was used directly. Native Amberlite cannot be used for the direct adsorption of shikimic acid due to the immediate clogging of the column and the collapse of the expanded bed. The cross-linked PAA-Amberlite was used repeatedly for direct adsorption of shikimic acid from the industrial fermentation broth.
Human serum albumin (HSA) from very dense Saccharomyces cerevisiae suspensions was recovered by expanded bed adsorption by Mullick and Flikinger (1999). The adsorption of proteins was on mixed-mode fluoride-modified zirconia (FmZr) particles (38 to 75 µm, surface area of 29 m2/g and density of 2.8 g/cm3).
Because of the high density of the porous zirconia particles, HSA (4 mg/mL) can be adsorbed in a FmZr bed expanded of three time its height. The expanded bed adsorption of any protein from a suspension containing more than 50 g DCW/L cells had not been previously reported. The FmZr bed expansion characteristics were well represented by the Richardson-Zaki correlation with a particle terminal velocity of 3.1 mm/s and a bed expansion index of 5.4 (Mullick and Flikinger, 1999).
Expanded bed hydrodynamics were studied as a function of bed expansion using RTD with sodium nitrite as the tracer. The authors perceived that the protein binding capacity at 5% breakthrough decreased from 22 mg HSA/mL settled bed void volume for 20 g DCW/L yeast to 15 mg HSA/mL settled bed void volume for 40 g DCW/mL yeast and remained unchanged for the higher yeast concentrations (60 to 100g DCW/L). However, the equilibrium binding capacity decreased monotonically as a function of yeast concentration (20 to 100 g DCW/L) and the binding capacity at 100 g DCW/L yeast was five times lower than that at 20 g DCW/L yeast. The lower equilibrium capacity at the high cell concentrations resulted from the adsorption of cells on the particle surfaces, restricting the access of HSA to the intraparticle surface area. To remove the adsorbed HSA and yeast from zirconia particles, 1500 to 2000 column volumes of 0.25 M NaOH were
required. No significant effect on chromatographic performance was observed after this treatment (Mullick and Flickinger, 1999).
Fernandez-Lahore et al. (2001) examined the suitability of ion-selective electrodes (ISE) for the determination of RTD in turbid, cell-containing fluids. The enhanced feedstock compatibility of IES is better than that of other tracer sensing devices and allows a better study of bed system hydrodynamics under relevant operating conditions. Within the linear range of the corresponding ISE-tracer pair, both the rate and pH are normally measured during the expanded bed adsorption (EBA) of proteins. Analyzing the RTD obtained after perfect ion-tracer pulse in terms of the PDE (PDE, axial dispersion, plug-flow exchange of mass with stagnant zones) gave a quantitative description of the underlying hydrodynamic situation during EBA processing. According to the authors, the data provided a powerful tool for predicting the overall process of adsorption with a defined feedstock type and composition. The best results were obtained using the intact yeast cell suspensions at different biomass contents (up to 7.5% wet weight) and buffer conductivities (5-12 mS) in an EBA column filled with the adsorbent Streamline QXL as fluidized phase.
In the expanded bed, sedimentation and particle fluidization must be attempted in order to obtain the optimal conditions of systems operation. Richardson and Zaki (1954) studied several materials and obtained Equation 1 for the relationship between the fluid velocity (U) and end velocity of the particle (UT) with the bed voidage (ε), which is given as:
n
t
U
U ε
= (1)
Where n is the Richardson-Zaki index or expansion index and is a function of the terminal Reynolds number (Ret).
µ
ρ
L T p tU d
=
Re (2)
For the Stokes region, Rep < 0.1, the terminal
velocity of an isolated particle (UT) is given as:
(
)
µ
ρ
ρ
18 2L P p T
gd
U = − (3)
acceleration; ρP, ρL and are particle and liquid specific mass and liquid viscosity, respectively. And particles Reynold number, Rep, is given as:
µ
ρ
UdP L
P =
Re (4)
With the linearization of Equation 1, it is possible to obtain n, experimentally with Equation 5 (Richardson and Zaki, 1954).
ε
ln lnlnU = UT +n (5)
The aim of the present work was to study the effect of bed expansion on BSA adsorption on Amberlite IRA 410 ion-exchange resin. The effects of addition of biomolecules and salts and temperature on hydrodynamic behavior of an expanded-bed adsorption column was also studied
to obtain the optimal conditions for BSA recovery on ion-exchange resin.
MATERIALS AND METHODS
Materials
Fluidizers
Distilled water (H2O), 0.07 M phosphate buffer at
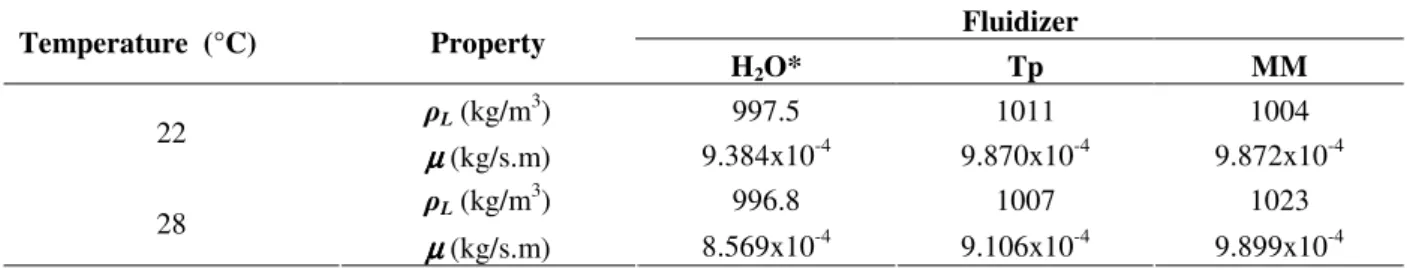
pH 6 (Tp) and maize malt at 2% (MM) in 0.07 M phosphate buffer at pH 6 were used. In the Table 1 shows the physical properties of the fluidizers. The properties of water were as described by Streeter (1977), the properties of the other fluids were measured by viscosimetry and by the changed weight of 1 mL of fluid volume. A pH of 6 was chosen as it fell midway between the optimal pH for α and β-amylases, and molecules targeted for futures work with maize malt.
Table 1– Fluidizers properties.
Fluidizer Temperature (°C) Property
H2O* Tp MM
ρL (kg/m3) 997.5 1011 1004
22
µµµµ(kg/s.m) 9.384x10⁻⁴ 9.870x10⁻⁴ 9.872x10⁻⁴
ρL (kg/m3) 996.8 1007 1023
28
µµµµ(kg/s.m) 8.569x10⁻⁴ 9.106x10⁻⁴ 9.899x10⁻⁴
*Souce: Streeter (1977).
EBA column
Figure 1 shows a scheme of the EBA column used in the present work. The glass column was 1x30 cm with an adjustable piston and feed flow inlet at the bottom and a product flow outlet at the top.
Sixty mesh plates at the feed inlet and at the product outlet were used to avoid the loss of adsorbents particles. A ruler was placed at the side of the column for the measurement of bed height.
Maize malt obtaining
Maize seeds were selected, weighed and washed. Seeds absorbed between 40 and 45% of the moisture and germinated in the laboratory at room temperature and pressure. The maize malt was dried at 55°C for 5 h and stored at 5°C (Biazus et al., 2005 and 2006; Ferreira et al., 2007; Malavasi and Malavasi, 2004; Severo Júnior et al., 2007).
BSA solution
A 250 mg/L BSA solution was prepared with 0.07 M phosphate buffer at pH 6.0.
Particle adsorbents
An ion-exchange Amberlite IRA 410 resin with dp = 4.4x10⁻⁴ m and ρP 1120 kg/m
3
from VETEC (São Paulo, Brazil) was used.
Tracer
Five milliliter of the glucose solution at 5 mg/L was used as the tracer (Fernandez-Lahore et al., 2001). The glucose concentration was determined by the DNS method (Biazus et al., 2005 and 2006; Ferreira et al., 2007; Reguly, 1996; Severo Júnior et al., 2007).
METHODS
Hydrodynamic study
Two g of Amberlite IRA 410 ion-exchange resin was used in all the assays; it gives a bed height of about 4 cm. The fluidizer was fed from the bottom of the column. Liner velocity was between 0.0004 and 0.008 m/s and bed height was measured with the ruler at the side of the column. The Richardson-Zaki index and experimental end velocity (UTExp) were obtained with Equation 5 and the calculated end velocity (UTcalc) was obtained with Equation 3 (Biazus et al., 2006; Chang et al., 1994; Fernadez-Lahore et al., 2001; Santos, 2001; Richardson and Zaki, 1954).
Determination of bed voidage (ε)
Bed voidage was obtained by substitution of data on specific mass (ρP) and mass (mP) of the adsorbent particles, area of the cross section of the column (AT) and bed height (H), using the following Equation:
H
A
m
H
A
V
V
V
T P
P
T P
L P
ρ
ε
=
1
−
=
1
−
=
1
−
(6)where VP is particle volume.
Study of residence time distribution (RTD)
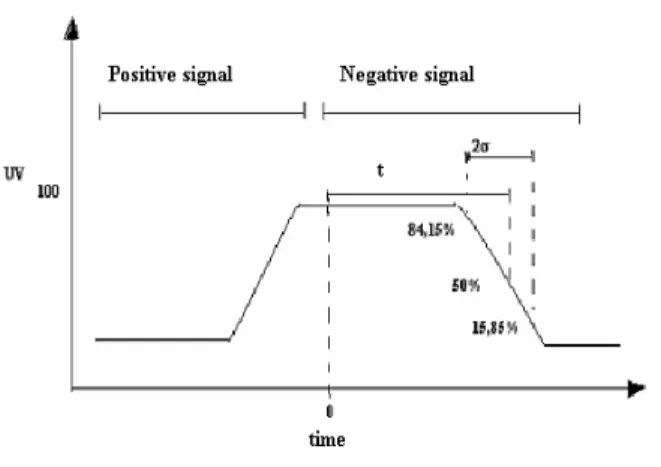
Phosphate buffer (0.07 M, pH 6.0) was used as fluidizer. The particle bed was fluidized until the bed height of the study was achieved (approximately two, three and four times the initial bed height). Five milliliter of the tracer (glucose solution) was injected at the bottom of the column (below the particle bed). At the column outlet samples were collected from time to time. Glucose concentration was measured in all the samples by DNS (Reguly, 1996). The RTD curves were obtained by the pulse method. Figure 2 shows the RTD determination. The mean residence time (t) and the standard deviation (σ) are substituted in to Equation 7 to obtain the theoretical plate number (N) and in Equation 8 to obtain the height equivalent of the theoretical plates (HETP).
2 2
σ
t
N = (7)
H t
HETP 2 *
2
σ
= (8)
Axial dispersion (Daxial) was calculated with Equation 9 as follows:
axial
D H U HETP
ε 2
= (9)
The Pecletl number (Pe) was obtained with Equation 10:
axial
D U H
Pe = * (10)
BSA breakthrough curves
B eq B
eq Q C Q
K Q
1 1 * 1
+
= (11)
where Qeq is the BSA-resin equilibrium binding capacity (mg/g or mg/mL) and QB is the resin maximum binding capacity (mg/g or mg/mL), Ceq
is the equilibrium concentration (mg/L) and K is the dissociation constant (mg/L). Total protein concentration was determined according to the dye binding method of Bradford (1976) with BSA as protein standard.
Figure 2 – Determination of RTD.
RESULTS AND DISCUSSION
Figures 3 and 4, the curves of ln U versus ln ε are shown at 22°C and 28°C, respectively. It could be observed that the multiple correlations were optimal (about 1.0), suggesting that the Richardsson-Zaki equation was the best empirical model for predicting the particles fluidization. There was a reduction in the value of n when salt (phosphate) and biological material (maize malt) were added to the distilled water systems. It was observed that increasing temperature reduced n, which was due to changes in the fluid properties with temperature and with adsorption and diffusion into particle pores in the following order MM > Tp > H2O at a temperature of 22°C±2°C and MM < Tp < H2O at a temperature of
28°C±2°C. For the maize malt (in buffer) system at low bed voidage there was a large effect of friction on degree of expansion for the particle-particle, particle-liquid and particle-biomolecule interactions, which increased in the linear velocity of the fluidizer to maintain the bed voidage at the same level as that in the salt system. For high voidage, there was an inversion of hydrodynamic behavior due to the decrease in the strength of the friction and approach of the linear velocity to the end velocity of the adsorbents particles. The strength for the maize malt fluidizer was higher than the salt fluidizer (Biazus et al., 2006; Dainiak et al., 2002, Fernandez-Lahore et al., 2001; Mullick and Flickinger, 1999; Santos, 2001;
Richardson and Zaki, 1954).
MM
Ln U = 3.1333 Ln ε - 4.5622
R2 = 0.9991
H2O
Ln U = 5,171 Ln ε- 4,4475
R2
= 0,9998
Tp
Ln U = 4.0974 Ln ε - 4.4688
R2 = 0.9992
-8,5 -8 -7,5 -7 -6,5 -6 -5,5 -5 -4,5
-0,7 -0,6 -0,5 -0,4 -0,3 -0,2 -0,1 0
Ln ε
L
n
U
MM Tp H2O Linear (MM) Linear (H2O) Linear (Tp)
MM Ln U = 2.6581 Ln ε - 4.6396
R2 = 0.999
Tp Ln U = 3.988 Ln ε - 4.4139
R2 = 0.9993 H2O
Ln U = 3.8728 Ln ε - 4.2758 R2 = 0.9974
-6,5 -6 -5,5 -5 -4,5 -4
-0,45 -0,4 -0,35 -0,3 -0,25 -0,2 -0,15 -0,1 -0,05 0
Ln ε
L
n
V
MM Tp H20 Linear (MM) Linear (Tp) Linear (H20)
Figure 4 – Richardson-Zaki model at 28°C±2°C.
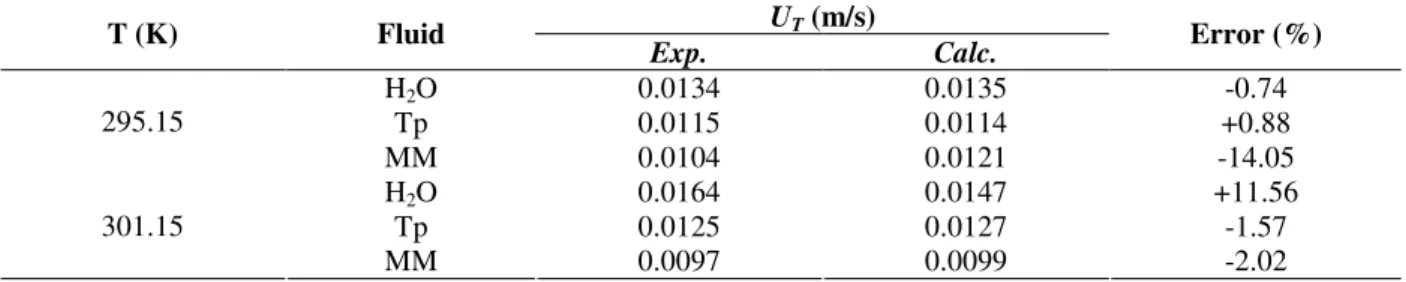
Table 2 shows the experimental (UTExp) and calculated (UTCalc) particle end velocities for the fluidizers and temperatures studied. It was observed that the errors between the velocities were lower and they could be associated with the experimental measurement of viscosity and of specific mass; however, these no reduces the reliability of the data showed in table, for until 25% of error could be commonly accepts in engineering processes. The low errors suggested
that the Richardson-Zaki equation was the best empirical model to predict the hydrodynamic behavior of adsorbent particles in expanded bed systems, even when the fluidizer contained a larger amount of biological material in suspension (Biazus et al., 2006; Santos, 2001). The fluidized particle end velocity decreased as the salt and biological material were added and the specific mass (ρ) and the viscosity (µ) of the fluidizers were higher than those of the water fluidizer.
Table 2 – End velocity of particles.
UT (m/s)
T (K) Fluid
Exp. Calc. Error (%)
H2O 0.0134 0.0135 -0.74
Tp 0.0115 0.0114 +0.88
295.15
MM 0.0104 0.0121 -14.05
H2O 0.0164 0.0147 +11.56
Tp 0.0125 0.0127 -1.57
301.15
MM 0.0097 0.0099 -2.02
Figures 5 and 6 show RTD curves for glucose tracer as it passed into the column bed; which illustrated that the glucose solution could be used as tracer (Biazus et al., 2006; Fernadez-Lahore et al., 2001; Yamamoto et al., 2001).
Table 3 shows RTD results after substitution of the data into Equations 6, 7, 8 and 9 according to the methodology used by Biazus et al. (2006) Fernádez–Lahore et al. (2001), Santos (2001) and Yamamoto et al. (2001). It was observed that the liquid axial dispersion increased with the height and bed voidage, linear velocity and temperature. There was a ten-fold increase when the initial bed height doubled and a 30-fold increase when the initial bed height quadrupled.
This facilitated the flow of biological material into
the particle bed and increased the contact between the biological material and adsorbent particles, so that it was possible to feed the crude material into the fermented tank directly, by there avoiding the fouling and reducing the costs of pretreatment and prepurification, which were the main chromatographic problems (Amersham Pharmacia Biotech, 1997; Roy et al., 1999).
0 0,2 0,4 0,6 0,8 1 1,2
0 100 200 300 400 500
t (s)
C
i
/
C
o
H = 8,5 cm H = 11,6 cm H = 15,4 cm
Figure 5 – RTD curves at 22°C.
0 0,2 0,4 0,6 0,8 1 1,2
0 50 100 150 200 250 300 350 400
t (s)
C
i
/
C
o
H = 7,5 cm H =11,5 cm H = 15,3 cm
Figure 6 – RTD curves at 28°C.
Table 3 – Experimental results of RTD.
Temperature Bed H (cm) є U (m/s) N Daxial (cm
2
/s) Pe
15.4 0.848 0.0058 2.14 2.477 3.628
11.6 0.797 0.0045 2.14 1.536 3.411
Fluidized
8.5 0.724 0.0030 2.14 0.835 3.097
295.15 K
Fixed 4.2 0.440 0.0004 2.14 0.0887 1.885
15.3 0.846 0.0062 2.14 2.623 3.621
11.5 0.795 0.0048 2.14 1.637 3.403
Fluidized
7.5 0.686 0.0027 2.14 0.6891 2.938
301.15 K
Fixed 4.2 0.440 0.0004 2.14 0.1022 1.883
Figure 7 shows the BSA batch adsorption on Amberlite IRA 410 ion-exchange resin at 22°C±2°C. A Langmuir data fitting (R = 0.9985) is shown in Equation 11. The maximum binding capacity (QB) of BSA on Amberlite IRA 410 ion-exchange resin at a bed height of 4.2 cm was 178.6 mg/g resin (108.3 mg/mL resin) and the
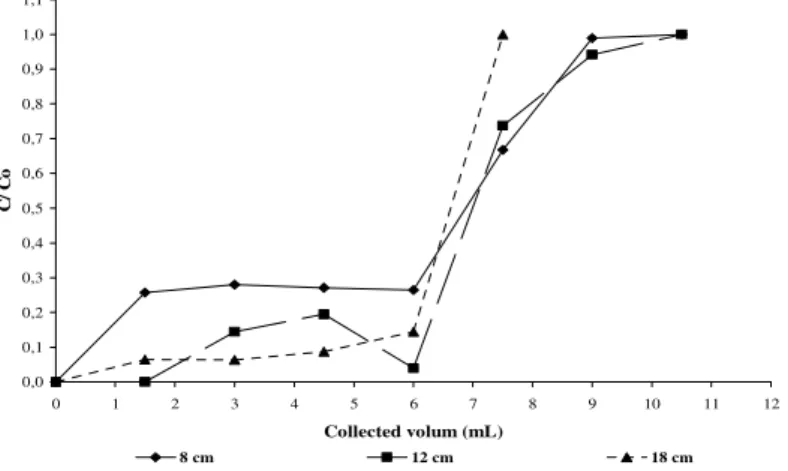
dissociation constant (K) was 0.9107 mg/ L using the Langmuir model. Figure 8 shows the BSA breakthrough curves at the expanded bed height of 8, 12 and 16 cm.
0056 . 0 1 0051 . 0 1
+ =
eq
eq C
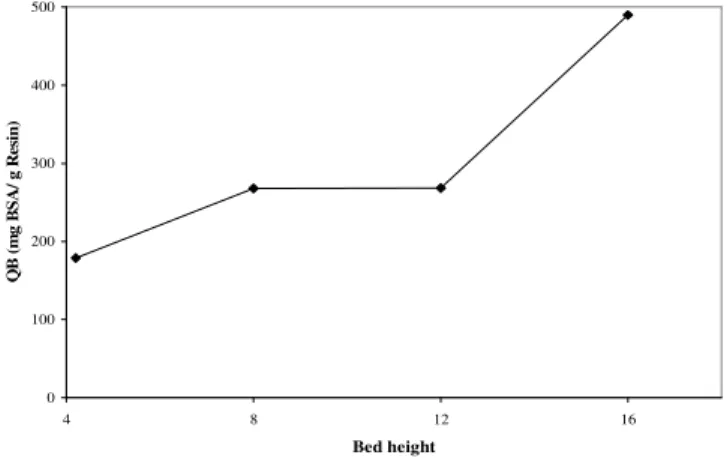
Results on maximum binding capacity and recovery yield changing with the bed height are shown in Table 4. QB and recovery yield increased with the bed height, as reported by Roy et al. (1999), Dainiak et al. (2002) and Lanckriet and Middenberg (2004). The QB found for Amberlite IRA 410 in this work was higher than those for cross-linked PAA-Amberlite IRA 458 and 401
(Dainiak et al., 2002), zirconia adsorbent (Mullick and Flickinger, 1999) and others adsorbents (Amersham Pharmacia Biotech, 1997; Chang et al., 1994; Kalil, 2000; Lanckriet and Middenberg, 2004; Santos, 2001). Increasing residence time by decreasing flow velocity could have a negative effect on the bed stability due to a decrease in the expansion.
0 40 80 120 160 200
0 1 2 3 4 5
Qeq (mg BSA/ g resin)
C
eq
(
m
g
B
S
A
/
L
)
Figure 7 - BSA adsorption isotherm at 22°C±2°C.
0,0 0,1 0,2 0,3 0,4 0,5 0,6 0,7 0,8 0,9 1,0 1,1
0 1 2 3 4 5 6 7 8 9 10 11 12
Collected volum (mL)
C
/
C
o
8 cm 12 cm 18 cm
Figure 8- BSA breakthrough curves at 22°C±2°C.
Table 4 - Effect of bed height on maximum binding capacity and recovery yield.
8 cm 12 cm 16 cm
% yield 42.83 42.93 78.36
QB (mg/g) 267.7 268.3 489.8
QB (mg/mL) 162.3 162.7 297.0
However, it could be possible to decrease the flow velocity without affecting the bed height, since
of this could depend on the resistance to mass transfer in the system. It may be significant for a protein with high molecular weight, especially if the viscosity in the feed is high and slows
molecular diffusion (Amersham Pharmacia Biotech, 1997; Chang et al., 1994). Figure 9 shows the maximum binding capacity changing with the bed height.
0 100 200 300 400 500
4 8 12 16
Bed height
Q
B
(
m
g
B
S
A
/
g
R
es
in
)
Figure 9 - Effect of bed height on BSA breakthrough capacity at 22°C±2°C.
CONCLUSIONS
For a salt-malt system, low bed voidage friction had a large effect on the degree of expansion for the particle, liquid and particle-biomolecule interactions, with the need to increase the linear velocity of the fluid to maintain the bed voidage at the same level as in a salt system. At high voidage, there was an inversion of hydrodynamic behavior due to the decrease in the strength of friction force and linear velocity and that approach of the end velocity the effect was higher for a given mass of salt-malt fluidizer than for the salt fluidizer.
The Richardson and Zack model showed a good fit with the experimental data, with a relative error between 12 and 15%. The RTD showed that HEPT, axial dispersion and the Pecletl number increased with the temperature and bed height, bed voidage and linear velocity. The binding capacity of the resin increased with the bed height. The Amberlite IRA 410 ion-exchange resin showed an affinity for BSA, with a recovery yield of 78.36 % of total protein.
ACKNOWLEDGMENTS
The authors gratefully acknowledge the financial support received from CNPq (Brasilia, Brazil) and FAPESP (São Paulo, Brazil).
RESUMO
No presente trabalho foi estudado o efeito da expansão do leito sobre a adsorção de BSA na resina de troca iônica Amberlite IRA 410. O comportamento hidrodinâmico de uma coluna de adsorção em leito expandido sob efeito da adição de biomoléculas, sal e variação da temperatura também foi estudado para obter as condições ótimas de recuperação da BSA sob a resina de troca iônica. A distribuição do tempo de residência mostrou que a HEPT, a dispersão axial e o número de Pecletl aumentaram com a temperatura, altura do leito, porosidade do leito e velocidade linear. A capacidade de ligação da resina aumentou com a expansão do leito. A resina de troca iônica Amberlite IRA 410 mostrou ter afinidade pela BSA, com uma recuperação de 78,36 % da proteína total.
NOMENCLATURE
AT Area of cross section (m
2
) Calc Calculated data
Ceq Equilibrium concentration (mg/L)
Daxial Axial dispersion (cm
2
/s)
dp Particle diameter (m) Exp Experimental data
g Gravity acceleration (m/s2)
HETP Height equivalent to theoretical plate (cm.)
K Dissociation constant (mg/L)
mp Particle mass (kg)
n Expansion of coefficient (dimensionless)
N Theoretical plates number
Pe Pecletl number (dimensionless)
Qeq Equilibrium BSA capacity (mg/g)
QB Maximum binding capacity (mg/g or mg/mL)
Rep Particles Reynolds number (dimensionless)
Ret Terminal Reynolds (dimensionless)
t Time (s)
U Linear velocity (m/s)
UT End velocity (m/s)
VL Liquid volume (m
3
)
VP Particle volume (m
3
)
Greeks
є Voidage
ρL Specific liquid mass (kg/m
3
)
ρp Specific particle mass (kg/m
3
)
µµµµ Dynamic viscosity (kg/s.m) σ Standard deviation
REFERENCES
Amersham Pharmacia Biotech. (1997), EBA Handbook: Principles and Methods. Uppsala, IBSN 91-630-5519-8, p160.
Biazus, J.P.M.; Severo Jr., J. B.; Santana, J. C. C.; Souza, R. R.; Tambourgi, E.B. (2006), Study of amylases recovery from maize malt by ion-exchange expanded bed chromatography. Process Biochemistry, 41, 1786-1791.
Biazus, J. P. M.: Souza, A. G.; Santana, J. C. C. Souza, R. R.; Tambourgi, E. B. (2005), Optimization of drying process of Zea mays malt to use as alternative source of amylolytics enzymes. Brazilian Archive of Biology and Technology, v.48, Special n.6: 185-190. Bradford, M. M. (1976), A rapid and sensitive method
for the quantitation of microgram quantities of protein. Utilizing the principle of protein-dye binding.
Anal. Biochem. 72, 248-254.
Chang, Y. K.; McCreath, G. E. and Chase, H. A. (1994), Purification of G6PDH from unclarified yeast cell homogenate using expanded bed adsorption (EBA) with STREAMLINETM red H-E7B. In:
Advances in Bioprocess Engineering. E. Galindo and O. T. Ramirez (Eds), Kluver Avademics Publisher, printed in the Netherlands.
Dainiak, M. B.; Galaev, I. Y. and Matiasson, B. (2002), Directed capture of product from fermentation broth using a cell-repelling ion exchanger. Journal of Chromatography A, 942, 123-131.
Ferreira, G. B.; Evangelista, A. F.; Severo Junior, J. B.; Souza, R. R.; Santana, J. C. C.; Tambourgi, E. B.;
Jordão, E. (2007). Partitioning Optimization Of Proteins From Zea Mays Malt In ATPS PEG 6000/CaCl2. Brazilian Archives Of Biology And Technology 50:3, 557-564.
Fernadez-Lahore, H. M.; Lin, D.-Q.; Hubbuch, J. J.; Kula, M.-R. and Thommes, J. (2001), The use of ion-selective electrodes for evaluating residence time distributions in expanded bed adsorption systems. Biotechnology Progress, 17, 1128-1136.
Kalil, S. J. (2000) Produção de inulinase por
Kluyveromyces marxianus e purificação da enzima por cromatografia de troca iônica em coluna de leito expandido. DSc thesis, Campinas, SP, Brazil, School of Food engineering, State University of Campinas, 132p.
Lanckriet, H. and Middelberg, A. P. J. (2004), Continuous chromatographic protein refolding.
Journal of Chromatography A1022, 103-113. Malavasi, U. C. and Malavasi, M. M. (2004),
Dormancy breaking and germination of Enterolobium contortisiliquum (Vell.) morong seed. Brazilian Archives of Biology and Technology, v.47, n.6: 851-854.
Mullick, A. and Flickinger, M. C. (1999), Expanded bed adsorption of human serum albumin from very dense Saccharomyces cerevesiae suspensions on fluoride-modified zirconia. Biotechnology and Bioengineering. 65, n.65, 282-290.
Reguly, J. C. (1996), Biotecnologia dos Processos Fermentativos. vol. 1, Ed. UFPel, Pelotas – RS, 330p. Richardson, J. F. and Zaki, W. N. (1954), Sedimentation and fluidization: Part I. Tran. Inst. Chem. Engs. 32, 35-53.
Roy, I.; Pai, A.; Lali, A. and Gupta, M. N. (1999) Comparison of batch, packed bed and expanded bed purification of A. niger cellulase using cellulose beads. Bioseparation8, 317-326.
Santos, E. S. (2001), Recuperação e purificação de enzimas usando adsorção em leito expandido. DSc thesis, Campinas, SP, Brazil, School of Chemical Engineering, State of University of Campinas, 152p. Severo Júnior, J. B; Oliveira, L. S. O; Sardeiro, F. S.;
Souza, R. R.; Lopes, F. L. G.; Santana, J. C. C.; Tambourgi, E. B. (2007). Response Surface Methodology to Evaluation the Recovery Of Amylases By Hollow Fiber Membrane. Brazilian Archives Of Biology And Technology, 50:4, 713-718. Streeter, V. L. (1977), Mecânica dos fluidos. Celso da
Silva Muniz. et al., trans. São Paulo: Mcgraw Hill, 736p.
Yamamoto, S.; Okamoto, A. and Watler, P. (2001) Effects of adsorbent properties on zone spreading in expanded bed chromatography. Bioseparation 10, 1-6.
![Adsorption in a Fixed-Bed Column and Stability of the Antibiotic Oxytetracycline Supported on Zn(II)-[2-Methylimidazolate] Frameworks in Aqueous Media.](data:image/gif;base64,R0lGODlhAQABAIAAAP///wAAACH5BAEAAAAALAAAAAABAAEAAAICRAEAOw==)