*e-mail: [email protected], [email protected], [email protected], [email protected], [email protected]
Dynamic Isotherms of Dye in Activated Carbon
Gleisy Kelly Lopes Mattaa*, Maria Angélica Simões Dornelas Barrosa*, Rafael Lambrechta*,
Edison Antonio da Silvab*, Oswaldo Curty da Motta Limaa*
a
Depto. de Engenharia Química, Universidade Estadual de Maringá – UEM,
Av. Colombo 5790, Bl. D-90, 97020-900 Maringá - PR, Brazil
b
Depto. de Engenharia Química, Campus de Toledo,
Universidade Estadual do Oeste do Paraná – UNIOESTE,
Toledo - PR, Brazil
Received: February 25, 2008; Received: August 25, 2008
Textile industrial wastewaters have significant quantities of dyes. Adsorption processes using industrials rejects may help in the treatment of these effluents. In this context, uptake of Reactive Blue 5G dye by babassu coconut shell activated carbon was studied with upstream flow fixed-bed experiments. First, the minimum flow rate that minimizes the diffusion effects of 4 mL/min was chosen within the range investigated (2-10 mL/min). Then, the breakthrough curves were obtained for this flow rate for different initial dye concentrations (13.15-102.0 mg/L) and temperature of 30 °C. The mass retained until bed saturation in each experiment was used to obtain the dynamic isotherms, which showed a favorable dye uptake behavior with a maximum adsorption capacity of 12.9 mg.g–1. The irreversible model fitted the experimental data well when compared to Langmuir and Freundlich models. A LDF model simulated the experimental breakthrough curves, and the bed axial dispersion and mass transfer coefficients were estimated.
Keywords: activated carbon, dye, isotherm
1. Introduction
With the urban and mainly the industrial activity growth, envi-ronmental problems have become more frequent and more critical. The textile industries stand out among the industries that produce effluents with high polluting load. In this sector, industrial laundries, which count 1200 installed units in the whole Brazil, play a major role1. The environmental problems caused by laundry effluents are even more serious when the discharge of dyes not fixed or not de-graded by conventional treatment processes is taken into account. It has a potentially high environmental impact in terms of toxicity and interference with photosynthesis in water resources2. Activated carbon adsorption processes are largely used, particularly due to their versatility, efficiency, and low operating costs. Many activated carbon precursors may be obtained from industrial wastes. In Brazil, babassu coconut shell activated carbon is trade rather common.
The objective of the present work was to evaluate the adsorption mechanism of dyes on babassu coconut shell activated carbon granted by Tobasa Bioindustrial de Babassu S.A.
For such, commercial dye Reactive Blue 5G was chosen as an adsorbate because it is the main dye used with jeans-type fabrics. To achieve this goal, the following specific objectives have been set:
•Evaluationoftheoptimalcolumnoperatingconditions; •Isothermplottingandbreakthroughcurvemodeling;and •Evaluationofprocessthermodynamicparameters.
2. Materials and Methods
2.1. Characterization of babassu coconut shell activated
carbon
Samples of the commercial babassu coconut shell activated car-bon was donated by Tobasa Bioindustrial de Babaçu S.A. located in
Tocantinópolis-TO-Brazil. For surface area, pore size, and chemical characterization of babassu coconut shell activated carbon, it was used the N2 adsorption technique at 77 K, zero point charge (ZPC), FTIR
spectroscopy,andscanningelectronmicroscopy(SEM).Adsorbent
particle size was determined by sieving3.
2.2. Dye characterization
The Reactive Blue 5G dye molecule was submitted to semi-empirical calculation (AM1) with GAUSSIAN 03 package at the Chemistry Department of State University of Maringá. The AM1 method is semi-empirical as empirical data (experimental) are in-cluded in this type of calculation besides the integrals generated by the Quantum Mechanics principle.
2.3. Analytical methodology
The dye solutions were prepared from commercial Reactive Blue 5G from Texpal Química. Sample concentrations were determined by UV-Vis spectroscopy in a Shimadzu UV-Visible Spectrophotometer UV - 1601PC apparatus.
2.4. Fixed-bed experiments
The adsorption module consists in a solution container and a deionized water container used to homogenize the bed and stabilize the flow rate. A Cole Parmer peristaltic pump fed the packed bed with internal diameter of 1.01 cm and a thermostatized bath was used to keep the column temperature constant at 30 °C.
to remove any air. Another piece of cotton wool was placed on the column top and it was filled up with glass beads. Next, flow rate and temperature were adjusted and experiments started by closing the water valve and opening the solution valve simultaneously.
Feed solution flowed upwards and samples were collected in pre-defined time intervals until the bed saturation. The analysis of the dye concentration of each sample allowed plotting the breakthrough curves (C/C0 vs. time).
2.5. Optimization of fixed-bed flow rate
The optimal column operating flow rate is that which minimized the diffusion effects. Runs were carried out at 30 °C, CO = 35 mg.L–1, 5.639 g of babassu coconut shell activated carbon (bed height of 15.5 cm). It was investigated the flow rates of de 2.0, 4.0, 6.0, 8.0, and 10.0 mL/min.
Mass transfer parameters: mass transfer zone length (MTZ), operating ratio (Ro), nondimensional variance (σ2) and amount retained up to breakthrough point (qtu) were used in the analysis of the optimal flow rate4.
2.6. Dynamic isotherm plotting
Runs were carried out under optimal operating flow rate with different concentrations in the range 13.15-102.00 mg.L–1 and pH range of 5.5-6.5. Plots of dye retained in the bed up to saturation and the concentration of the feed solution is called dynamic isotherm, as described elsewhere5.
2.7. LDF model proposed by Silva
6The model proposed by Silva6 considers the process isothermal and isobaric with constant porosity and physical properties and negli-gible radial dispersion. The differential mass balance of a component in the fluid phase is given by:
2
2
1 1
b
b
C q C C
Pe
∂ + ρ ∂ = −∂ + ∂
∂i e ∂i ∂x ∂x (1)
with the following initial condition:
( )
,0 0C x =C (2)
and the boundary conditions:
( )
(
,0)
∂ = τ −
∂x
F b
C
Pe C C for x = 0 (3)
0
∂ =
∂x
C
for x = 1 (4)
where:
CF - Feed concentration;
q - Dye concentration in the adsorbent; v - Surface velocity;
Pe
b - Peclet number for the bed (Hv/DL); e- Fraction of bed voids;
Pb - Bed density;
i - Nondimensional time coordinate (tu/H); and x - Nondimensional axial coordinate (H/Ht).
Considering the intraparticle diffusion as the rate controlling step, C = C*, (C* is the concentration on the particle external surface):
*
( )
∂ = − −
∂ C
q
K q q
t (5)
where Kc = Kc inta and:
Kc int - intraparticle mass transfer coefficient; a - transfer area per bed volume unit.
It was used the line method in the solution of the equation model with sub routine DASSL developed for algebraic-differential equa-tion systems (source code in FORTRAN). Thus, the equaequa-tions were described in the form:
(
)
, 1 2
1
, ,..., , nt
k
k i i nt
i dy
A y f y y y
dt = ∑= + for k = 1,...nt (6)
The DASSL code requires a consistent set of values for yk vari-ables and for their respective derivatives in relation to time, dyk/dt. Therefore, it was necessary to modify the representation of concentra-tion at the column inlet by transforming it into a continual funcconcentra-tion by means of the following expression:
( )
0 0 1 0
st F st
C =C −e− +C e− (7)
where s = 1010, CF is the feed dye concentration, C 0
F is the initial
dye concentration in the fluid phase, and τ is the nondimensional time coordinate.
Silva6 recommends that the model parameters, that is, axial disper-sion coefficients (DL) and the mass transfer (Kc), should be estimated from the experimental breakthrough curves and the minimization of the following objective function:
(
)
exp 2 1 n EXP MOD out out iF C C
=
= ∑ − (8)
where: EXP out
C - adsorbate concentration experimentally determined at the column outlet;
MOD out
C - adsorbate concentration determined through the solution of the model at the column outlet;
n_exp - experimental points of the breakthrough curve.
3. Discussion and Results
3.1. Adsorbent characterization
Babassu coconut shell activated carbons was predominantly microporous with micropore area of 1160 m2.g–1 and mean pore diameter of 20.64 nm. ZPC occurs at pH 7.7, a value higher than those of the dye solutions. Therefore, it is believed that adsorption occurs by the attraction of dye anionic groups in relation to the posi-tive surface charge of the solid material with a high percentage of removal of dye7.
The FTIR spectra suggest the presence of hydroxyl groups such as carboxylic groups, C = O bonds (aldehydes, ketones, carboxylic acids), phenols, ethers or lactones, and negligible amounts of nitrate complexes and aromatic ring bonds.
TheSEMmicrographshowninFigure1displayssomelaws
and some apparently cylindrical macropores in the babassu coconut shell activated carbon.
Finally, the mean particle diameter determined by sieving was in the order of 0.56 mm.
3.2. Adsorbate characterization
The longitudinal size of the Reactive Blue 5G dye molecule was obtained with the GAUSSIAN 03 software package, as shown in Figure 2. The mean pore diameter is in the order of 22.35 nm. Therefore, one can suppose that dye adsorption meets significant diffusion resistance.
pore diameter difficult. Alterations in the molecule aggregation state had already been observed for other dyes8.
3.3. Effect of flow rate variation
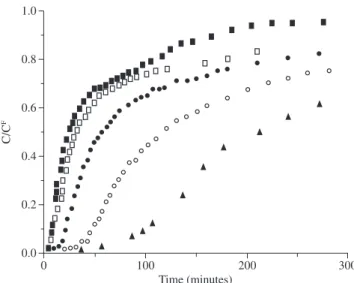
The experimental breakthrough curves obtained by flow rate variation are given in Figure 3.
The saturation of some curves is not given so that their slopes may be evaluated in more detail. The saturation for the flow rate run at 2 mL/min occurred in 22,000 minutes, while for flow rates of 4, 6, 8, and 10 mL/min, saturation occurred in 7,000, 5,300, 2,800, and 1,800 minutes, respectively.
Therefore, the increase in feed flow rate led to a faster saturation of the adsorbent, as expected and in agreement with the results of10,11. Anyway, the saturation time is rather long and a consequence of the diffusion effects.
It is worth pointing out that longitudinal diameter of the dye molecule is in the order of the mean pore diameter, which inhibits transversal diffusion. Diffusion is made easier only when the mol-ecule tries to diffuse through one of the ends, through the activated carbon pores, as the monomer radial diameter is estimated at 9 nm. When dimmers are present, one may suppose that specie may be qualitatively represented by a cylinder with the same longitudinal size (22.35 nm); however, with a diameter two-fold as large, around 18 nm. In this condition, the diffusion and consequently adsorption are even more affected by significant steric effects.
It is also observed that the breakthrough points of each run de-creased with the increase in flow rate. Sometimes, this phenomenon does not occur. In fact, when the adsorbent has pore that cause diffu-sion problems at the very channel opening, the breakthrough points for distinct flow rates are very close to each other12.
More accurate conclusions may be drawn from the mass transfer parameter values given in Table 1. Within the flow rate studied, it is observed that the flow rate of 4 mL/min afforded the lowest MTZ, the largest amount of retained dye up to tu (qtu), the smallest operational ratio, and a high degree of dispersion on the bed. At this flow rate, the diffusion resistance is probably minimized due to the large degree of dispersion of the dye in the column. Thus, the flow rate of 4 mL/min was considered the optimal operating condition for this system and all the other data were obtained at this flow rate.
3.4. Dynamic isotherm
Figure 4 displays the dynamic isotherm. It can be observed a gradual decrease in the retained amount of dye due to progressive
2 m AccV
10.0 kV
Probe 4.0
Mag x6000
WD 16
Det SE
No. 1
Figure 1. Micrograph of babassu coconut shell activated carbon enlarged 6000x.
x5Na SO3H
SO3H
N N NH SO3H HO3S
SO3H
OH NH2
N=N N=N
NH2
N Cl
(a)
(b)
Figure 2. a) Representation of Reactive Blue 5G molecule9, and b)
three-dimensional structure of the dye molecule.
Figure 3. Breakthrough curves for different flow rates using babassu co-conut shell activated carbon with concentration of 35 mg/L (■ 10 mL/min,
□ 8 mL/min, ● 6 mL/min, ○ 4 mL/min, and ▲ 2 mL/min)
Table 1. Mass transfer parameters.
Flow rate (mL/min)
MTZ (cm)
qt u (mg.g–1)
R0 σ2
2 14.35 0.77 0.96 6.38
4 13.94 0.88 0.92 8.6
6 14.21 0.57 0.95 7.6
8 14.43 0.31 0.97 1.98
10 14.07 0.39 0.94 6.43
Time (minutes)
0 100 200 300
C/C
F
1.0
0.8
0.6
0.4
0.2
diffusion effects. As the feed concentration becomes more concen-trated, there is an increase in the dye and thus, the larger the steric effects are. The isotherm was considered irreversible and described as qeq = 11.3014 mg.g–1 for modeling.
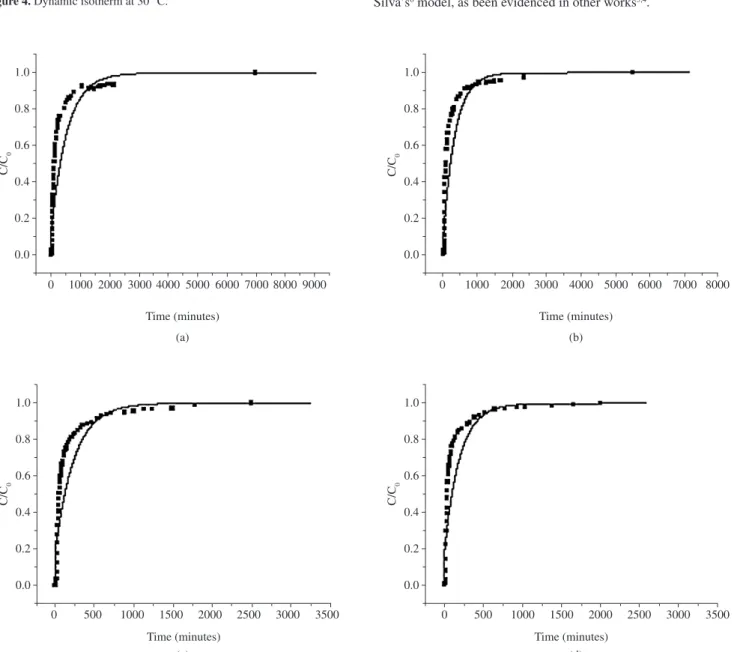
3.5. Fitting of the LDF model proposed by Silva
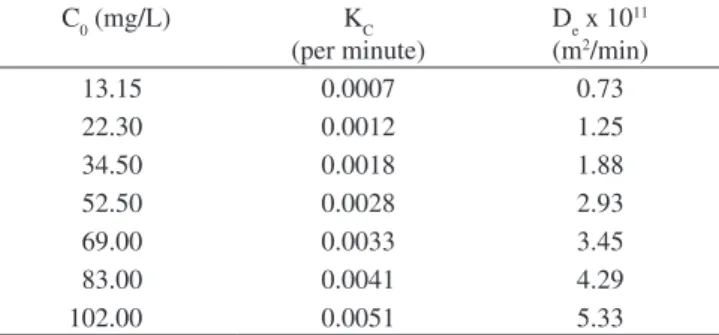
6The breakthrough curves are given in Figure 5. As can be observed, Silva’s6 model fitted well to the breakthrough curve experimental data, confirming the intraparticle as the controlling stage. This model allows estimating the intraparticle mass transfer coefficient (KC) and the bed axial dispersion (DL). These results are given in Table 2.
It can be observed that KC is influenced by the initial concentra-tion, as previously observed by6,12. Possibly, the dye retention process driving force is the increase in the number of molecules in the system, that is, the more concentrated the solution is, apparently, the more strongly the molecules are pushed to the adsorption sites, which favors the adsorption process. DL values are little sensitive under analysis in Silva’s6 model, as been evidenced in other works5,4.
12
10
8
6
4
2
0
0 20 40 60 80 100 C0 (mg.L
–1)
Experimental Irreversible
qeq
(m g.g
–1)
Figure 4. Dynamic isotherm at 30 °C.
Time (minutes)
Time (minutes) Time (minutes)
Time (minutes)
0 1000 2000 3000 4000 5000 6000 7000 8000 0 1000 2000 3000 4000 5000 6000 7000 8000 9000
1.0
0.8
0.6
0.4
0.2
0.0
0 500 1000 1500 2000 2500 3000 3500 0 500 1000 1500 2000 2500 3000 3500
1.0
0.8
0.6
0.4
0.2
0.0 1.0
0.8
0.6
0.4
0.2
0.0 1.0
0.8
0.6
0.4
0.2
0.0
C/C
0
C/C
0
C/C
0
C/C
0
(a) (b)
(c) (d)
Figure 5. Experimental(■) and simulated (─) breakthrough curves for the adsorption of dye on babassu coconut shell activated carbon a) C0 = 34.5 mg/L, b)
Thus, it can be adopted a mean DL.. The mean axial dispersion value of dye Reactive Blue 5G in activated carbon at 30 °C was 0.01057 cm2/min. The K
C parameter sensitivity was analyzed based on the modeling results for the babassu coconut shell activated carbon data. It can be noticed that the mass transfer coefficient is very sensi-tive to the data simulation. Any variation in KC leads to noticeable variations in the breakthrough curve modeling.
4. Conclusions
From the surface characterization results obtained, it can be observed that the babassu coconut shell activated carbon used in this work is predominantly microporous and has a large surface area, with the presence of acidic, carboxylic, lactone, and phenolic groups.
The dye molecule longitudinal size is in the order of 22.35 nm with a diameter of around 9 nm. These characteristics indicate the transversal approximation of the molecule to the activated carbon pores as a result of the high diffusion resistance.
Runs carried out in fixed-bed column to determine the optimal ad-sorption operating conditions demonstrated that flow rate influenced the dye retention process and that, in the investigated conditions, the optimal flow rate was 4 mL/min.
The equilibrium experimental data obtained in the fixed-bed runs showed a decrease in the amount of retained dye, possibly due to a diffusion effect resulting from the increase in the number of dimmers with the feed concentration. However, the isotherm was modeled by the irreversible model satisfactorily.
Silva’s6 model simulated the experimental curves adequately. The mass transfer coefficient was dependent on the concentration, while
the axial dispersion coefficient was little sensitive to these alterations, leading to a mean value of 0.01057 cm2/min.
Acknowledgements
To Tobasa Bioindustrial de Babassu S.A., which granted the activated carbon sample.
ToDQI/UEM,fordyecharacterization. ToCAPES,fortheinancialsupport.
References
1. ABIT – Associação Brasileira da Indústria Têxtil. Available from: www. abit.org.br Acessed in: June, 30th, 2006.
2. Zamora PP, Tiburtius, ERL, Moraes, SG. Degradação enzimática de
corantes. Química Textil. 2000; 68:32-38.
3. LambrechtR,Barros,MASD,CossichES,SilvaEA,MattaGK,Stachiw
R. Adsorption of Reactive Blue 5G dye by activated carbon from babassu shells and pyrolyzed oil shale residue. Adsorption Science and Technology. 2008. in press.
4. PereiraMR,ArroyoPA,BarrosMASD,SanchesVM,SilvaEA,Fonseca
IM, Lovera RG. Chromium adsorption in olive stone activated carbon.
Adsorption. 2006; 12(2):155-162.
5. Schneider RM, Cavalin CF, Barros MASD, Tavares CRG. Adsorption of Chromium ions in activated carbon. Chemical Engineering Journal. 2007; 132(1-3):355-362.
6. SilvaEA,CossichES,TavaresCRG,FilhoLC,GuirardelloR.Modeling
of copper (II) biosorption by marine Sargassum sp. in fixed-bed column.
Process Biochemistry. 2002; 38(5):791-799.
7. Senthilkumaar S, Kalaamani P, Porkodi K, et al. Adsorption of dissolved Reactive red dye from aqueous phase onto activated carbon prepared from agricultural waste. Bioresource Technology. 2006; 97(14):1618-1625. 8. Dakiky M, Nemcova I. Aggregation of o,o’-dihydroxyazo dyes-1.
Concentration, temperature, and solvente effect. Dyes and Pigments. 1999; 40(2-3):141-150.
9. Koprivanac N, Kusic H, Vujevi D, et al. Influence of iron on degradation of organic dyes in corona. J. Haz. Mat. 2005; 117(2-3):113-119. 10. Santhy K, Selvapathy P. Removal of reactive dyes from wastewater by
adsorption on coir pith activated carbon. Bioresource Technology. 2006; 97(11):1329-1336.
11. Chern J, Chien Y. Adsorption of nitrophenol onto activated carbon: isotherms and breakthrough curves. Water Research. 2002; 36(3):647-655.
12.BarrosMASD,ZolaAS,ArroyoPA,Sousa-AguiarEF,TavaresCRG. EquilibriumanddynamicionexchangestudiesofCr3+onzeolitesNaA
and NaX. Acta Scientiarum. 2002; 24(6):1619-1625.
Table 2. Intraparticle mass transfer coefficients for babassu coconut shell activated carbon.
C0 (mg/L) KC
(per minute)
De x 1011 (m2/min)
13.15 0.0007 0.73
22.30 0.0012 1.25
34.50 0.0018 1.88
52.50 0.0028 2.93
69.00 0.0033 3.45
83.00 0.0041 4.29