99
Abstract
The Minas Rio project, owned by Anglo American, has HPGRs in open circuit operated as a tertiary/quaternary crushing stage. Currently this type of equipment is designed from HPGR tests on laboratory scale and pilot scale tests. This paper pres-ents a methodology for simulating HPGR from piston-die tests on laboratory scale and a mathematical model developed in Hacettepe University in Turkey. The parameters determined from the results of the piston-die tests were used to validate the HPGR testing on pilot scale. Finally, the model was used to predict the particle size distribu-tion in the HPGR product on industrial scale.
Keywords: HPGR; modeling; simulation; piston-die; Minas-Rio. Hakan Benzer
Professor
Hacettepe University
Mining Engineering - Mineral Processing Division Hacettepe – Ankara – Turkey
Hakan Dündar Professor
Hacettepe University
Mining Engineering - Mineral Processing Division Hacettepe – Ankara – Turkey
Okay Altun Professor
Hacettepe University
Mining Engineering - Mineral Processing Division Hacettepe – Ankara – Turkey
Luis Marcelo Marques Tavares Professor
Universidade Federal do Rio de Janeiro - UFRJ Engenharia Metalúrgica e de Materiais Rio de Janeiro – Rio de Janeiro – Brasil [email protected]
Malcolm Powell Chair in Comminution
Julius Kruttschnitt Mineral Research Centre Brisbane – Queensland - Australia [email protected]
Douglas Batista Mazzinghy Professor
Universidade Federal de Minas Gerais - UFMG Departamento de Engenharia de Minas Belo Horizonte - Minas Gerais - Brasil [email protected]
José Francisco Cabello Russo Head of Process
Anglo American - Iron Ore Brazil Belo Horizonte - Minas Gerais - Brasil [email protected]
HPGR simulation
from piston-die tests
with an itabirite ore
Mining
Mineração
100
The Minas-Rio Project is under ramp up phase and the project aims to process itabirite ores. Some studies have been performed to verify the response of HPGR with different operating condi-tions and different lithologies of itabirite ores (Ribeiro et al. 2010, Mazzinghy et al. 2013, Russo et al. 2013, Turrer et al.
2013). Minas-Rio has three HPGR in open circuit supplied by ThyssenKrupp. The HPGRs have 2.40 m diameter by 1.65 m length with 4,800 kW installed pow-er (two motors of 2,400 kW ppow-er machine). The motors are equipped with variable speed drives. Anglo American requested the Global Comminution Collaborative (GCC), through the Anglo American Centre for Sus-tainable Comminution, to critically analyze the HPGR circuit design using modeling and simulation tools, with the aim of identify-ing areas where minor modiications in the
operating conditions could lead to improved robustness of the plant and greater ability to meet the design criteria. The idea of the GCC work was to use, whenever possible, the latest available mathematical models of the unit operations in simulating the Minas Rio comminution circuit. As such, it be-came obvious that the commercial mineral processing plant simulators would not be appropriate, due to the unavailability, at the time, of mathematical models of HPGRs that could meet the requirements of the project. Therefore, the simulation platform used was the JKMDK, that is, the Model Developer´s Kit, which was developed at the JKMRC as a tool to aid in developing new mathematical models of unit opera-tions by the center’s researchers as well as partner institutions (Hilden et al. 2013). The simulator combines Microsoft Excel® with a large database of models and a powerful
solver to enable simulation of complex circuit low sheets. Although it lacks the convenient circuit drawing capabilities of commercial mineral processing plant simulators, it has the important advantage of allowing rapid implementation of new or different models.
The population balance model was introduced in 1947 by Epstein (Napier-Munn et al. 1996). The model is based on the production rate of the material within the mill. The process can be described in terms of transport through the mill and break-age within the mill. For a size fraction of i, transport into a breakage zone, breakage and transport out in a continuous milling is represented in Figure 1. A simple mass balance for size fraction of i in product is calculated as follows: particles coarser than
i size are broken into i size fraction; particles in i size fraction are broken into smaller sizes; feed in size i.
Figure 1
Mechanism in population balance model.
The mass balance equation can be written as follows in the Eq. 1.
p
i=
f
i+
ij = 1
a
ijr
js
j- r
is
iWhere pi is the product out size i; fi is the feed in size i; aij is the breakage function (appearance of size i produced by breakage of size j); rj is the breakage rate of size j; sj
is the amount of size j material within the mill; ri is the breakage rate of size i; si is the amount of size i material within the mill. In the population balance model two func-tions are deined; breakage rate function (r) and breakage distribution function (a). The
breakage rate is deined as the disappearing rate of a speciic size after breakage. If the breakage rate of a speciic size is equal to one, all the particles in that size fraction are broken out. If it is zero there is no break-age at that size. The breakbreak-age distribution function deines the size distribution of the product formed after the breakage of the parent size fraction. The product size dis-tribution is a function of the energy applied
on the parent size. The breakage function deines the material characteristics and is determined by laboratory tests. In the population balance model, for a given feed and product size distributions, the break-age rate of the particles is back-calculated using the breakage function of the mate-rial. Unlike the population balance model, in a novel approach, the breakage rate is expressed as follows in the Eq. 2.
where ri is the breakage rate of particles of representative size xi, a is a constant that depends on both the ore and the
machine, and α is a constant, which
depends essentially on the ore charac-teristics. The shape of the breakage rate
is shown in Figure 2 for various a and
α values.
r
i= ax
αi
Figure 2
Variation of the breakage rate with increasing a and α.
(2) (1)
101
As can be seen from Figure 2, breakage rates increase with a while α
determines the slope of the breakage rate and the breakage rate of the particles increase with the size. The parameter
a is mainly dependent on operational
conditions, such as specific grinding force, which is a function of the applied pressure, as well as roll dimensions, and roll speed. The increase in the applied pressure increases the breakage rate of the particles. In log scale the breakage rate shifts parallel upwards. The slope of the breakage rate is thought to be dependent on the size distribution of the particles in the material bed or in feed to the HPGR. In compressed breakage systems, the ine particles assist the breakage of the relatively coarse particles by enhancing the inter-particle breakage in the material bed. Under compression, the applied load
is transferred to the material by means of the surrounding particles whereby the distribution of the particles in the mate-rial bed determines the eficiency of the breakage. In this novel approach, the ef-fect of the size distribution of the material bed is represented with the parameter α. For iner size distributions, the value of α
is increasing, which means that the iner size distribution increases the breakage rate of the coarse particles in itself by making the energy transfer more eficient in the system. To represent the whole feed size distribution with a single number, the speciic surface area is considered. Hence, the theoretical speciic surface area of the material coming into the HPGR is calculated and then correlated with the
parameter α. On the other hand, the
increase in α lowers the breakage rates of the ine particles below 1 mm. When
more ines are added to the system, the ines in the mill content are increased decreasing the breakage rate of the ines, which is deined as tph broken per tonne in the mill. Increasing tonnage into the mill will decrease the breakage rate. After deining the breakage rate in this novel approach, for a given feed and product size distribution, the mill content (s) and breakage function (a) are required. The mill content is deined as the accumula-tion in the mill which is the combinaaccumula-tion of the new feed to the system and partially broken material still within the system. For the HPGR operation, the mill content was considered as the material between the rolls to be crushed. For this purpose, the volume between the rollers, from the nipping gap to the working gap, is calcu-lated geometrically. Figure 3 illustrates the volume between the rolls.
Figure 3 Schematic representation of the volume between the rolls.
As mentioned previously, the param-eter a is a function of the roll speed. In the population balance model, the breakage rate is deined as the amount of the rial broken in tph per tonne of the mate-rial in the mill (tph broken/tonne in the mill). For increased rolls speed, the mill content will be same while the throughput increases. Regarding the above deini-tion of the breakage rate, for the same
mill content, the amount of the broken material increases with the throughput as a result of the roll speed. In this case, only the amount of the broken material increases; the ratio of the broken or un-broken particles within the system is the same with no more ines being generated, i.e. there is no change in the product size distribution. So the increase in breakage rate depending on the roll speed should
be separated from the disappearing rate of the particles. Hence the parameter a is deined to be a function of the roll speed and applied pressure.
The required breakage distribu-tion funcdistribu-tion of the material is deter-mined by lab-scale compressed bed breakage tests. The representation of the compressed bed breakage test is given in Figure 4.
Figure 4 Representation of the particle bed compression.
In this test, narrow-sized fractions of the material to be tested are prepared. Then they are compressed for different pressure levels. From the force-displace-ment graph, the corresponding energy
levels are calculated. The size distribu-tions of the compressed materials are determined by sieve analysis. Then the relationship between the energy level and the product size distribution is obtained.
102
2. Material and method
Samples containing about 50 kg of itabirites ores were received at Laboratório de Tecnologia Mineral (LTM) da Univer-sidade Federal do Rio de Janeiro (UFRJ) for testing. Sample preparation included
crushing and then screening into a num-ber of narrow-size classes, ranging from 11.2-9.5 mm to 0.85-0.60 mm. Tests then consisted of pressing, at different pressures using a hydraulic press, as shown in the
Figure 5, each of the samples contained in narrow-size classes, and recording the re-sulting force-deformation proile in order to assess the amenability of the samples to compressive crushing.
Figure 5
Piston-die system
used in the compression tests.
The piston-die tests were carried out for 5 size fractions (mm) -11.2 +9.5, -6.7 +5.6, -3.35 +2.8, -2.0 +1.7, -0.85 +0.60 and each fraction was tested consider-ing 4 different pressures (kN) 50, 100, 500, 1000. The calculated energy values together with the size distributions were used to calculate: the material hardness parameter; the material softness
parame-ter (for HPGR model); and the appearance function (for HPGR model). The studies were performed in two stages:
i. In order to validate the model structure of the Hacettepe Model, the pilot plant data gathered from open circuited HPGR, having dimensions of 0.8x0.25m, was used. The studies showed that the model developed by Hacettepe
Univer-sity (HU) could make a close estimation, regarding to the product size distribution of Itabirite ore, under speciied operating parameters.
ii. Once the model was itted, the HPGR commissioned at Minas Rio was simulated and product size distribution, operating pressure, and operating gap parameters were determined.
3. Results and discussion
3.1 Piston-die tests
Particle size distributions of each of the test studies were determined by sieve
analysis. Figures 6 to 10 illustrate the size distribution curves for itabirite ore. It is
evident that the product becomes iner as the force applied on the material increases.
Figure 6
Particle size distributions obtained from piston-die tests
103
Figure 7 Particle size distributions obtained from piston-die tests carried out with -6.7+5.6 mm fraction.
Figure 8 Particle size distributions obtained from piston-die tests carried out with -3.35+2.8 mm fraction.
Figure 9 Particle size distributions obtained from piston-die tests carried out with -2.0+1.7 mm fraction.
104
3.2 Parameter estimation
The parameters for material hardness, material softness and
ap-pearance function have been used to characterize breakage on the basis of
the modelling approach used by HU (Dundar et al. 2013).
3.2.1 Material hardness parameter
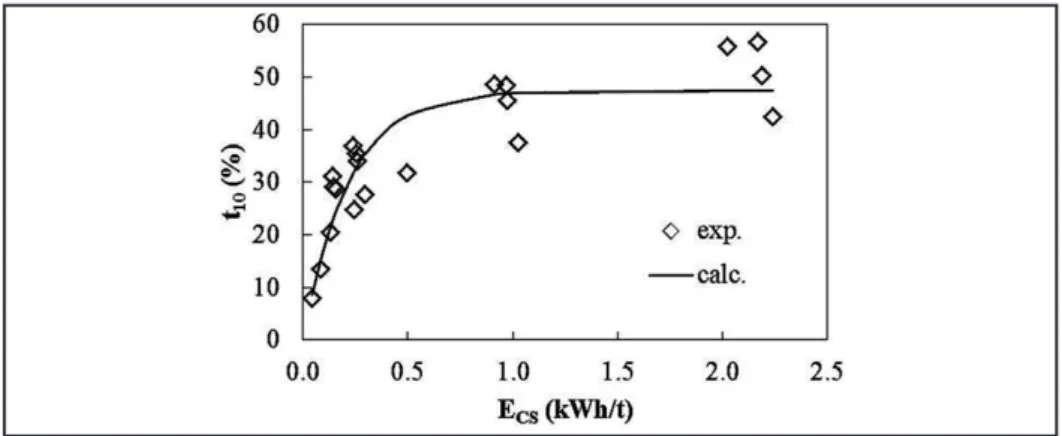
Figure 11 was obtained by plotting the speciic comminution energy (Ecs) against t10 values, which are deined asthe percent passing from one tenth of the original mean particle size. The spe-ciic comminution energy parameter was
calculated by dividing the energy found from the force-displacement graph and the sample mass.
Figure 11
ECS-t10 relationships of itabirite ore.
ECS-t10 data of itabirite ore were
itted to the breakage model using Eq.
3 in order to back calculate Apd and bpd model parameters:
t
10=
A
pd( 1 - exp ( -
b
pdE
cs) )
(3)(4)
where Apd and bpd are parameters that characterize the amenability of the ore
to compression breakage (Dundar et
al. 2013). In analogy to the
impact-breakage test (Napier-Munn et al.
1996), the product Apd*bpd values may be used as an indicator of ore hardness, so that the higher the Apd*bpd, the softer the material. Evidently, the Apd*bpd values ob-tained from this test cannot be directly
compared to the A*b obtained from
Drop Weight Tests, given the different particle sizes and stressing conditions. Calculated parameters are present in Table 1.
Apd bpd Hardness
(Apd*bpd) B c
Softness index (B*c)
48.2 5.09 245.0 0.92 16.50 15.2 Table 1
Piston-die material parameters.
3.2.2 Material softness parameter
The data obtained from the piston-die tests is also used in calculating thema-terial softness parameter put into HPGR model which is estimated by plotting the
disappearing rate of a given size fraction with Ecs, as shown in the Figure 12.
Figure 12
Disappearing rate
(Wbroken/Winitial) for itabirite ore.
The data is itted to Eq. 4, where parameters b and c were calculated and shown in Table 1.
= B
(1 - exp (
- cEcs
) )
w
brokenw
initial105
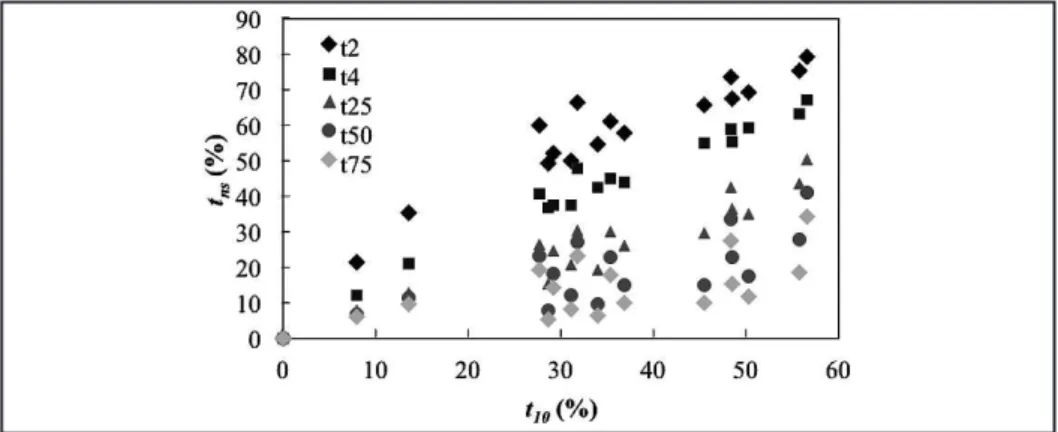
3.2.3 Appearance function
In order to calculate the appear-ance function of the ores, t-family curves are graphed. The t-family curve is drawn by plotting t2, t4, t10, t25, t50 and
t75 values against t10 which is deined as the percentage passing from one tenth of the original mean particle size and
t2, t4, t10, t25, t50 and t75 are the percentage
passing from 1/2, 1/4, 1/25, 1/50, 1/75 of the original mean particle size. Figure 13 shows the t-family curves determined for itabirite ore.
Figure 13 t-family curves of itabitire ore.
From the t10 versus tn values and considering an arbitrary value of
2 kWh/t for the comminution energy
Ecs, the appearance function for the
itabirate ore was estimated, being given by Figure 14.
Figure 14 Breakage distribution function.
In summary, as a result of the com-pressed bed breakage tests, the material
hardness, the material softness and the ap-pearance function parameters were
estimat-ed, showing that the itabirate ore presented marginally lower resistance to breakage.
3.3 Model fitting with HPGR pilot-scale tests
The open circuit HPGR grindingtest works for the itabirite ore was it-ted to the Hacettepe HPGR model. The
HPGR presented dimensions of 0.8 m roll diameter and 0.25 m width. The surface of rolls was lined with a Stud-Plus® liner. The
test program for the itabirite ore involved four single pass tests at different speciic pressures as show in Table 2.
Table 2 Test conditions and results.
Variable
Test
1 2 3 4
Roll speed (RPM) 19.1 19.1 19.1 9.5
Zero gap (mm) 10 10 10 10
Specific pressure
(N/mm2) 2.8 4.7 5.4 4.8
Throughput (t/h) 71 69 71 36
Net specific
power (kWh/t) 0.8 1.5 1.6 1.8
106
were inputted to the open circuit HPGR simulator and the product size distribu-tions were itted. In order to validate
the Hacettepe HPGR Model structure, the itted size distributions were then compared with the measured ones
(pilot-scale tests). This is shown in Figure 15, which demonstrates the good agreement between them.
Figure 15
Fitted and measured product size distributions from pilot-scale tests on the itabirite iron ore in four different pressures.
3.4 Simulation of HPGR at Minas Rio
In general, the ratio of cake thickness (GAP) to roll diameter is between 2-3%. Moreover, the largest particle nipped be-tween the rolls in the compression zone would be about 1.5 times the gap. Larger particles would cause the rolls to separate and the compression zone to collapse,re-ducing grinding eficiency. For Minas Rio HPGR, the largest particle to be nipped is calculated as 75 mm. However, -25 mm material from the secondary crushing circuit will be fed to the HPGR, which is regarded as very ine. It is foreseen that for the itabirite ore, the HPGR of Minas
Rio will reach 3,240 t/h of throughput operating at a GAP of 65 mm, roll speed of 2.4 m/s and 80 bar of pressure to obtain the product size distribution illustrated in Figure 16. This will feed the primary ball mill circuit, comprised of ball mills operat-ing in closed circuit with hydrocyclones.
Figure 16
Product size distribution predicted from simulation
studies on the industrial-scale HPGRs.
4. Conclusions
The mathematical model for the HPGR, developed by Hacettepe Univer-sity researchers (Dundar et al. 2013), was itted with pilot-scale data for itabirate ore.
The information obtained through the piston-die tests was used to determine the material hardness and softness parameter and the appearance function. Simulations
were conducted to predict the particle size distribution in the HPGR product in industrial scale using the parameters determined from laboratory tests.
Acknowledgements
Iron Ore Brazil would like to thank Anglo American Centre for Sustainable
Comminution and Global Comminution Collaborative (GCC) for the support in
107
References
DUNDAR, H., BENZER, H., AYDOGAN, N. Application of population balance model to HPGR crushing, Minerals Engineering, v. 50-51, p. 114-120, 2013. HILDEN, M., STANGE, W., POWELL, M.S., ANDRUSIEWICZ, M. The future
de-velopments in circuit simulation capability at the JKMRC, In: EUROPEAN
SYM-POSIUM ON COMMINUTION AND CLASSIFICATION, 13. Proceedings...,
Braunschweig, Germany, v. 1, p. 411-414, 2013.
MAZZINGHY, D.B., RUSSO, J.F.C., TAVARES, L.M. The investigation of commi-nution of itabirite iron ores using a pilot-scale HPGR. In: EUROPEAN
SYMPO-SIUM ON COMMINUTION & CLASSIFICATION, 13. Proceedings...,
Brauns-chweig, Germany, v. 1, p. 47-50, 2013.
NAPIER-MUNN, T.J., MORRELL, S., MORRISON, R.D., KOJOVIC, T. Mineral
comminution circuits: their operation and optimisation. Australia: Julius Krutts-chnitt Mineral Research Center, 1996. 413p.
RIBEIRO, F.S., RUSSO, J.F.C., COSTA, T. Aplicação de prensas de rolos em minério de ferro (High pressure grinding rolls for iron ore), REM - Revista Escola de Mi-nas, v. 63, p. 399-404, 2010.
RUSSO, J.C., MAZZINGHY, D.B., TURRER, H.D.G. Testes de prensa de rolos em escala-piloto com itabiritos friável e compacto (HPGR pilot test with friable and
compact itabirites ores). In: ABM INTERNATIONAL CONGRESS, 68.
Procee-dings..., Belo Horizonte, v. 3, p. 4009-4017, 2013.
TURRER, H.D.G., SAWASATO, E.Y., GUIMARÃES, F.R., MAGALHÃES, C.R., DIAS, G.S., RUSSO, J.F.C., MAZZINGHY, D.B. Avaliação do consumo energé-tico na moagem de dois diferentes tipos litológicos do depósito da Serra do Sapo (Energy consumption of two diferentes lithology’s of serra do Sapo deposit). In:
IRONMAKING AND RAW MATERIALS SEMINAR, 43. Proceedings..., Belo
Horizonte, v. 3, p. 278-286, 2013.