* Study conducted at the Hospital do Servidor Público Estadual – HSPE, Hospital for State Civil Servants – São Paulo (SP) Brazil. 1. Director of the Service of Pulmonology Department, Hospital do Servidor Público Estadual – HSPE – São Paulo (SP) Brazil. 2. Biochemist. Sanatorinhos Clinical Laboratory, São Paulo (SP) Brazil.
3. Head of the Pulmonary Function Department. Hospital do Servidor Público Estadual – HSPE, Hospital for State Civil Servants – São Paulo (SP) Brazil. Correspondence to: Carlos Alberto de Castro Pereira. Av. Irai, 393, conj. 34, Moema, CEP 04082-001, São Paulo, SP, Brasil.
Tel 55 11 5543-8070. Fax 55 11 5044-8716. E-mail: [email protected] Submitted: 15 August 2006. Accepted, after review: 17 October 2006.
New reference values for forced spirometry in white adults in Brazil*
Carlos Alberto de Castro Pereira1, Taeko Sato2, Sílvia Carla Rodrigues3Abstract
Objective: To describe spirometric reference equations for healthy Brazilian adults who have never smoked and to compare the predicted values with those derived in 1992. Methods: Reference equations for spirometry were derived in 270 men and 373 women living in eight cities in Brazil. Ages ranged from 20 to 85 years in women and from 26 to 86 years in men. Spirometry examinations followed the recommendations of the Brazilian Thoracic Society. Lower limits were derived by the analysis of the fifth percentiles of the residuals.
Results: Forced vital capacity (FVC), forced expiratory volume in one second (FEV1), FEV1/FVC and FEV1/forced expiratory volume in six seconds (FEV6) were best fitted by linear regression. Flows were best fitted using log equations. For both genders, greater height resulted
in lower values for FEV1/FVC, FEV1/FEV6 and flow/FVC ratios. The reference values for FEV1 and FVC in the present study were higher than those derived for Brazilian adults in 1992. Conclusion: New predicted values for forced spirometry were obtained in a sample of white Brazilians. The values are greater than those obtained in 1992, probably due to technical factors.
Inclusion and exclusion criteria
Volunteers presenting for the test, their companions or passersby were selected for the reference sample. The individuals were selected after responding to a questionnaire based on that of the American Thoracic Society/Division of Lung Diseases.(6)
Inclusion criteria were as follows:
• Not presenting respiratory symptoms;
• Not having had influenza or any pulmonary
disease in the past seven days;
• Having no history of respiratory condi -tions that could result in dysfunction, such as tuberculosis or asthma, or of having undergone thoracic surgery. Asthma was char-acterized as two or more wheezing episodes relieved by bronchodilators at any time in life. Individuals with history of pneumonia were not excluded;
• Not having presented physician-diagnosed
heart disease at any time in life. Hypertensive individuals were not excluded. Blood pressure was not measured, and the presence or absence of hypertension was only self-reported by the interviewees;
• Not having worked in environments with a
high concentration of dust for one year or more, which would be a risk factor; and
• Not being a lifetime nonsmoker. Women who
cooked with wood stoves, as well as individuals exposed to cigarette smoke in their bedroom were excluded.
Males over 25 years of age and females over 20 were included in the study.(4) Race was
character-ized by the interviewer. Black individuals (including mulattos) were excluded because their values were demonstrated to be significantly different from those obtained for white individuals. Asian indi-viduals or indiindi-viduals born in other countries were also excluded.
Measurements
Weight and height were measured with the indi -viduals wearing light clothing and barefoot. The age considered was that of the last birthday. Individuals underwent the spirometric test in the sitting posi-tion, wearing a nose clip. Three fixed techniques validated by SBPT or by the authors were used for the tests. The tests were performed with Multispiro
Introduction
Many pulmonary function laboratories use predictive values without knowing or understanding their derivations and limitations, or by selecting what seems to be the best set of equations. Several equations for reference values have been published in recent decades. Values derived from these equa-tions for a given combination of age and height vary considerably, especially among different popu-lations.(1-3) In addition, predictive values change over
time in a determined population.
In Brazil, spirometric reference values in the adult population were obtained for white individ-uals in 1992.(4) Predicted values for volume-time
curves were obtained using bellows spirometers. In the past years, flow spirometers have become highly accurate and are currently the most widely used. A new parameter for the detection of airflow obstruc-tion, the ratio between forced expired volume in one second and forced expired volume in six seconds (FEV1/FEV6), has been suggested.
(5) There
are no reference values available for this ratio in Brazilians.
The objectives of the present study were to derive reference values for several parameters of the forced expiratory curve, including instantaneous flows and the FEV1/FEV6 ratio, and to compare the current predicted values for forced vital capacity (FVC) and FEV1 with those derived in 1992.
(4)
Methods
Population
Once acceptability and reproducibility criteria were met, the highest FVC, FEV1 and PEF values
were recorded. Flows were derived from the
maneu-vers with the highest sums of FVC and FEV1.
Curves with evidence of resistance and zero errors were excluded.(8) Calibrations prior to each
work period were performed with 3-L syringes. All tests were reviewed after the three best curves had been printed.
Strategy for data analysis
The SPSS-10 software package was used for the analysis of results, according to the following steps:
• Verification of distribution of functional and
anthropometric variables and of discrepant values. Individuals with morbid obesity, that is, body mass index (BMI, weight/height2)
≥40 kg/m2, individuals with BMI < 18 kg/m2,
as well as those with a discrepant FVC/height2
ratio were excluded;
• Univariate regression analysis testing the corre -lation coefficients of functional parameters with the anthropometric variables and their spirometers (Creative Biomedics, San Clemente, CA,
USA).
Criteria for curve acceptability were those proposed by SBPT(7).
During the FVC maneuvers, real-time graphs of the flow-volume and volume-time curves were provided, with a signal indicating acceptance of end-of-test criteria. In the equipment used, the tests automatically superimpose, which makes it easier to determine their reproducibility.
Once the acceptability criteria had been met, the curves were classified according to their reproduc-ibility as:
• Quality A – maximum differences < 150 mL
for FVC and FEV1 in the two best curves, and
< 10% for peak expiratory flow (PEF). A total of 572 tests (89%) achieved quality A; and
• Quality B – maximum differences < 200 mL
for FVC and FEV1 in the two best curves, and
< 15% for peak expiratory flow (PEF). Tests exceeding these limits were excluded. No difference was found for predicted FVC and FEV1 between quality A and B tests, when adjusted for age and height using the analysis of covariance.
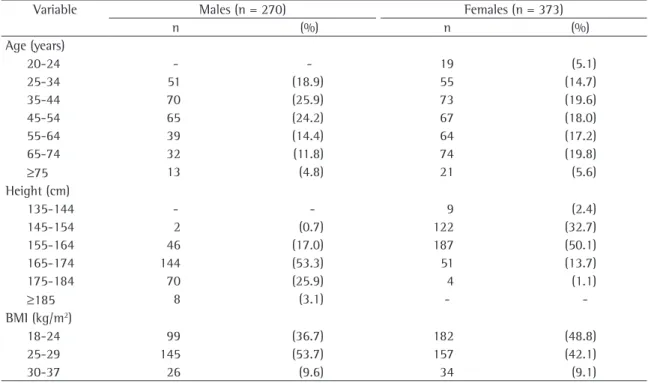
Table 1 - Distribution of the male and female reference populations by height, body mass index and age range.
Variable Males (n = 270) Females (n = 373)
n (%) n (%)
Age (years)
20-24 - - 19 (5.1)
25-34 51 (18.9) 55 (14.7)
35-44 70 (25.9) 73 (19.6)
45-54 65 (24.2) 67 (18.0)
55-64 39 (14.4) 64 (17.2)
65-74 32 (11.8) 74 (19.8)
≥75 13 (4.8) 21 (5.6)
Height (cm)
135-144 - - 9 (2.4)
145-154 2 (0.7) 122 (32.7)
155-164 46 (17.0) 187 (50.1)
165-174 144 (53.3) 51 (13.7)
175-184 70 (25.9) 4 (1.1)
≥185 8 (3.1) -
-BMI (kg/m2)
18-24 99 (36.7) 182 (48.8)
25-29 145 (53.7) 157 (42.1)
30-37 26 (9.6) 34 (9.1)
analyzed using analysis of covariance, taking into account gender, age, height and weight.
The level of significance was set at p < 0.05.
Results
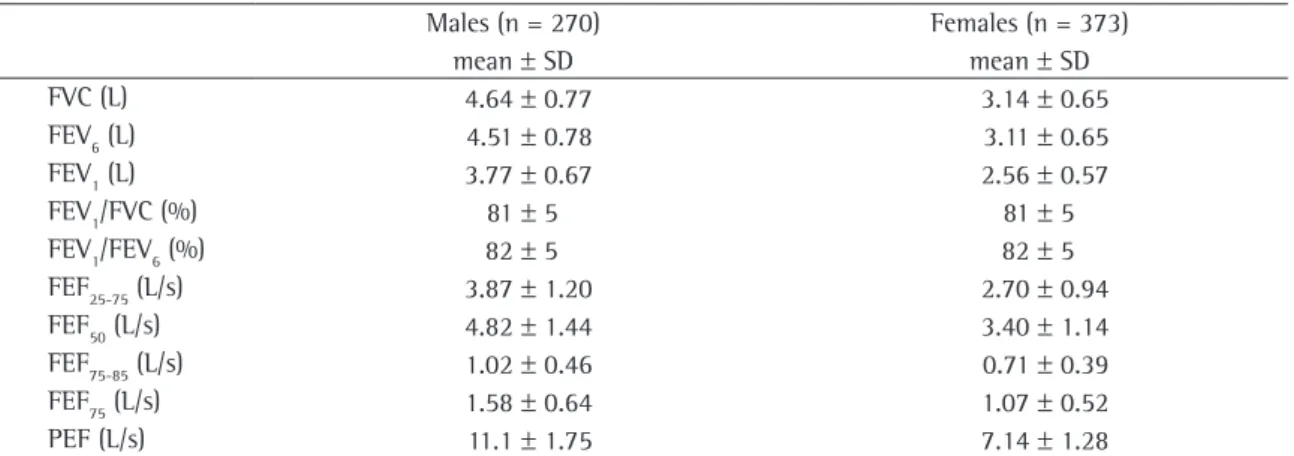
A total of 643 white individuals were included in the final analysis. Of those, 373 were females and 270 were males. Distribution of anthropometric data is shown in Table 1. The mean values and disper-sion of mean values for spirometric data are shown in Table 2.
Approximately 9% of individuals of both genders were obese. Exertional dyspnea, altitude of the places where the tests were performed and previous pneumonia did not influence FVC and FEV1 values. Hypertensive individuals had lower values of FVC (150 mL on average, p = 0.003) and
FEV1 (90 mL, p = 0.034) in comparison with
nonhy-pertensive individuals, regardless of weight (analysis of covariance).
The values of FEV1, FVC and FEV6, as well as their relationships, were best fitted by linear equa-tions, whereas flows and their relationships with FVC were best fitted by logarithmic equations. Prediction equations are shown in Table 3 for males and in Table 4 for females. Several findings
are noteworthy. Weight influenced predicted FVC,
FEV1 and FEV6 values in males, but not in females.
Predicted values with and without the addition of weight to the equations in males are shown in Table 3. Height negatively influenced predicted transformations. Variables presenting p < 0.10
were selected for inclusion in the multivariate analysis;
• Discrepant values obtained after calcula -tion of regression equa-tions were detected by standard residuals above 3.3 or below
−3.3 standard deviations and by analysis of
Mahalanobis distance.(9) To evaluate the
influ-ence of discrepant results on regression model results, Cook’s distance for the residuals was analyzed. Cases with values above 1 were excluded(9);
• After the multiple regression equations had
been determined, the residuals were evaluated and their adherence to the normal curve was graphically verified.
The residuals were plotted against each of the independent variables and against the expected values using the regression equa-tion. If the model is correct, the distribution of residuals should be uniform around the horizontal axis and should not show any pattern.(10) Finally, we determined whether the
residuals are constant across age and height ranges; and
• The lower limits of regressions were calculated
using the 5th percentile of the residual(3).
Predicted FEV1 and FVC values obtained in the
present study were compared to those published in 1992 for the Brazilian population.(4)
The influence that some of the variables
evalu-ated in the questionnaire had on FVC and FEV1 was
Table 2 - Principal spirometric data of the reference sample.
Males (n = 270) Females (n = 373)
mean ± SD mean ± SD
FVC (L) 4.64 ± 0.77 3.14 ± 0.65
FEV6 (L) 4.51 ± 0.78 3.11 ± 0.65
FEV1 (L) 3.77 ± 0.67 2.56 ± 0.57
FEV1/FVC (%) 81 ± 5 81 ± 5
FEV1/FEV6 (%) 82 ± 5 82 ± 5
FEF25-75 (L/s) 3.87 ± 1.20 2.70 ± 0.94
FEF50 (L/s) 4.82 ± 1.44 3.40 ± 1.14
FEF75-85 (L/s) 1.02 ± 0.46 0.71 ± 0.39
FEF75 (L/s) 1.58 ± 0.64 1.07 ± 0.52
PEF (L/s) 11.1 ± 1.75 7.14 ± 1.28
SD: standard deviation; FEV6: forced expiratory volume in six seconds; FEV1: forced expiratory volume in one second; FEF25-75%:
forced expiratory flow between 25 and 75%; FEF50%: forced expiratory flow at 50%; FEF75-85%: forced expiratory flow between 75 and
value in both genders. The lower limit of 70% is, on average, reached at 65 years of age for males and at 70 years of age for females.
The comparison between the predicted FVC and FEV1 values derived in 1992 and the current
values is shown in Figure 1. The current equation resulted in values systematically higher for FVC and FEV1 in both genders (paired t-test p < 0.01).
For males, the mean differences for FVC and FEV1
were 0.26 ± 0.11 L and 0.21 ± 0.17 L, respectively,
compared with 0.12 ± 0.04 L and 0.086 ± 0.024 L,
respectively, for females.
Discussion
In the present study, new reference values for forced spirometry in white adults were derived for values for the FEV1/FVC, FEV1/FEV6 and flows/FVC
ratios in both genders.
Values of coefficients of determination (r2) were
generally higher in females; coefficients of
determi-nation were higher for FVC and FEV1 in comparison
to those obtained for expiratory flows. As regards age, FEV1, on average, drops 26 mL/year in males and 20 mL/year in females. The lower limits of mid- and end-expiratory flow parameters and their relationships with FVC are typically approximately 50 to 60%. End-expiratory flows (forced expiratory flow at 75% and forced expiratory flow between
75 and 85%) presented higher r2 values in
compar-ison with the flows derived from the middle of the expiratory curve.
As a general rule, the lower limit for FEV1/CVF ratio can be set by subtracting 8 from the predicted
Predicted FVC 1992 (L) 1.5
1.5 2.0 2.0
2.5 2.5
3.0 3.0
3.5 3.5
4.0 4.0
4.5 4.5
5.0 5.0
Predicted FVC 2006 (L) Predicted FEV 2006 (L)
1.0 1.0 1.5
1.5 2.0
2.0 2.5
2.5 3.0
3.0 3.5
3.5 4.0
4.0 Predicted FEV 1992 (L)
Predicted FEV 1992 (L)
Predicted FEV 2006 (L)
2.0 2.0 2.5
2.5 3.0
3.0 1.5
3.5
3.5 4.0
4.0 4.5
4.5 5.0
5.0 5.5
Predicted FVC 2006 (L)
Predicted FVC 1992 (L) 2.5
2.5 3.0
3.0 3.5
3.5 4.0
4.0 4.5
4.5 5.0
5.0 5.5
5.5 6.0
6.0 6.5
6.5
validated epidemiological respiratory questionnaire should be administered. In addition, the way in which the chosen test is performed and analyzed should be described in detail.(13)
Optimal samples are composed of individuals randomly chosen from the general population. The fact that volunteers were enrolled in the present study might have introduced a selection bias. Since the program was widely advertised in advance, individuals from different social classes and from distant locales reported for tests. In addition, many individuals included were companions or occasional passersby. As long as the conditions mentioned above are met, the use of volunteers is a valid means of setting reference values.(13)
Anthropometric variables
Reference values should not be extrapolated for ages and heights other than those included in the the Brazilian population. These values were
signifi-cantly higher than those published 14 years ago for both genders.
General considerations
The reference values published for pulmonary function vary widely.(1-3). The comparison of a small
number of normal individuals to find an approxi-mate equation can be misleading.(11,12)
Reference values are obtained from a population sample. Five variables must be considered: sample selection; anthropometric variables; diverse vari-ables; test selection/measurement instrument; and regression models.
Sample selection
For derivation of reference values for pulmonary function, only nonsmokers with no
cardiorespira-tory symptoms or diseases should be included.(6) A
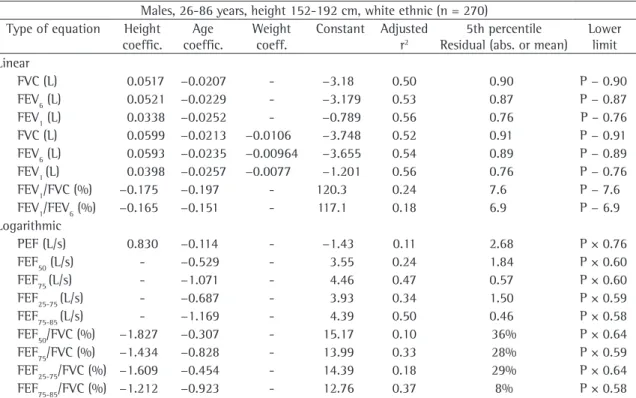
Table 3 - Regression equations, coefficient of determination (r2) and lower limits for spirometric variables in the male
reference population.
Males, 26-86 years, height 152-192 cm, white ethnic (n = 270) Type of equation Height
coeffic.
Age coeffic.
Weight
coeff.
Constant Adjusted r2
5th percentile Residual (abs. or mean)
Lower limit Linear
FVC (L) 0.0517 −0.0207 - −3.18 0.50 0.90 P − 0.90
FEV6 (L) 0.0521 −0.0229 - −3.179 0.53 0.87 P − 0.87
FEV1 (L) 0.0338 −0.0252 - −0.789 0.56 0.76 P – 0.76
FVC (L) 0.0599 −0.0213 −0.0106 −3.748 0.52 0.91 P − 0.91
FEV6 (L) 0.0593 −0.0235 −0.00964 −3.655 0.54 0.89 P − 0.89
FEV1 (L) 0.0398 −0.0257 −0.0077 −1.201 0.56 0.76 P − 0.76
FEV1/FVC (%) −0.175 −0.197 - 120.3 0.24 7.6 P − 7.6
FEV1/FEV6 (%) −0.165 −0.151 - 117.1 0.18 6.9 P − 6.9
Logarithmic
PEF (L/s) 0.830 −0.114 - −1.43 0.11 2.68 P × 0.76
FEF50 (L/s) - −0.529 - 3.55 0.24 1.84 P × 0.60
FEF75 (L/s) - −1.071 - 4.46 0.47 0.57 P × 0.60
FEF25-75 (L/s) - −0.687 - 3.93 0.34 1.50 P × 0.59
FEF75-85 (L/s) - −1.169 - 4.39 0.50 0.46 P × 0.58
FEF50/FVC (%) −1.827 −0.307 - 15.17 0.10 36% P × 0.64
FEF75/FVC (%) −1.434 −0.828 - 13.99 0.33 28% P × 0.59
FEF25-75/FVC (%) −1.609 −0.454 - 14.39 0.18 29% P × 0.64
FEF75-85/FVC (%) −1.212 −0.923 - 12.76 0.37 8% P × 0.58
Linear equations: Height × coefficient – age × coefficient – weight × coefficient ± constant, Example: FVC = height × 0.0599
–age × 0.0213 – weight × 0.0106 - 3.748; Logarithmic equations: natural log (log height × coefficient – log age × coefficient± constant), Example:
PEF = 2.7183(log n height × 0.83 - log n age × 0.114 – 1.432); FVC: forced vital capacity; FEV
6: forced expiratory volume in six seconds; FEV1: forced
expiratory volume in one second; FEF25-75%: forced expiratory flow between 25 and 75%; FEF75-85: forced expiratory flow between
75 and 85% of FVC; PEF: peak expiratory flow; FEF50%: forced expiratory flow at 50% of FVC; FEF75%: expiratory flow after 75% of
which more significantly affects the ventilatory capacity,(20) and a peripheral pattern in females.
One recent study(21) showed that abdominal fat can
negatively influence pulmonary function even in individuals who are only overweight (not classified as obese). The importance of weight influence on FVC in males can be demonstrated by deriving predicted
values for BMI values of 20 and 30 kg/m2 in a male
individual with a height and mean age similar to those observed in the present study. A 0.30-L reduc-tion in FVC is expected in individuals with a BMI of
30 kg/m2 in comparison to individuals with a BMI
of 20 kg/m2.
Diverse variables
Lower values of FVC and FEV1 in hypertensive individuals regardless of their body weight was a
new finding. One small study(22) showed lower FVC
and FEV1 values in untreated hypertensive
individ-uals in comparison to a control group, and this was attributed to a diastolic dysfunction. Further studies should consider the possible influence of hyperten-sion on spirometry.
regression equations.(7) Individuals of both genders
and with height and age greater than those of the individuals studied in 1992 were included in the present study.(4) It is well known that there is a trend
toward greater height and greater life expectancy among Brazilians.(14,15)
The prevalence of obesity in Brazil is approxi-mately 10% and is higher among females.(16) The
effect of obesity on spirometry and pulmonary volumes is influenced by the degree of obesity, age, and type of fat distribution.(17) Morbid obesity has an
evident effect on ventilatory function,(18) and weight
loss results in increased FVC(19) in obese individuals,
which is why such individuals were excluded. The effect that obesity other than morbid obesity has on spirometry is controversial.(17) Weight can influence
FVC values by means of opposite effects - because of increased muscularity, with FVC elevation, and because of obesity, with reduced pulmonary
venti-lation. In the present study, reduced FVC and FEV1
were found in males as weight increased. This was not observed in females. The difference between genders might be attributable to the different obesity patterns - an abdominal pattern in males,
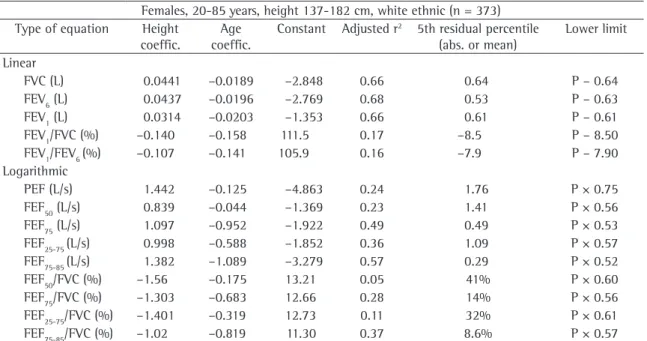
Table 4 - Regression equations, coefficient of determination (r) and lower limits for spirometric variables in the female reference population.
Females, 20-85 years, height 137-182 cm, white ethnic (n = 373) Type of equation Height
coeffic.
Age coeffic.
Constant Adjusted r2 5th residual percentile
(abs. or mean)
Lower limit Linear
FVC (L) 0.0441 –0.0189 –2.848 0.66 0.64 P – 0.64
FEV6 (L) 0.0437 –0.0196 –2.769 0.68 0.53 P – 0.63
FEV1 (L) 0.0314 –0.0203 –1.353 0.66 0.61 P – 0.61
FEV1/FVC (%) –0.140 –0.158 111.5 0.17 –8.5 P – 8.50
FEV1/FEV6 (%) –0.107 –0.141 105.9 0.16 –7.9 P – 7.90
Logarithmic
PEF (L/s) 1.442 –0.125 –4.863 0.24 1.76 P × 0.75
FEF50 (L/s) 0.839 –0.044 –1.369 0.23 1.41 P × 0.56
FEF75 (L/s) 1.097 –0.952 –1.922 0.49 0.49 P × 0.53
FEF25-75 (L/s) 0.998 –0.588 –1.852 0.36 1.09 P × 0.57
FEF75-85 (L/s) 1.382 –1.089 –3.279 0.57 0.29 P × 0.52
FEF50/FVC (%) –1.56 –0.175 13.21 0.05 41% P × 0.60
FEF75/FVC (%) –1.303 –0.683 12.66 0.28 14% P × 0.56
FEF25-75/FVC (%) –1.401 –0.319 12.73 0.11 32% P × 0.61
FEF75-85/FVC (%) –1.02 –0.819 11.30 0.37 8.6% P × 0.57
FVC: forced vital capacity; FEV6: forced expiratory volume in six seconds; FEV1: forced expiratory volume in one second; FEF25-75%:
forced expiratory flow between 25 and 75%; FEF75-85: forced expiratory flow between 75 and 85% of FVC; PEF: Peak Expiratory Flow;
FEF50%: forced expiratory flow at 50% of FVC; FEF75%: expiratory flow after 75% of exhalation of FVC; and P: Predicted. Note: for
effect of greater height can be distinguished from the presence of an occasional obstructive disease.
As observed in Tables 3 and 4, end flows and their relationship with FVC had coefficients of determination well above those observed for flows derived from the middle of the expiratory curve. Further studies are necessary in order to compare the relative value of mid- and end-expiratory flows in the diagnosis of airflow limitation.
Regression models
The choice of the best regression model should follow several steps, and linear equations should be preferred whenever the adjustment is similar to other models, because of their simplicity. If func-tional decline increases with age, linear models can overestimate the predicted values in younger indi-viduals as well as in the elderly. However, derivation of predicted values from the general equation in certain age ranges did not show significant errors. As in the 1992 study,(4) flow equations followed a
logarithmic curve. Due to the acceleration of func-tional loss with aging, some authors include a quadratic term for age.(25) However, this resulted in
very low predictive values in advanced ages and in inhomogeneous distribution of residuals around the regression curve.
Comparison with the 1992 equation
Functional values change with time as a result of changes in environmental and nutritional condi-tions and because of technological advances in equipment and higher accuracy in measurements (cohort effect). Reference values should be periodi-cally obtained. Otherwise, a loss of sensitivity in the detection of abnormal conditions will occur. Values
of FVC and FEV1 were higher than those observed
14 years prior.(4) Cohort effects, however, do not fully
explain these findings. Due to the cohort effect,(28)
FVC and FEV1 can increase up to 5 mL/year, and the
difference observed for FVC between the previous and the current study was three times greater in males.
Differences in measurement instruments and in populations contribute to the variation in pulmo-nary function. However it is difficult to quantify each of these factors. Subject selection and the epidemiological questionnaire administered were similar in both studies. In the previous study, a
Measurement instrument and test selection
The tests were performed with a flow spirom-eter that meets the requirements of the American Thoracic Society for precision and accuracy. However, this does not ensure exact tests. Two errors in particular should be observed(8): the zero error and
the resistance error. Flow spirometers need to be zeroed prior to each exhalation. During zeroing, the pressure drop corresponding to the absence of flow is set, thus determining the intercept of the calibra-tion curve that relates flow to the pressure drop. Errors occur when the transducer or the electronic sign measures a false value for the pressure gradient in the absence of flow. As a result, the calibration curve is displaced, so that all flows and volumes will be falsely elevated. This error results in a continuous FVC increase, even if exhalation ends. These curves were excluded.
Debris, condensed water vapor or mucus deposi-tion on the sensor can increase the pressure gradient and result in high flows and volumes after integra-tion (resistance error). Tests with peak flows above 14 L/s in males and 11 L/s in females were excluded, as were those in which the spirometer-measured PEF exceeded the 95% limit of the regression plotted against the values obtained with a portable meter.
The American Thoracic Society and the European Respiratory Society do not recommend the use of peak flow as a criterion of reproducibility of spirometric curves.(23) However, submaximal effort
(resulting in lower PEF values) can increase FEV1 due to lower airway compression(24). In this study,
we also observed that a late PEF (beyond 0.5 s) can result in higher FVC. The two best curves should differ by < 15% for PEF. Absolute differences between the highest PEF values should not be used for exclusion or inclusion of curves.(25)
Although FEV1/FVC ratio values < 70% are used to characterize COPD,(26) a single value is
inappro-priate, since the lower limit varies with age. A fixed cut-off point results in overdiagnosis in the elderly and underdiagnosis of COPD in middle-aged indi-viduals, in whom early diagnosis is essential.(27)
Taller individuals can present falsely reduced FEV1/FVC ratio values due to enhanced expiratory muscle force generation and subsequent airway compression.(7) The finding of a negative correlation
between height and FEV1/FVC and flows/FVC ratios
8. Townsend MC, Hankinson JL, Lindesmith LA, Slivka WA,
Stiver G, Ayres GT. Is my lung function really that good? Flow-type spirometer problems that elevate test results. Chest. 2004;125(5):1902-9.
9. Pallant J. Multiple regression. In: Pallant J. SPSS. Survival
manual. 2º ed. Berkshire: Open University Press; 2005.
p. 140-59.
10. Campbell MJ. Multiple regression. In: Campbell MJ. Statistics
at Square Two: Understanding modern statistical applications
in medicine. London: Blackwell Publishing; 2004. p.16-23 11. Dias RM. Análise das equações para previsão de valores
espirográficos normais. J Pneumol. 1990;16(4):206-11.
12. Ladosky W, Andrade RT, Loureiro NG, Gandar JMB, Botelho
MM. Comparação entre valores espirométricos de referência obtidos a partir de equações de Knudson e de Pereira - Adultos. J Pneumol. 2001;27(6):315-20
13. Grasbeck R. The evolution of the reference value concept. Clin Chem Lab Med. 2004;42(7):692-7.
14. IBGE – Instituto Brasileiro de Geografia e Estatistica [Homepage on the Internet]. Brasília: Ministério do Planejamento, Orçamento e Gestão. [cited 2006 Aug 15]. Pesquisa de orçamento familiares 2002-2003 - microdados-segunda divulgação. Available from: www.ibge.gov.br 15. IBGE – Instituto Brasileiro de Geografia e Estatistica
[Homepage on the Internet]. Brasília: Ministério do Planejamento, Orçamento e Gestão. [cited 2006 Aug 15]. Tábuas completas de mortalidade-2003. Available from: www.ibge.gov.br
16. Batista Filho M, Rissin A. Nutritional transition in Brazil: geographic and temporal trends. Cad Saude Publica. 2003;19(Suppl 1):S181-91
17. Koenig SM. Pulmonary complications of obesity. Am J Med Sci. 2001;321(4):249-79.
18. Ladosky W, Botelho MA, Albuquerque JP. Chest mechanics
in morbidly obese non-hypoventilated patients. Respir Med. 2001;95(4):281-6
19. Wadstrom C, Muller-Suur R, Backman L. Influence of excessive
weight loss on respiratory function. A study of obese patients following gastroplasty. Eur J Surg. 1991;157(5):341-6
20. Lazarus R, Sparrow D, Weiss ST. Effects of obesity and fat
distribution on ventilatory function: the normative aging study. Chest. 1997;111(4):891-8
21. Ochs-Balcom HM, Grant BJ, Muti P, Sempos CT, Freudenheim JL, Trevisan M, et al. Pulmonary function and abdominal adiposity in the general population. Chest. 2006;129(4):853-62.
22. Guven A, Koksal N, Sokmen G, Ozdemir R. Comparison of the echocardiographic and pulmonary function test findings in orderly treated and untreated essential hypertensive patients. Blood Press. 2003;12(5-6):319-25
23. Miller MR, Hankinson J, Brusasco V, Burgos F, Casaburi R, Coates R, et al. Standardisation of spirometry. Eur Respir J. 2005; 26(2): 319-38
24. Krowka MJ, Enright PL, Rodarte J, Hyatt RE. Effect of effort on measurement of forced expiratory volume in one second. Am Rev Respir Dis. 1987;136(4):829-33.
25. Bravo de Souza R, Martins AC, Azevedo KRS, Pereira VMF. Avaliação de critérios de rejeição de curvas de capacidade vital forçada. J Pneumol 2002; 28 (supl 2):11-12.
26. Pauwels RA, Buist AS, Calverley PM, Jenkins CR, Hurd SS; GOLD Scientific Committee. Global strategy for the diagnosis, management, and prevention of chronic obstructive
pulmonary disease: NHLBI/WHO Global Initiative for Chronic vertical bellows spirometer was used, and in the
current study, a flow spirometer. Vertical bellows spirometers can be affected by gravity. Bellows compliance is temperature dependent, which can
affect accuracy and precision. With multiple exhala -tions into the bellows, the pleats can become moist and sticky, so that they do not open uniformly, and this can result in nonlinearity. Old bellows can tear along the pleats, and this can go unnoticed in a 3-L syringe test.(29) Among the various types of
spirometers, vertical bellows spirometers present the greatest resistance at low flows.
Spirometers have gone through significant changes in recent years. Immediate information on acceptability and reproducibility criteria makes the technician demand optimal efforts and, there-fore, obtain maximum values. It is no wonder that current values exceed those obtained 14 years ago
with bellows spirometers. The FVC and FEV1 values
were proportionally higher, and the FEV1/FVC ratio
remained unchanged. Some authors(30) have found
that the values obtained with vertical bellows spirometers are lower than those obtained with other spirometers.
In conclusion, new predicted spirometry values were obtained in a broad sample of the Brazilian population. These values were higher than those published in 1992, which likely results from tech-nical factors. Values for the FEV1/FEV6 ratio and for instantaneous flows are now also available.
References
1. Roca J, Burgos F, Sunyer J, Saez M, Chinn S, Antó JM, et al. References values for forced spirometry. Group of the European Community Respiratory Health Survey. Eur Respir J. 1998;11(6):1354-62.
2. Baur X, Isringhausen-Bley S, Degens P. Comparison of lung-function reference values. Int Arch Occup Environ Health. 1999;72(2):69-83.
3. Lung function testing: selection of reference values and interpretative strategies. American Thoracic Society. Am Rev Respir Dis. 1991;144(5):1202-18.
4. Pereira CAC, Barreto SP, Simões JG, Pereira FWL, Gerstler
JG, Nakatani J. Valores de referência para espirometria em uma amostra da população brasileira adulta. J Pneumol. 1992;18(1):10-22.
5. Hankinson JL, Odencrantz JR, Fedan KB. Spirometric reference
values from a sample of the general U.S. population. Am J
Respir Crit Care Med. 1999;159(1):179-87.
6. Ferris BG. Epidemiology Standardization Project
(American Thoracic Society). Am Rev Respir Dis. 1978;118(6 Pt 2):1-120.
function in a 24-year longitudinal study. Am J Epidemiol. 1995;141(6):554-66.
29. Branson R. Flow and Volume Measuring Devices. In: Branson RD, Hess DR, Chatburn RL, editors. Respiratory Care
Equipment. Philadelphia: Lippincott Williams & Wilkins; 1998. p. 283-303.
30. Louw SJ, Goldin JG, Joubert G. Spirometry of healthy adult South African men. Part I. Normative values. S Afr Med J. 1996;86(7):814-9
Obstructive Lung Disease (GOLD) Workshop summary. Am J
Respir Crit Care Med. 2001;163(5):1256-76
27. Hardie JA, Buist AS, Vollmer WM, Ellingsen I, Bakke
PS, Mørkve O, et al. Risk of over-diagnosis of COPD in asymptomatic elderly never-smokers. Eur Respir J. 2002;20 (5):1117-22