S
trong evidence suggests that in classic trigeminal neuralgia (TN) caused by neurovascular compres-sion (NVC), the neuralgia is related to morphologi-cal and structural changes in the trigeminal nerve (TGN) that are probably the result of chronic vascular compres-sion. Morphological changes in the nerve include nerve deviation, distortion, groove formation, and atrophy.5At-rophy of the nerve is seen in most cases of TN20 and is
probably attributable to structural abnormalities such as axonal loss and demyelination,4,10,12,18 but these
morpho-logical changes are dificult to describe objectively.
Atrophic changes in the trigeminal nerves of patients with
trigeminal neuralgia due to neurovascular compression and their
association with the severity of compression and clinical outcomes
Clinical article
Paulo RobeRto laceRda leal, M.d., M.Sc.,1,5 chaRlotte baRbieR, M.d.,2
MaRc heRMieR, M.d., Ph.d.,3 Miguel angelo Souza, M.d., Ph.d.,4
geRaRdo cRiStino-Filho, M.d., Ph.d.,5and MaRc Sindou, M.d., Ph.d.1
Departments of 1Neurosurgery and 3Neuroradiology, University of Lyon 1, Lyon; 2Department of Neuroradiology,
University of Caen, France; 4Department of Clinical Medicine of the Faculty of Medicine of Fortaleza, Federal
University of Ceara, Fortaleza; and 5Department of Neurosurgery of the Faculty of Medicine of Sobral, Federal
University Ceara, Sobral, Brazil
Object. The aim of this study was to prospectively evaluate atrophic changes in trigeminal nerves (TGNs) using measure-ments of volume (V) and cross-sectional area (CSA) from high-resolution 3-T MR images obtained in patients with unilateral trigeminal neuralgia (TN), and to correlate these data with patient and neurovascular compression (NVC) characteristics and with clinical outcomes.
Methods. Anatomical TGN parameters (V and CSA) were obtained in 50 patients (30 women and 20 men; mean age 56.42 years, range 22–79 years) with classic TN before treatment with microvascular decompression (MVD). Parameters were com-pared between the symptomatic (ipsilateralTN) and asymptomatic (contralateralTN) sides of the face. Twenty normal control
subjects were also included. Two independent observers blinded to the side of pain separately analyzed the images. Measure -ments of V (from the pons to the entrance of the nerve into Meckel’s cave) and CSA (at 5 mm from the entry of the TGN into
the pons) for each TGN were performed using imaging software and axial and coronal projections, respectively. These data were
correlated with patient characteristics (age, duration of symptoms before MVD, side of pain, sex, and area of pain distribution), NVC characteristics (type of vessel involved in NVC, location of compression along the nerve, site of compression around the circumference of the root, and degree of compression), and clinical outcomes at the 2-year follow-up after surgery. Comparisons
were made using Bonferroni’s test. Interobserver variability was assessed using the Pearson correlation coeficient.
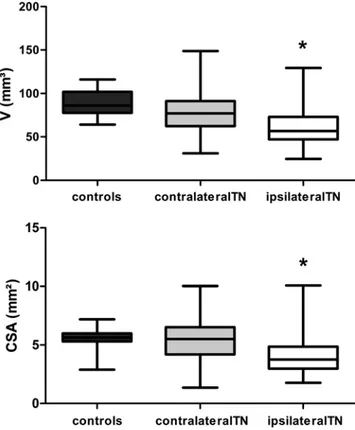
Results. The mean V of the TGN on the ipsilateralTN (60.35 ± 21.74 mm3) was signiicantly smaller (p < 0.05) than those for the contralateralTN and controls (78.62 ± 24.62 mm3 and 89.09 ± 14.72 mm3, respectively). The mean CSA of the TGN on the ipsilateralTN (4.17 ± 1.74 mm2) was signiicantly smaller than those for the contralateralTN and controls (5.41 ± 1.89 mm2 and 5.64 ± 0.85 mm2, respectively). The ipsilateralTN with NVC Grade III (marked indentation) had a signiicantly smaller mean V
than the ipsilateralTN with NVC Grade I (mere contact), although it was not signiicantly smaller than that of the ipsilateralTN with NVC Grade II (displacement or distortion of root). The ipsilateralTN with NVC Grade III had a signiicantly smaller mean CSA than the ipsilateralTN with NVC Grades I and II (p < 0.05). The TGN on the ipsilateralTN in cured patients had a smaller mean CSA than that on the ipsilateralTN of patients with partial pain relief or treatment failure (p < 0.05). The same inding was
almost found in relation to measurements of V, but the p value was slightly higher at 0.05.
Conclusions. Results showed that TGN atrophy in patients with TN can be demonstrated by high-resolution imaging. These
data suggest that atrophic changes in TGNs, which signiicantly correlated with the severity of compression and clinical out -comes, may help to predict long-term prognosis after vascular decompression.
(http://thejns.org/doi/abs/10.3171/2014.2.JNS131288)
Key WoRdS • trigeminal neuralgia • neurovascular compression • pain •
three-dimensional imaging • microvascular decompression • volume • cross-sectional area
Abbreviations used in this paper: AICA = anterior inferior cer-ebellar artery; BA = basilar artery; contralateralTN = side of face unaffected by TN; CSA = cross-sectional area; DRIVE = driven equilibrium; INF = inferior; ipsilateralTN = side of face affected by
TN; JP = juxtapetrous segment; MC = midcisternal; MPR = multi -planar reformation; MVD = microvascular decompression; NVC = neurovascular compression; SCA = superior cerebellar artery; SL = superolateral; SM = superomedial; SPV = superior petrosal vein; TGN = trigeminal nerve; TN = trigeminal neuralgia; TOF-MRA = time-of-flight MR angiography; TPV = transverse pontine vein;
Recently, some authors5,11,13 showed that in patients
with TN, the affected TGN has a smaller volume (V) and cross-sectional area (CSA) than the unaffected nerve. Some works have established the notion that the outcome of mi-crovascular decompression (MVD) depends on the sever-ity of the NVC.1,2,21 According to our data, when clear-cut
and marked vascular compression was present at surgery, the long-term cure rate was 90% after a 15-year follow-up. Conversely, when the vessel was merely in contact with the root—that is, without any visible root displacement or indentation—the long-term success rate was only 60%,21
suggesting that in cases with low-grade compression other factors could play a role in the genesis of neuralgia.
As we found that the severity of NVC affected the pre-diction of MVD outcome, we decided to conduct a study correlating severity of NVC with the morphological mark-ers of damage to the nerve, that is, V and CSA. In this prospective controlled study, the V and CSA of the TGN were measured in 50 patients with classic TN who under-went MVD and were compared with a group of 20 nor-mal control subjects. Measurements were performed using high-resolution 3-T MRI. The anatomical TGN parameters were correlated with patient and NVC characteristics and with clinical outcomes at the 2-year follow-up after sur-gery. Particular emphasis was placed on the severity of compression, considered an important prognostic factor of long-term cure after MVD, which was determined based on observations made during surgery.
Methods
Inclusion Criteria
Consecutive patients were enrolled in the study from November 2008 to January 2010. In each patient, clas-sic primary TN refractory to medical treatment had been diagnosed according to the International Classiication of Headache Disorders criteria (2nd edition).9 Key study
inclusion criteria were classic primary TN and high-res-olution imaging to exclude secondary causes of TN. Key exclusion criteria were a precarious general health sta-tus, a percutaneous lesioning procedure or other surgical treatments received prior to the MVD surgery, or metal implants. All patients underwent follow-up in our depart-ment for 2 years after surgery to evaluate the effective-ness of pure MVD. Normal subjects, that is, persons who had no history of headaches or facial pain, were selected for inclusion in the control group.
The study was conducted in accordance with Interna-tional Conference on Harmonisation guidelines, French Code of Federal Regulations requirements related to the protection of human subjects, and investigational device exemptions. All participants provided written informed consent.
Demographic Data
Fifty patients undergoing MVD for classic primary TN were included in the study. Patient characteristics are shown in Table 1. There were 30 females and 20 males, ranging in age from 22 to 79 years (mean 56.42 years). Twenty-nine patients had pain on the right side and 21
on the left. The V1 division was affected in 30% of the patients, V2 in 72%, and V3 in 60%, with the majority of patients having more than one division involved. The average duration of pain before surgery was 54.02 months (range 6–168 months). To ensure the validity of the study, 20 normal control subjects (11 females and 9 males), with ages ranging from 20 to 69 years, were also included in the study. There was no statistically signiicant difference in age between patients and normal controls (p > 0.05).
Imaging Examinations
Patients and normal subjects underwent MRI ex -amination using a 3-T MR scanner (Philips Achieva). Images were obtained using an 8-channel head coil with sensitivity encoding and parallel processing capabilities. In all patients, the 3 following high-resolution sequences were performed in combination: 3D driven equilibrium (DRIVE) MRI, 3D time-of-light magnetic resonance angiography (TOF-MRA), and 3D T1-weighted Gd-en-hanced (T1-Gd). In previously published works, this com-bination allowed for the identiication and characteriza -tion of NVC with optimal sensitivity and speciicity.14–16
Three-dimensional T2-weighted MRI allows ine anatomical analysis of the pontocerebellar cistern struc-tures with good contrast between CSF and vasculonervous structures. In the present study, 3D T2-weighted MRI was performed using a 3D DRIVE sequence with the following parameters: TR 11.28 msec, TE 5.64 msec, lip angle 50°, matrix 512 × 512, FOV 153 × 170 mm, slab thickness 24 mm, and bandwidth 130 Hz per pixel, which gave a section thickness of 0.5 mm and a voxel size of 0.125 mm3 (0.5 ×
0.5 × 0.5 mm3) and an acquisition time of 4 minutes, 57
seconds. After data acquisition was completed on each of the 60 sections, coronal and sagittal reformatted images were obtained using a multiplanar reformation (MPR) al-gorithm. For the interpretation of MRI, all images angled parallel and perpendicular to the TGN were reviewed.
The 3D TOF-MRA sequence, which is the best se-quence for depicting arteries, was performed with the fol-lowing parameters: TR 33 msec, TE 2.4 msec, lip angle 25°, matrix 512 × 512, FOV 250 × 250 mm, and slice thickness 1 mm, producing 120 sections and a voxel size of 0.125 mm3 (0.5 × 0.5 × 0.5 mm3). An acquisition time
of 7 minutes 31 seconds was required. A presaturation pulse was added to the cranial side parallel to the slab, but a magnetization transfer pulse was not used. The acquisi -tion slab was oriented transversely to cover the posterior fossa. Coronal and sagittal reformatted images and two other reformatted images parallel and perpendicular to the TGN were obtained using an MPR algorithm. For the interpretation of MR images, both the original transverse and the 4 reformatted images were reviewed.
Finally, 3D T1-Gd, which shows both arteries and veins in hypersignal, was obtained with 2 acquired sig-nals. The T1-weighted MR images were acquired with the following parameters: TR 33 msec, TE 2.4 msec, FOV 230 × 230 mm, matrix 512 × 512 mm, a section thickness of 0.5 mm, and a voxel size of 0.125 mm3 (0.5 × 0.5 × 0.5
mm3). The acquisition slab was oriented transversely to
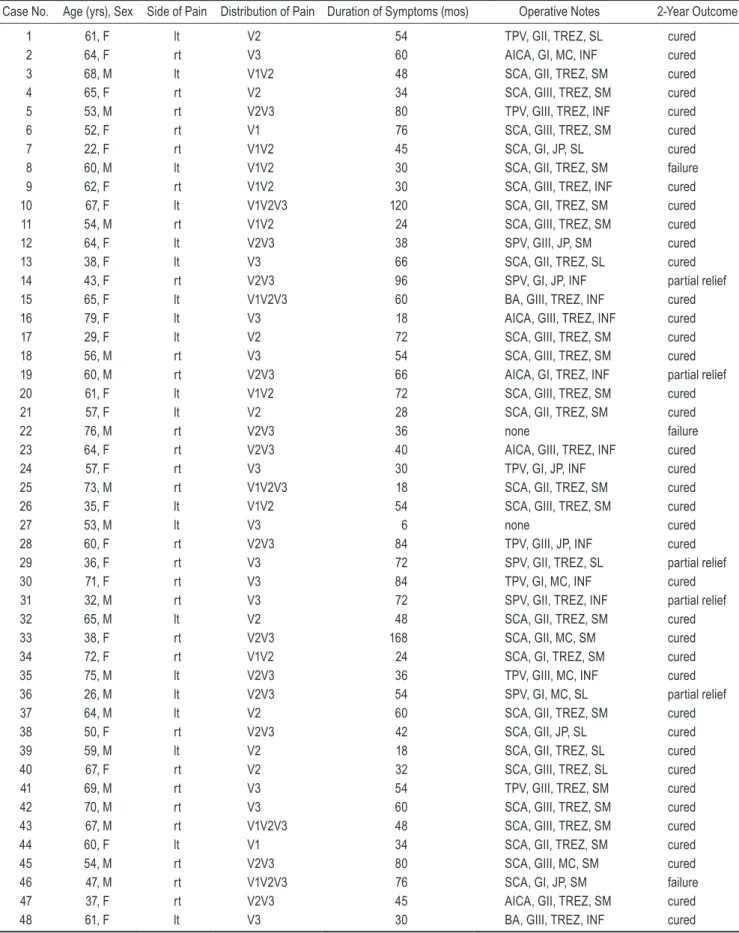
TABLE 1: Characteristics and indings in 50 patients who underwent MVD for classic TN*
Case No. Age (yrs), Sex Side of Pain Distribution of Pain Duration of Symptoms (mos) Operative Notes 2-Year Outcome
1 61, F lt V2 54 TPV, GII, TREZ, SL cured
2 64, F rt V3 60 AICA, GI, MC, INF cured
3 68, M lt V1V2 48 SCA, GII, TREZ, SM cured
4 65, F rt V2 34 SCA, GIII, TREZ, SM cured
5 53, M rt V2V3 80 TPV, GIII, TREZ, INF cured
6 52, F rt V1 76 SCA, GIII, TREZ, SM cured
7 22, F rt V1V2 45 SCA, GI, JP, SL cured
8 60, M lt V1V2 30 SCA, GII, TREZ, SM failure
9 62, F rt V1V2 30 SCA, GIII, TREZ, INF cured
10 67, F lt V1V2V3 120 SCA, GII, TREZ, SM cured
11 54, M rt V1V2 24 SCA, GIII, TREZ, SM cured
12 64, F lt V2V3 38 SPV, GIII, JP, SM cured
13 38, F lt V3 66 SCA, GII, TREZ, SL cured
14 43, F rt V2V3 96 SPV, GI, JP, INF partial relief
15 65, F lt V1V2V3 60 BA, GIII, TREZ, INF cured
16 79, F lt V3 18 AICA, GIII, TREZ, INF cured
17 29, F lt V2 72 SCA, GIII, TREZ, SM cured
18 56, M rt V3 54 SCA, GIII, TREZ, SM cured
19 60, M rt V2V3 66 AICA, GI, TREZ, INF partial relief
20 61, F lt V1V2 72 SCA, GIII, TREZ, SM cured
21 57, F lt V2 28 SCA, GII, TREZ, SM cured
22 76, M rt V2V3 36 none failure
23 64, F rt V2V3 40 AICA, GIII, TREZ, INF cured
24 57, F rt V3 30 TPV, GI, JP, INF cured
25 73, M rt V1V2V3 18 SCA, GII, TREZ, SM cured
26 35, F lt V1V2 54 SCA, GIII, TREZ, SM cured
27 53, M lt V3 6 none cured
28 60, F rt V2V3 84 TPV, GIII, JP, INF cured
29 36, F rt V3 72 SPV, GII, TREZ, SL partial relief
30 71, F rt V3 84 TPV, GI, MC, INF cured
31 32, M rt V3 72 SPV, GII, TREZ, INF partial relief
32 65, M lt V2 48 SCA, GII, TREZ, SM cured
33 38, F rt V2V3 168 SCA, GII, MC, SM cured
34 72, F rt V1V2 24 SCA, GI, TREZ, SM cured
35 75, M lt V2V3 36 TPV, GIII, MC, INF cured
36 26, M lt V2V3 54 SPV, GI, MC, SL partial relief
37 64, M lt V2 60 SCA, GII, TREZ, SM cured
38 50, F rt V2V3 42 SCA, GII, JP, SL cured
39 59, M lt V2 18 SCA, GII, TREZ, SL cured
40 67, F rt V2 32 SCA, GIII, TREZ, SL cured
41 69, M rt V3 54 TPV, GIII, TREZ, SM cured
42 70, M rt V3 60 SCA, GIII, TREZ, SM cured
43 67, M rt V1V2V3 48 SCA, GIII, TREZ, SM cured
44 60, F lt V1 34 SCA, GII, TREZ, SM cured
45 54, M rt V2V3 80 SCA, GIII, MC, SM cured
46 47, M rt V1V2V3 76 SCA, GI, JP, SM failure
47 37, F rt V2V3 45 AICA, GII, TREZ, SM cured
48 61, F lt V3 30 BA, GIII, TREZ, INF cured
completed on each of the 60 sections, coronal and sagittal reformatted images were obtained and reviewed.
Volume and CSA Measurements
Three-dimensional DRIVE images were transferred to a workstation for postprocessing and analysis. Mea-surements of V and CSA for each TGN were performed preoperatively using the imaging software MIPAV, a free download available on the website http://mipav.cit.nih.gov/.
For the measurement of V, segmentation of the TGN started at the point where the nerve emerges from the pons, and another arbitrary cut was made at the entrance of the nerve into Meckel’s cave. The TGN was manually delineated using a mouse-driven cursor in each section thickness of 0.5 mm passing through the nerve. The V was automatically calculated with 3D reconstruction software (Fig. 1).
Next, the reformatted images were magniied to fa -cilitate measurements of the CSA of each TGN using a mouse-driven cursor. No adjustments for magniication were required because the measurement program of the workstation automatically corrects for magniication. The CSA was calculated at 5 mm from the entry of the TGN into the pons in an image plane perfectly perpendicular to the course of each nerve. Observers followed the TGN to its entry into the pons to distinguish nerve from ves-sels in the region. If the nerve was not clearly shown as separate from the adjacent vasculature at 5 mm from its
entry into the pons, the image immediately adjacent was used (Fig. 2).
It took approximately 7 minutes per patient to per-form this process. Two observers (P.R.L.L. and C.B.), who were blinded to which side of the face was symptom-atic and to the surgical indings, independently calculated these morphometric parameters. For statistical analysis, we considered the mean between the observers.
Surgical Treatment
Microvascular decompression was performed via retromastoid craniotomy using the same microsurgical techniques in all patients.20–22 The senior neurosurgeon
(M.S.), who was responsible for operative notes and was blinded to the V and CSA measurement results, performed the surgeries in all patients. Operative notes revealed the presence or absence of NVC, the type of vessel involved in NVC (superior cerebellar artery [SCA], anterior inferi-or cerebellar artery [AICA], basilar artery [BA], superiinferi-or petrosal vein [SPV], or transverse pontine vein [TPV]), the location of compression along the nerve (trigeminal root entry zone [TREZ; that is, < 5 mm from entry into the pons], midcisternal [MC] segment, or juxtapetrous [JP] segment [that is, at the exit of the root from Meckel’s cave]), the site of compression around the circumference of the root (superomedial [SM] to the root, superolateral [SL] to the root, or inferior [INF] to the root), and espe-cially the degree of root compression.20,21 The severity of
Fig. 1. A: Axial 3D DRIVE image showing the superior cerebellar artery (SCA) compressing the left TGN (white arrow). Note the important contrast between CSF with hypersignal and the artery with hyposignal. B: Sagittal 3D DRIVE image showing the SCA (red arrow) compressing the trigeminal root entry zone (TREZ). C: Axial 3D T1-Gd image showing good visualization of the artery with hypersignal. D: Operative view of NVC on the left TGN. Note that the vascular loop exerts compression at the ventral and superior aspects of the TGN. E–I: Axial 3D DRIVE images showing segmentation of both TGNs from Meckel’s cave to the exit point from the pons.
TABLE 1: Characteristics and indings in 50 patients who underwent MVD for classic TN* (continued)
Case No. Age (yrs), Sex Side of Pain Distribution of Pain Duration of Symptoms (mos) Operative Notes 2-Year Outcome
49 68, F rt V2 30 SCA, GII, TREZ, SL cured
50 67, F lt V2 84 TPV, GII, MC, SL partial relief
compression was graded as follows: Grade I, the vessel was simply in contact with the nerve but without any vis-ible deformity of the root; Grade II, there was displace-ment or distortion of the root; Grade III, a clear-cut and marked indentation on the root was present.
Assessment of the Effect of MVD on Pain
The senior surgeon (M.S.) assessed all 50 patients in person at discharge (generally postoperative Day 10), at the irst outpatient visit (usually around postoperative Day 70), and at 1 and 2 years after surgery. For this study (completed in 2012), no patient was lost to follow-up at 2 years after surgery.
Neuralgia was considered cured—and thus the MVD a success—when relief was complete and all medication could be withdrawn. Neuralgia was considered partially relieved when some pain remained but was well con-trolled by complementary medical therapy. The treatment was considered a failure when pain persisted in any form, either spasmodic or constant aching pain, despite medical therapy.
Statistical Analysis
Anatomical parameters (V and CSA) of the TGN in the patients’ affected side (ipsilateralTN), in the patients’ unaffected side (contralateralTN), and in both sides in the normal control subjects (controls) were compared with
1-way ANOVA followed by Bonferroni’s multiple com-parison test using GraphPad Prism statistical analysis software. Results were expressed as the means ± standard deviation and were shown in a box and whiskers plot. Interobserver variability was assessed using the Pearson correlation coeficient.
The nonparametric Spearman correlation coeficient was calculated for comparisons between patient charac-teristics (age and duration of symptoms before MVD) and variations in V (DV) or CSA (DCSA) between the ipsilat-eralTN and contralatipsilat-eralTN, expressed as a percentage. Correlations between other patient characteristics (side of pain and patient sex) and the DV or DCSA, expressed as a percentage, were analyzed using a nonparametric t-test (Mann-Whitney).
Correlations among other patient characteristics (area of distribution of pain), NVC characteristics (type of vessel involved in NVC, location of compression along the nerve, site of compression around the circumference of the root, and degree of compression), and the DV or DCSA, expressed as a percentage, were evaluated with ANOVA followed by Bonferroni’s multiple comparison test using GraphPad Prism statistical analysis software. Results were expressed as the means ± standard deviation and shown in a box and whiskers plot.
Finally, correlations between clinical outcomes at the 2-year follow-up after surgery (complete cure, partial re-lief, or treatment failure) and DV or DCSA, expressed as
a percentage, were analyzed using a nonparametric t-test (Mann-Whitney).
A p value < 0.05 was considered statistically signii -cant.
Results
Surgical Findings
In 2 (4%) of the 50 patients, no NVC was found de-spite a complete and careful exploration of the trigeminal root from the opening of Meckel’s cave to the TREZ at the pons. The SCA was responsible for compression in 28 cases, the AICA in 5 cases, and the BA in 2 cases. A vein was compressing the nerve in 13 cases: the SPV in 5 cases and the TPV in 8.
Neurovascular compression was located in the TREZ in 34 cases, at the MC segment in 7 cases, and at the JP segment in 7 cases. The site of compression was SM to the root in 24 cases, INF to the root in 14, and SL to the root in 10.
The severity of NVC was Grade I in 9 cases, Grade II in 18 cases, and Grade III in 21 cases.
Volume and CSA Measurements
The mean V of the TGN on the ipsilateralTN (60.35 ± 21.74 mm3, 95% CI 24.83–129.2) was signiicantly small
-er (p < 0.05) than those for the contralat-eralTN (78.62 ± 24.62 mm3, 95% CI 31.16–148.8) and controls (89.09 ±
14.72 mm3, 95% CI 64.0–116.0; Fig. 3 upper). However,
there was no statistical difference (p > 0.05) in mean V between the contralateralTN and controls, nor between the right (89.59 ± 14.52 mm3, 95% CI 67.18–114.5) and
left sides (88.60 ± 15.28 mm3, 95% CI 64.0–116.0) of the
TGN in the control group. The loss of V on the ipsilater-alTN compared with that on the contralateripsilater-alTN (23.2%) was greater than the difference between the two sides in the control group (1.1%). In only 4 (Cases 24, 26, 27, and 46) of 50 patients, the V on the ipsilateralTN was greater than that on the contralateralTN.
The mean CSA for the ipsilateralTN (4.17 ± 1.74 mm2,
95% CI 1.77–10.08) was signiicantly smaller than those for the contralateralTN (5.41 ± 1.89 mm2, 95% CI 1.36–
10.03) and controls (5.64 ± 0.85 mm2, 95% CI 2.89–7.2;
Fig. 3 lower). However, there were no statistically signii -cant differences in the mean CSA between the contralater-alTN and controls, nor between the right (5.55 ± 1.09 mm2,
95% CI 2.89–7.2) and left sides (5.66 ± 0.42 mm2, 95% CI
4.9–6.45) of the TGN in controls. The loss of CSA for the ipsilateralTN compared with that for the contralateralTN (22.9%) was greater than the difference between the two sides in the control group (1.95%). In only 4 (Cases 22, 27, 31, and 36) of 50 patients, the CSA for the ipsilateralTN was greater than that for the contralateralTN.
The Pearson correlation coeficients for measure -ments made by both observers were 0.7559 (p < 0.01) for estimated V measurements and 0.9024 (p < 0.01) for esti -mated CSA measurements.
Correlations Between Anatomical TGN Parameters and Patient Characteristics
The Spearman correlation coeficient showed a weak
correlation (r = 0.1850, p = 0.1984) between patient age and the corresponding DV. Similarly, the Spearman corre-lation coeficient showed a weak correcorre-lation (r = 0.2060, p = 0.1511) between age and the corresponding DCSA on the ipsilateralTN compared with that on the contralater-alTN.
The Spearman correlation coeficient showed a weak correlation (r = 0.1751, p = 0.2238) between the duration of symptoms before MVD and the corresponding DV in the TGN on the ipsilateralTN compared with that on the contralateralTN. Similarly, the Spearman correlation coeficient showed a weak correlation (r = 0.1128, p = 0.4353) between the duration of symptoms before MVD and the corresponding DCSA in the TGN on the ipsilater-alTN compared with that on the contralateripsilater-alTN.
A comparison of sides affected by pain revealed no statistical difference in the DV between patients with pain on the right side (24.7% ± 14.38%, 29 patients) and those with left-sided pain (21.17% ± 13.55%, 21 patients; Table 2). Similarly, there was no statistical difference in the DCSA in patients with pain on their right side (23.97% ± 17.43%) versus the left (20.9% ± 19.83%).
Regarding patient sex, there was no statistical differ-ence in the DV in males (23.34% ± 13.67%, 20 patients) versus females (22.23% ± 14.58%, 30 patients; Table 2). Similarly, there was no statistical difference in the DCSA
Fig. 3. Upper: Graph showing that the mean V of the TGNs in the
affected side (ipsilateralTN; 50 nerves) was signiicantly (p < 0.05)
lower than that of the TGNs in the unaffected side (contralateralTN; 50 nerves) and in controls (40 nerves). Lower: Graph showing that the
mean CSA of the TGN of the ipsilateralTN (50 nerves) was signiicantly
lower than those of the contralateralTN (50 nerves) and of controls (40
in males (18.82% ± 23.13%) versus females (25.26% ± 13.68%).
Finally, as regards the area of pain distribution, there was no statistical difference in the DV among patients with pain situated in V1 (39.45% ± 0.35%, 2 patients), V1V2 (18.69% ± 10.67%, 8 patients), V1V2V3 (23.03% ± 22.69%, 5 patients), V2 (19.62% ± 8.59%, 10 patients), V2V3 (21.38% ± 11.54%, 13 patients), and V3 (24.19% ± 17.28%, 12 patients; Table 2). Similarly, there was no statistical dif-ference in the DCSA among patients with pain located in V1 (25.45% ± 19.85%), V1V2 (30.14% ± 11.81%), V1V2V3 (22.12% ± 11.99%), V2 (24.25% ± 12.87%), V2V3 (18.61% ± 22.12%), and V3 (20.58% ± 22.63%).
Correlations Between Anatomical TGN Parameters and NVC Characteristics
Comparisons of the type of vessel involved in NVC revealed no statistical difference in the DV among patients with NVC caused by the SCA (22.34% ± 13.27%, 28 pa-tients), AICA (32.4% ± 14.59%, 5 patients), BA (31.15% ± 24.96%, 2 patients), SPV (31.75% ± 10.3%, 5 patients), and TPV (22.64% ± 16.21%, 8 patients; Table 2). Similarly,
there was no statistical difference in the DCSA among patients with NVC caused by the SCA (25.95% ± 13.14%), AICA (29.68% ± 16.09%), BA (22.65% ± 21.43%), SPV (11.44% ± 13.96%), and TPV (28.06% ± 13.65%).
Comparisons of the location of compression along the nerve revealed no statistical difference in the DV among patients with NVC located in the TREZ (25.49% ± 12.04%, 34 patients), MC segment (15.93% ± 5.8%, 7 patients), and JP segment (15.11% ± 15.52%, 7 patients; Table 2). The DV in patients with NVC in the TREZ was signiicantly greater (p = 0.032, Mann-Whitney test) than that in a separate group of patients with NVC in the MC and JP segments (15.52% ± 15.21%, 14 patients; Fig. 4). Similarly, there was no statistical difference in the DCSA among patients with NVC located in the TREZ (26.11% ± 14.24%, 34 patients), MC segment (24.93% ± 18.96%, 7 patients), and JP segment (19.97% ± 7.19%, 7 patients). The DCSA in patients with NVC in the TREZ did not dif-fer (p = 0.5328, Mann-Whitney test) from that in a group of patients with NVC located in the MC and JP segments (22.45% ± 14.02%, 14 patients).
Comparisons of the site of compression around the TABLE 2: Correlations between anatomical TGN parameters and patient and NVC characteristics
Characteristic No. of Patients ΔV (%) ΔCSA (%)
side of pain*
rt 29 24.7 ± 14.48 23.97 ± 17.43
lt 21 21.17 ± 13.55 20.9 ± 19.83
sex*
M 20 23.34 ± 13.67 18.82 ± 23.13
F 30 22.23 ± 14.58 25.26 ± 13.68
territory of pain distribution†
V1 2 39.45 ± 0.35 25.45 ± 19.85
V1V2 8 18.69 ± 10.67 30.14 ± 11.81
V1V2V3 5 23.03 ± 22.69 22.12 ± 11.99
V2 10 19.62 ± 8.59 24.25 ± 12.87
V2V3 13 21.38 ± 11.54 18.61 ± 22.12
V3 12 24.19 ± 17.28 20.58 ± 22.63
vessel involved in NVC†
SCA 28 22.34 ± 13.27 25.95 ± 13.14
AICA 5 32.4 ± 14.59 29.68 ± 16.09
BA 2 31.15 ± 24.96 22.65 ± 21.43
SPV 5 31.75 ± 10.3 11.44 ± 13.96
TPV 8 22.64 ± 16.21 28.06 ± 13.65
location of compression along the nerve†
TREZ 34 25.49 ± 12.04 26.11 ± 14.24
MC 7 15.93 ± 5.8 24.93 ± 18.96
JP 7 15.11 ± 15.52 19.97 ± 7.19
site of compression around circumference of root†
SM 24 22.23 ± 14.16 25.53 ± 12.76
SL 10 21.53 ± 7.86 20.66 ± 14.71
INF 14 27.69 ± 14.16 27.32 ± 16.21
* Statistical data using a nonparametric Mann-Whitney test.
circumference of the root showed no statistical differ-ence in the DV among patients with NVC situated SM to the root (22.23% ± 14.16%, 24 patients), SL to the root (21.53% ± 7.86%, 10 patients), and INF to the root (27.69% ± 14.16%, 14 patients; Table 2). Similarly, there was no statistical difference in the DCSA among patients with NVC situated SM (25.53% ± 12.76%), SL (20.66% ± 14.71%), and INF to the root (27.32% ± 16.21%).
Finally, concerning the degree of compression, statisti-cally signiicant differences in the DV were found between patients with NVC Grade I (16.38% ± 16.4%, 9 patients) and those with NVC Grade III (28.97% ± 13.68%, 21 pa-tients; Fig. 5A). However, there was no statistical difference in the DV between patients with NVC Grade I and those with NVC Grade II (21.16% ± 8.88%, 18 patients), nor be-tween NVC Grade II and Grade III. The DV in patients with NVC Grades I and II (19.57% ± 11.82%, 27 patients) was signiicantly smaller (p = 0.0168, Mann-Whitney test) than in patients with NVC Grade III. The DV in a group
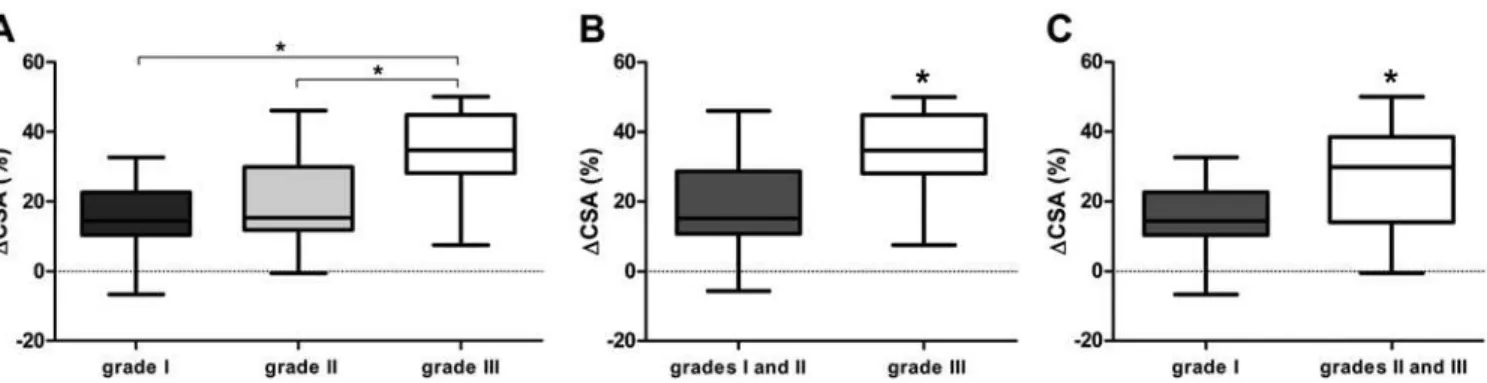
with NVC Grades II and III (25.27% ± 12.22%, 39 patients) did not signiicantly differ (p = 0.1779, Mann-Whitney test) from the DV in a group with NVC Grade I (Fig. 5C). The DCSA in patients with NVC Grade III (34.48% ± 11.57%, 21 patients) was signiicantly greater than in patients with NVC Grade I (15.58% ± 10.93%, 9 patients) and Grade II (18.76% ± 11.78%, 18 patients; Fig. 6A). There was no sta-tistically signiicant difference in the DCSA between pa-tients with NVC Grade I and those with NVC Grade II. The DCSA in a group with NVC Grades I and II (17.77% ± 11.28%, 27 patients) was signiicantly lower (p < 0.001, Mann-Whitney test) than in the group with NVC Grade III (Fig. 6B). The DCSA in a group with NVC Grades II and III (27.22% ± 13.98%, 39 patients) was signiicantly greater (p = 0.042, Mann-Whitney test) than in the group with NVC Grade I (Fig. 6C).
Figure 7 illustrates the correlation between the de-gree and location of the NVC. Neurovascular compres-sion Grades II and III occurred in a higher proportion at the TREZ than did NVC Grade I (OR 16.00, 95% CI 2.72–94.12). Among the 18 patients with NVC Grade II and the 21 patients with NVC Grade III, compression was situated close to the brainstem in 15 and 17 patients, re-spectively (p = 0.0012, Fisher’s exact test). Of the 9 pa-tients with NVC Grade I, 2 had compression at the TREZ and 7 at the MC or JP segments.
Pain Relief Over Time and Correlations Between Anatomical TGN Parameters and Clinical Outcomes
At discharge, on the 10th postoperative day, 49 patients (98%) were cured. In 1 patient (2%) the procedure was con-sidered a failure because of persistent residual pain. At the outpatient visit on postoperative Day 70, 44 patients (88%) were cured, 3 (6%) still had some background pain well controlled with medical treatment (partial relief), and 3 (6%) presented with paroxysmal pain (treatment failure). At the 1-year postoperative visit, the success rate was 84%, corresponding to 42 patients who were totally pain free (complete cure), 5 (10%) partially relieved of pain, and 3 (6%) with persistent pain (treatment failure). At the 2-year postoperative visit, neuralgia was completely relieved in 41
Fig. 4. Correlation between the DV of the TGNs in the affected and unaffected sides of patients, expressed as a percentage, and the loca-tion of compression along the nerve. The DV in patients with NVC in
the TREZ (25.49% ± 12.04%, 34 patients) was signiicantly greater (p = 0.032, Mann-Whitney test) than that in patients with NVC in the MC and
JP segments (15.52% ± 15.21%, 14 patients).
Fig. 5. Correlation between the DV of the TGNs in the affected and unaffected sides of patients, expressed as a percentage, and the severity of compression. A: Graph showing that the DV in patients with NVC Grade III (28.97% ± 13.68%, 21 patients)
was significantly greater (p < 0.05) than that in patients with NVC Grade I (16.38% ± 16.4%, 9 patients). There was no statisti -cal difference in the DV in patients with NVC Grade III compared with that in patients with NVC Grade II (21.16% ± 8.88%, 18 patients). B: Graph showing that the DV in patients with NVC Grades I and II (19.57% ± 11.82%, 27 patients) was significantly smaller (p = 0.0168, Mann-Whitney test) than that in patients with NVC Grade III. C: Graph showing that the DV in patients with
patients (82%) and improved in 6 (12%). Surgery was con-sidered a failure in 3 patients (6%; Table 1).
Concerning the clinical outcomes at the 2-year fol-low-up, the DCSA was statistically signiicantly different (p = 0.02, Mann-Whitney test) between pain-free patients (25.75% ± 15.6%, 41 patients) and those with partial pain relief or treatment failure (8.68% ± 22.94%, 9 patients; Fig. 8 upper). Moreover, the DV did not differ (p = 0.09, Mann-Whitney test) between patients with partial relief or treatment failure (14.57% ± 14.37%, 9 patients) and the cured patients (23.86% ± 13.55%, 41 patients; Fig. 8 lower). Although not statistically signiicant, these values indicated a trend.
Discussion
In this study we prospectively evaluated atrophic changes in the TGNs of patients with classic TN caused by NVC. The V and CSA of the TGNs were measured on high-resolution 3-T MRI in 50 patients who underwent
Fig. 6. Correlation between the DCSA of the TGNs in the affected and unaffected sides of patients, expressed as a percent-age, and the severity of compression. A: Graph showing that the DCSA of the TGN in patients with NVC Grade III (34.48% ±
11.57%, 21 patients) was significantly greater (p < 0.05) than in patients with NVC Grade I (15.58% ± 10.93%, 9 patients) and
Grade II (18.76% ± 11.78%, 18 patients). B: Graph showing that the DCSA in a group with NVC Grades I and II (17.77% ±
11.28%, 27 patients) was significantly lower (p < 0.001, Mann-Whitney test) than in the group with NVC Grade III. C: Graph showing that the DCSA in the group with NVC Grades II and III (27.22% ± 13.98%, 39 patients) was significantly greater (p = 0.042, Mann-Whitney test) than in a group with NVC Grade I.
Fig. 7. Graph showing the correlation between the degree and the location of the NVC. Among the 18 patients with NVC Grade II and the 21 patients with NVC Grade III, compression was situated close
to the brainstem in 15 (83.3%) and 17 (80.9%) patients, respectively
(p = 0.0012, Fisher’s exact test). In the 9 cases of NVC Grade I, only
2 (22.2%) were situated at the TREZ and 7 (77.8%) at the MC or JP
segments.
Fig. 8. Graph showing the correlation between TGN anatomical pa-rameters and the 2-year outcome. Upper: The DCSA in patients with
partial pain relief or treatment failure at the 2-year follow-up (8.68% ±
22.94%, 9 patients) was inferior (p = 0.02) to that in the cured patients (25.75% ± 15.6%, 41 patients). Lower: At the 2-year follow-up, the DV in patients with partial relief or treatment failure (14.57% ± 14.37%,
9 patients) did not signiicantly differ (p = 0.09, Mann-Whitney test) from that in the cured patients (23.86% ± 13.55%, 41 patients). Although not
MVD and in 20 normal control subjects. Our work is the irst to show that anatomical TGN parameters correlate with patient and NVC characteristics, with particular em-phasis placed on the degree of compression observed dur-ing the surgical procedure. In addition, our data showed that TGN atrophy correlates with clinical outcomes at the 2-year follow-up after MVD.
Diagnostic Value of Anatomical TGN Parameters
The V and CSA measurements obtained from the ip-silateralTNs were signiicantly smaller than those from the contralateralTNs. These results, obtained via an im-aging protocol and conirmed by two blinded observ -ers, agreed with observations made during surgery,8,20
pathological examination of specimens collected during surgery and showing axonal loss and extensive demyelin-ation,4,10,12,18 and studies whose authors measured V and
CSA using various noninvasive imaging methods.5,11,13
In-terobserver agreement was 0.7559 for measurements of V and 0.9024 for measurement of CSA (p < 0.01).
In 7 of 50 patients, the mean V and/or CSA of the TGN on the ipsilateralTN was greater than those on the contralateralTN. Two of these 7 patients had no NVC dur-ing the surgery, 3 had NVC caused by veins, and 2 had NVC caused by arteries.
These results do not differ from those in other pub-lished case studies on the value of anatomical TGN pa-rameters in patients with TN.5,6,11,13,17 In 2005, Kress et
al.13 measured V in 62 patients (41 with TN, including
6 patients with multiple sclerosis) with one investigator using 1.5-T MRI in 50 normal subjects. In that study, the mean V on the ipsilateralTN was 69.6 mm3 (95% CI
37.2–110.6) and that on the contralateralTN was 84.5 mm3 (95% CI 50.3–141.1). The difference in V was
sta-tistically signiicant (28.9%, p < 0.01). In only 4 of the 41 patients with TN, the affected nerves had greater Vs than the unaffected nerves.
In 2006, Erbay et al.5 conducted a noncontrolled
study in which the mean diameter and mean CSA in 31 patients with TN were measured by two neuroradiologists using 1.5-T MRI who were blinded to which side of the face had symptoms. In that study, the mean diameter for the ipsilateralTN was 2.11 mm (95% CI 1.96–2.25) and for the contralateralTN was 2.62 mm (95% CI 2.41–2.82; p < 0.001). The mean CSA on the ipsilateralTN was sig -niicantly smaller than that on the contralateralTN (4.50 ± 1.75 mm2 vs 6.28 ± 2.19 mm2, p < 0.001). These au
-thors also observed that in 4 of the 31 patients, the CSA was greater in the affected nerves than in the unaffected nerves.5
In 2009, Hořínek et al.11 measured the V of the TGN
in 18 patients with TN and in 15 normal subjects by using 1.5-T MRI with two observers. The mean V on the ipsi-lateralTN was signiicantly reduced in comparison with that on the contralateralTN (0.059 ± 0.026 cm3 vs 0.068
± 0.018 cm3, p < 0.05; a difference of 27%).
More recently, two teams used 3-T MRI to measure V and/or CSA.6,17 According to Fujiwara et al.,6 the mean
CSA on the ipsilateralTN in 13 patients (3.9 ± 0.8 mm2)
was signiicantly smaller than that on the contralateralTN (5.1 ± 1.1 mm2; p < 0.05). Leal et al.17 demonstrated in
10 patients that the mean V on the ipsilateralTN (64.75 ± 14.12 mm3) was signiicantly smaller (p < 0.05) than
those on the contralateralTN (84.79 ± 19.6 mm3) and both
sides of the TGN in 6 normal subjects (81.57 ± 7.1 mm3).
They also observed that the mean CSA on the ipsilater-alTN (3.94 ± 0.78 mm2) was signiicantly smaller (p <
0.05) than that on the contralateralTN (5.27 ± 1.09 mm2)
as well as that in the control group (5.66 ± 0.43 mm2).
We followed strict criteria for patient selection in the present study. The population was homogeneous, with pa-tients presenting with classic TN caused by NVC and ages ranging from 22 years to 79 years. According to guidelines on TN management,3,7 a younger age increases the risk of
secondary TN, but the diagnostic accuracy of age as a pre-dictor of secondary TN was too low in pooled analyzed data to be clinically useful. All patients underwent MVD with complete exploration of the TGN and detection of direct neurovascular contact. Two independent observers, who were blinded to the patient symptoms as well as the morphometric results to avoid bias, collected the data.
The signiicant V difference that was preoperatively noted between the affected and unaffected sides in patients with neuralgia is indicative of nerve damage.13 We
hypoth-esize that atrophy in the TGN of patients with TN due to NVC could be a direct consequence of pulsatile compres-sion causing root injury, or it could be attributable to focal endoneural vascular injury resulting in root ischemia. Correlation Among TGN Atrophy, Patient Characteristics, NVC Characteristics, and Clinical Outcomes at the 2-Year Follow-Up After MVD
No signiicant correlation was found between any patient characteristics (age, duration of symptoms before MVD, side of pain, sex, and area of pain distribution) and the DV or DCSA (Table 2). Similarly, no signiicant cor -relation was found between NVC characteristics (type of vessel involved in NVC, location of compression along the nerve, and site of compression around the circumfer-ence of the root) and DV or DCSA.
Only the severity of compression was signiicantly correlated with the DV or DCSA. The ipsilateralTN with NVC Grade III had a smaller mean V than the ipsilater-alTN with NVC Grade I, although it was not smaller than the mean V of the ipsilateralTN with NVC Grade II (Fig. 5A). The ipsilateralTN with NVC Grade III had a smaller mean CSA than the ipsilateralTN with NVC Grades I and II (Fig. 6A). These data are important because some authors have supported the notion that outcome depends on the degree of vascular compression.1,2,21 Sindou et al.21
quantiied the degree of compression at surgery from Grade I to Grade III and showed that MVD offers a 15-year success rate of 88.1% if the NVC was Grade III, 78.3% if the NVC was Grade II, and only 58.3% if the NVC was Grade I. Meaney et al.19 reported MRI ind
In this context, we also observed that the DCSA be-tween the ipsilateralTN and the contralateralTN in pa-tients with NVC Grades II and III was signiicantly high -er (p < 0.05) than in patients with NVC Grade I (Fig. 6C). We also observed that the DV and DCSA in patients with NVC Grades I and II was signiicantly lower (p < 0.05) than in patients with NVC Grade III (Figs. 5B and 6B). These data could explain why the affected nerves with NVC located in the TREZ had a smaller mean V than those with NVC located in the MC or JP segments (Fig. 4). Neurovascular compression Grades II and III were observed in greater proportion at the TREZ than NVC Grade I. Of the 18 cases of NVC Grade II and 21 cases of NVC Grade III, 15 and 17 cases, respectively, had com-pression situated close to the brainstem (Fig. 7). Of the 9 patients with NVC Grade I, 2 had compression at the TREZ and 7 had compression in the MC or JP segments.
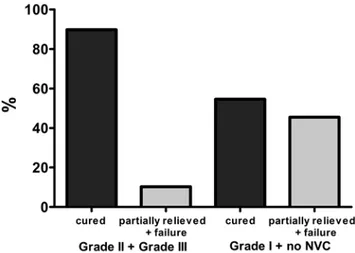
Figure 8 demonstrated a very interesting correlation between the level of TGN atrophy and clinical outcomes after surgery. In fact, patients considered to be cured after surgery had a greater DCSA than that in patients consid-ered to have partial relief or treatment failure. The same inding was almost found in relation to measurements of V, but the p value was slightly higher at 0.05. Table 1 shows that for the 2-year outcome after MVD, 41 of 50 patients were cured after surgery and 9 had partial re-lief or persistent pain (OR 7.292, 95% CI 1.51–35.22). Of the 39 patients with NVC Grade II or Grade III, 35 were cured after surgery and only 4 had partial pain relief or treatment failure (p = 0.0170, Fisher’s exact test; Fig. 9). Of the 11 patients with NVC Grade I or no NVC, 6 were cured after surgery and 5 had partial relief or treatment failure. These data suggest that the preoperative appear-ance of TGN atrophy before surgical exploration, which was signiicantly correlated with the severity of compres -sion, allows one to predict long-term prognosis. We
be-lieve that MVD is the best treatment for NVC Grade II or III. For an NVC Grade I, especially in elderly patients with a precarious clinical status, a percutaneous lesioning procedure or radiosurgery may be preferable.
Conclusions
High-resolution imaging can be used to demonstrate TGN atrophy due to NVC in patients with classic TN. Results in this study showed that the affected TGN has a smaller V and CSA than the unaffected nerve. These atrophic changes were associated with the severity of compression and the clinical outcomes after surgery.
Acknowledgment
We are grateful to Ms. Valérie Constans for linguistic editing assistance.
Disclosure
The authors report no conflict of interest concerning the mate-rials or methods used in this study or the findings specified in this paper.
Author contributions to the study and manuscript prepara-tion include the following. Concepprepara-tion and design: Leal, Sindou.
Acquisition of data: Leal, Barbier, Hermier, Souza, Cristino-Filho. Analysis and interpretation of data: Leal, Souza, Sindou. Drafting
the article: Leal, Sindou. Critically revising the article: all authors. Reviewed submitted version of manuscript: all authors. Approved the final version of the manuscript on behalf of all authors: Leal.
Statistical analysis: Souza. Administrative/technical/material sup -port: Sindou.
References
1. Barker FG II, Jannetta PJ, Bissonette DJ, Larkins MV, Jho HD: The long-term outcome of microvascular decompression for trigeminal neuralgia. N Engl J Med334:1077–1083, 1996 2. Burchiel KJ, Clarke H, Haglund M, Loeser JD: Long-term
ef-icacy of microvascular decompression in trigeminal neural -gia. J Neurosurg69:35–38, 1988
3. Cruccu G, Gronseth G, Alksne J, Argoff C, Brainin M, Bur-chiel K, et al: AAN-EFNS guidelines on trigeminal neuralgia management. Eur J Neurol15:1013–1028, 2008
4. Devor M, Govrin-Lippmann R, Rappaport ZH: Mechanism of trigeminal neuralgia: an ultrastructural analysis of trigeminal root specimens obtained during microvascular decompres-sion surgery. J Neurosurg96:532–543, 2002
5. Erbay SH, Bhadelia RA, O’Callaghan M, Gupta P, Riesen-burger R, Krackov W, et al: Nerve atrophy in severe
trigemi-nal neuralgia: non-invasive conirmation at MR imaging—ini -tial experience. Radiology 238:689–692, 2006
6. Fujiwara S, Sasaki M, Wada T, Kudo K, Hirooka R, Ishigaki
D, et al: High-resolution diffusion tensor imaging for the de-tection of diffusion abnormalities in the trigeminal nerves of patients with trigeminal neuralgia caused by neurovascular compression. J Neuroimaging21:e102–e108, 2011
7. Gronseth G, Cruccu G, Alksne J, Argoff C, Brainin M, Bur-chiel K, et al: Practice parameter: the diagnostic evaluation and treatment of trigeminal neuralgia (an evidence-based review): report of the Quality Standards Subcommittee of the American Academy of Neurology and the European Federation of Neuro-logical Societies. Neurology71:1183–1190, 2008
8. Hamlyn PJ: Neurovascular relationships in the posterior cra-nial fossa, with special reference to trigeminal neuralgia. 2. Neurovascular compression of the trigeminal nerve in
cadav-Fig. 9. Graph showing the correlation between the degree of NVC and the 2-year outcome after surgery. Of the 39 patients with NVC
Grade II or III, 35 (89.7%) were cured after surgery and only 4 (10.3%)
had partial pain relief or treatment failure (p = 0.0170, Fisher’s exact
test). Of the 11 patients with NVC Grade I or no NVC, 6 (54.5%) were cured after surgery and 5 (45.5%) had partial pain relief or treatment
eric controls and patients with trigeminal neuralgia: quantii
-cation and inluence of method. Clin Anat10:380–388, 1997
9. Headache Classiication Subcommittee of The International Headache Society: The International Classiication of Head -ache Disorders: 2nd edition. Cephalalgia 24 Suppl 1:9–160, 2004
10. Hilton DA, Love S, Gradidge T, Coakham HB: Pathological
indings associated with trigeminal neuralgia caused by vas -cular compression. Neurosurgery35:299–303, 1994
11. Hořínek D, Brezová V, Nimsky C, Belšan T, Martinkovič L,
Masopust V, et al: The MRI volumetry of the posterior fos-sa and its substructures in trigeminal neuralgia: a validated study. Acta Neurochir (Wien)151:669–675, 2009
12. Kopp N, Adabotti J, Sindou M: Histological study (photon and electron microscopic) of trigeminal rootlet specimen in patients with idiopathic trigeminal neuralgia operated on for vascular decompression (13 cases). Acta Neurochir (Wien) 129:241, 1994 (Abstract)
13. Kress B, Schindler M, Rasche D, Hähnel S, Tronnier V, Sar-tor K, et al: MRI volumetry for the preoperative diagnosis of trigeminal neuralgia. Eur Radiol15:1344–1348, 2005 14. Leal PRL, Froment JC, Sindou M: [Predictive value of MRI
for detecting and characterizing vascular compression in cra -nial nerve hyperactivity syndromes (trigeminal and facial nerves).] Neurochirurgie55:174–180, 2009 (Fr)
15. Leal PRL, Hermier M, Froment JC, Souza MA,
Cristino-Filho G, Sindou M: Preoperative demonstration of the neu-rovascular compression characteristics with special emphasis on the degree of compression, using high-resolution magnetic resonance imaging: a prospective study, with comparison to
surgical indings, in 100 consecutive patients who underwent
microvascular decompression for trigeminal neuralgia. Acta Neurochir (Wien)152:817–825, 2010
16. Leal PRL, Hermier M, Souza MA, Cristino-Filho G, Froment JC, Sindou M: Visualization of vascular compression of the
trigeminal nerve with high-resolution 3T MRI: a prospective study comparing preoperative imaging analysis to surgical
indings in 40 consecutive patients who underwent microvas -cular decompression for trigeminal neuralgia. Neurosurgery 69:15–26, 2011
17. Leal PRL, Roch JA, Hermier M, Souza MAN, Cristino-Filho
G, Sindou M: Structural abnormalities of the trigeminal root revealed by diffusion tensor imaging in patients with trigeminal neuralgia caused by neurovascular compression: a prospective, double-blind, controlled study. Pain152:2357–2364, 2011 18. Love S, Hilton DA, Coakham HB: Central demyelination of
the Vth nerve root in trigeminal neuralgia associated with vascular compression. Brain Pathol8:1–12, 1998
19. Meaney JFM, Eldridge PR, Dunn LT, Nixon TE, Whitehouse GH, Miles JB: Demonstration of neurovascular compression in trigeminal neuralgia with magnetic resonance imaging.
Comparison with surgical indings in 52 consecutive operative
cases. J Neurosurg83:799–805, 1995
20. Sindou M, Howeidy T, Acevedo G: Anatomical observations during microvascular decompression for idiopathic trigeminal neuralgia (with correlations between topography of pain and
site of the neurovascular conlict). Prospective study in a series
of 579 patients. Acta Neurochir (Wien)144:1–13, 2002 21. Sindou M, Leston J, Decullier E, Chapuis F: Microvascular
decompression for primary trigeminal neuralgia: long-term effectiveness and prognostic factors in a series of 362
con-secutive patients with clear-cut neurovascular conlicts who
underwent pure decompression. J Neurosurg107:1144–1153, 2007
22. Sindou M, Leston JM, Decullier E, Chapuis F: Microvascular decompression for trigeminal neuralgia: the importance of a noncompressive technique—Kaplan-Meier analysis in a con-secutive series of 330 patients. Neurosurgery63(4Suppl 2): 341–351, 2008
Manuscript submitted June 18, 2013. Accepted February 18, 2014.
Please include this information when citing this paper: pub-lished online April 18, 2014; DOI: 10.3171/2014.2.JNS131288.