online | memorias.ioc.fiocruz.br
Distinct population structure for co-occurring
Anopheles goeldii
and
Anopheles triannulatus
in Amazonian Brazil
Sascha Naomi McKeon1,5/+, Marta Moreno2, Maria Anise Sallum3, Marinete Marins Povoa4, Jan Evelyn Conn1,5
1Department of Biomedical Sciences, School of Public Health, State University of New York, Albany, NY, USA 2Division of Infectious Diseases, School of Medicine, University of California San Diego, La Jolla, CA, USA 3Departamento de Epidemiologia, Faculdade de Saúde Pública, Universidade de São Paulo, São Paulo, SP, Brasil
4Laboratório de Pesquisas Básicas em Malária, Instituto Evandro Chagas, Ananindeua, PA, Brasil 5Griffin Laboratory, Wadsworth Center, New York State Department of Health, New York, NY, USA
To evaluate whether environmental heterogeneity contributes to the genetic heterogeneity in Anopheles triannu-latus, larval habitat characteristics across the Brazilian states of Roraima and Pará and genetic sequences were ex-amined. A comparison with Anopheles goeldii was utilised to determine whether high genetic diversity was unique to An. triannulatus. Student t test and analysis of variance found no differences in habitat characteristics between the species. Analysis of population structure of An. triannulatus and An. goeldii revealed distinct demographic histories in a largely overlapping geographic range. Cytochrome oxidase I sequence parsimony networks found geographic clustering for both species; however nuclear marker networks depicted An. triannulatus with a more complex his-tory of fragmentation, secondary contact and recent divergence. Evidence of Pleistocene expansions suggests both species are more likely to be genetically structured by geographic and ecological barriers than demography. We hypothesise that niche partitioning is a driving force for diversity, particularly in An. triannulatus.
Key words: An. triannulatus - An. goeldii - population structure - COI - white gene - ITS2
Malaria remains one of the most important tropical diseases in the world with an estimated 216 million cases in 2010 (WHO 2011). Brazil has the largest incidence of disease and malaria related deaths in South America, averaging 300 thousand cases annually (MS 2008, Bar-reto et al. 2009). Nearly all cases occur in the Amazon Basin (Akhavan et al. 1999, Moutinhoet al. 2011), where the relatively low levels of transmission have been diffi-cult to control (da Silva-Nunes et al. 2011). The Amazon Basin is one of the world’s most important bioregions, with a variety of habitats suitable for Anopheles species, many of which are malaria vectors.
Most primary vectors are widespread because of excellent colonising abilities and adaptation to variable environmental conditions (Costantini et al. 2009, Cohuet et al. 2010, Loaiza et al. 2012). Though not major ma-laria vectors in South America, Anopheles goeldii and Anopheles triannulatus are locally and regionally im-portant (Rubio-Palis 1994, Póvoa et al. 2001, Galardo et al. 2007) with large geographic distributions and a mod-erate to wide habitat range (unpublished observations). Both species can colonise and increase abundance in altered or temporary environments (Tadei & Dutary-Thatcher 2000). Overlapping species distributions and
doi: 10.1590/0074-0276108052013012
Financial support: IEC/NIH (1T32AI05532901A1), Training in Bio-defense and Emerging Infectious Disease/NIH (R01 A154139) (to JEC) + Corresponding author: [email protected]
Received 17 November 2012 Accepted 16 May 2013
mostly generalist behaviour (McKeon et al. 2013), in ad-dition to the hypothesis of competition towards exclu-sion, noted by Tadei et al.(1998) make An. goeldii and An. triannulatus ideal comparisons.
An. goeldii (Rozeboom & Gabaldón), often mistak-enly identified as Anopheles nuneztovari (Sallum et al. 2008),has been resurrected from synonymy (Calado et al. 2008) and is part of the Nuneztovari complex (Mon-toya-Lerma et al. 2011). An. goeldii, thought to be re-stricted to the Amazon Basin (Calado et al. 2008), may extend further north in sympatry with An. nuneztovari (Scarpassa & Conn 2011). The close genetic association between An. nuneztovari, an important malaria vector in Colombia and Venezuela (Bourke et al. 2010), and An. goeldii, raises concerns over the putative vector status of the latter and its habitat specificity. Thus, studies involv-ing the population structure and ecological distribution of An. goeldii are useful in determining the extent of its distribution and divergence.
As factors affecting speciation and population dif-ferentiation evolve at different rates (de Queiroz 2007), local and regional analysis of ecology and population structure may identify behavioural or ecological dif-ferences that complement divergence studies. Use of nuclear markers in addition to mitochondrial markers reduces the process error associated with coalescence (Zink & Barrowclough 2008) and has led to an infor-mal set of genes sequenced frequently for phylogenetic studies including the mitochondrial cytochrome oxidase I (COI) (Avise 2000, Molina-Cruz et al. 2004, Sunghoon et al. 2011), nuclear white gene (Besansky & Fahey 1997, Reidenbach et al. 2009) and internal transcribed spacer (ITS)2 gene family (Zapata et al. 2007, Shultz & Wolf 2009, Wiemers et al. 2009). Within the mitochondrial ge-nome the more conservative “folmer region” has become the standard barcode fragment with a 3% divergence threshold for speciation events (Hebert et al. 2003).
The diversity of Neotropical anophelines has been attributed to the ability of dipterans to readily adapt to and utilise a broad variety of ecological niches (Grimaldi & Engel 2005) with more generalised populations being more ecologically heterogeneous (Bolnick et al. 2007). Thus, the genetic heterogeneity seen in the Triannulatus and Nuneztovari complexes may be explained, in part, by environmental heterogeneity (Gram & Sork 2001), including local or microgeographic adaptation, past and present ecological barriers and/or demographic events (Brouat et al. 2004). Additionally, information on the dynamics of larval anophelines is limited (Shililu et al. 2003) and may provide insights into population differ-ences, thereby complementing adult studies.
The purpose of this study was to examine the distri-bution, abundance and genetics of largely generalist and sympatric species from 76 larval sites to address the fol-lowing questions: (i) what is the level of habitat differen-tiation between species, (ii) do patterns of diversity in An. goeldii and An. triannulatus indicate a common cause and (iii) can genetic differentiation be explained by de-mographic phenomena and (or) geographic boundaries?
MATERIALS AND METHODS
Mosquito collection - Fourth instar anopheline lar-vae were collected from 13 localities, including eight in the state of Roraima (RR) in northern Amazonian Bra-zil and five in the state of Pará (PA) in eastern Amazo-nian Brazil (Fig. 1, Supplementary data). Sampling was done once for each randomly selected larval site. If the site was positive for anophelines, collections continued for an hour to measure relative species abundance. The study was conducted over three years (2009-2011) dur-ing malaria transmission season in each state. The larval sites in RR were located between Amajari and Ecuador, roughly 500 km along the RR-174, in 2009 and 2011, and in PA between Mojú and Marabá, approximately 560 km along PA-475/263/150 in 2010. The collection protocol was approved by the Evandro Chagas Institute, Pará State Ethical Committee and the New York State Department of Health, Institutional Review Board. Physical charac-teristics of the larval habitats were recorded. These in-cluded biotic factors such as temperature, alkalinity, pH,
conductivity, salinity and turbidity. Additionally, canopy coverage was estimated by spherical densitometer (Mi-nakawa et al. 2005).
Larvae were identified morphologically as An. trian-nulatus s.l. and An. nuneztovari using the key of Deane et al. (1946) and confirmed by species specific ITS2 restric-tion fragment length polymorphism (Zapata et al. 2007). Morphological keys do not reflect the recent differences between the Colombian and Venezuelan An. nuneztovari and the Brazilian An. goeldii, samples, therefore samples were sequenced and compared to those from Calado et al. (2008) using a Bayesian inference (BI) phylogenetic approach (data not shown). Total genomic DNA was ex-tracted using the DNeasy Blue Tissue Kit (Qiagen, CA, USA) and maintained at Griffin Laboratory at -80ºC.
Statistical analysis - A paired sample t test was used to compare An. triannulatus and An. goeldii larval oc-currence across all sites. Subsequent analysis of simi-lar simi-larval sites based upon the habitat type and type of water body sampled (pond, pool, swamp etc.), examined variation in larval densities using two-way analysis of variance (ANOVA). Additional analyses examining differences in habitat ecology, based on biotic factors, surrounding vegetation and canopy coverage were ex-amined to test the hypothesis that environmental hetero-geneity is positively correlated with genetic diversity.
Pharmacia/Biotech, NJ, USA) or PCR Supermix High Fidelity (GoTaq, Promega, CA) run on a Bio-Rad PTC-100 or 200 series thermal cycler (Bio-Rad Inc), using the conditions stipulated in Hebert et al. (2003). The Ap-plied Genomics Technology Core (Wadsworth Center) carried out the sequencing on an ABI PRISM 3700 au-tomated DNA sequencer. The forward and reverse COI sequences were aligned using Sequencher 3.0 (Gene Codes Corps, MI, USA), grouped together by sight and trimmed in MEGA v. 3.1 (Kumar et al. 2004) creating a 600-bp fragment. In addition, a subset of three-five An. triannulatus samples from each locality was sequenced following the protocol of Pedro and Sallum (2009), to yield a 449-bp fragment of the 3’ COI. High levels of intraspecific variation, deep structure and complex phy-logenies based on the 3’ end of the COI gene (Moreno et al. 2013) are not congruent with recently described spe-cies An. triannulatus, Anopheles haplophylus and An. triannulatus “C” (Silva-do-Nascimento & Lourenço- de-Oliveira 2002, Silva-do-Nascimento et al. 2006, 2011). The barcode region is more variable than the 3’ end of the COI (Ruiz-Lopez et al. 2012) and able to im-prove resolution at deeper nodes (Saunders & Le Gall 2010). Therefore, analyses herein focused on the barcode fragment and included only a subset based on the 3’ end to allow systematic comparisons of An. triannulatus populations across Brazil.
Nuclear genes were included to investigate the his-tory of the nuclear genome and provide independent evidence of population divergence (Loiaza et al. 2012). Additionally, nuclear genes do not suffer the short com-ings of mitochondrial markers (haploid, small genome size, short coalescent time, maternal inheritance) (Bal-lard & Whitlock 2004) and are not as biased in base composition (Brower & De Salle 1998). An 800-bp frag-ment of the white gene was amplified using the W2R and WF primers, with the PCR conditions as reported in Mirabello and Conn (2008). A 500-bp fragment of the ribosomal ITS2 was amplified using the primers 18S and 28S following the parameters in Li and Wilkerson (2005). The PCR products were cleaned, sequenced and aligned creating a 570-bp fragment of the white gene in-cluding the intron. The final product size for ITS2 was 433 bp and 371 bp for An. triannulatus and An. goel-dii, respectively. A single sequence per individual/gene was included in all subsequent analyses. Haplotypes of heterozygous individuals were inferred for each set of gene sequences using PHASE 2.1 software (Stephens et al. 2001, Stephens & Donnelly 2003, White et al. 2009). Unique sequences for all markers are available in Gen-Bank (accessions KC167670-KC167816).
Genealogical relationship - Genealogical trees for each species were estimated for the concatenated (COI + white) data set using BI analysis performed with Mr-Bayes v. 3.1 (Huelsenbeck & Ronquist 2001, Ronquist & Huelsenbeck 2003). Data were partitioned by gene using the model of nucleotide substitution (HKY+I and TrN+G for An. triannulatus and TrN+I+G and TPM2uf+G for An. goeldii) that best fit the white gene and COI, respec-tively, determined by jModelTest (Posada 2008). ITS2 sequences were excluded from these analyses because of
the limited sample size. The settings were two simultane-ous, independent runs of the Markov Chain Monte Carlo for two million generations, sampling every 1,000 gen-erations with a “burnin” of 25%. The outgroup Anophe- les marajoara (DQ076221 and AY956296 deposited in GenBank) was chosen based upon its phylogenetic posi-tion in Sallum et al. (2000).
Genetic variation - Genetic structure of multiple populations based on statistical parsimony groupings were examined by analysis of molecular variance (AM-OVA) using Arlequin v. 3.1.1 (Excoffier et al. 2005) and spatial analysis of molecular variance (SAMOVA), v. 1.0 (Dupanloup et al. 2002). Both algorithms were used to cluster the 600-bp barcode fragment data into geneti-cally and in the case of SAMOVA, geographigeneti-cally, ho-mogeneous populations by generating F statistics (FSC, FST, FCT). Each species was analysed separately, An. triannulatus into groups of K = 2-16 and An. goeldii into groups of K = 2-20, with 1,000 simulated anneal-ing steps from each of 100 sets of initial startanneal-ing condi-tions. Groups were based on individual larval sites. A second analysis was undertaken for An. triannulatus us-ing the 449-bp fragment haplotypes of Pedro and Sallum (2009) (GU445849-899 and AF417702) combined with the samples in the present study, to test their hypothesis of geographical sub-structuring within the species based on five populations across Brazil.
Population structure and demographic history - A statistical parsimony network (SPN) estimated genealog-ical relationships among haplotypes with a 95% identity for each marker using TCS 1.13 (Clement et al. 2000), except An. goeldii ITS2 sequences, which were exam-ined at 94% sequence similarity. Homoplasy in all net-works was resolved using the algorithm estimation rules in Crandall and Templeton (1993). Estimates of time to coalescence were calculated for the COI fragment only and compared using θS values (Watterson 1975).
The differentiation and polymorphism statistics for COI and white gene sequences by species and local-ity were computed in DnaSP, v. 5.0 (Librado & Rozas 2009). Because of the high proportion of shared haplo-types among habitats within a single locality, samples from an individual town/city were pooled to more accu-rately represent diversity statistics. Furthermore, haplo-type distributions across four ecoregions were examined for each of the seven environmental variables to test the hypothesis that climatic differences sustain (and drive) diversity (Hoorn et al. 2010). To test this hypothesis, we considered both the availability of breeding sites and haplotype diversity as measures of gene flow. Individual sites were grouped within ecoregions, based on descrip-tions from Rosa-Freitas et al. (2007).
expansion. Statistically significant differences between observed and simulated distributions were evaluated with the sum of square deviations to reject the hypoth-esis of demographic expansion (Zarza et al. 2008). Dates of population expansion were estimated for the COI gene with the formula T = τ/2u (Rogers & Harpending 1992) using 10 generations per year and the mutation rate of Drosophila estimated at 1 × 10⁻⁸ substitutions per site per year (Walton et al. 2000, Yang et al. 2011).
RESULTS
Site diversity and larval abundance - Larvae were predominantly collected from the edges of naturally oc-curring ponds, comprising 49.19% (n = 200) of the total Anopheles identified. An. goeldii and An. triannulatus larvae were relatively uncommon in collections from seepages, stream margins and swamps, where they com-prised only 10.9% of the total. Both species were col-lected from the same site 17 times (Supplementary data). Twelve sites contained An. triannulatus and not An. goeldii, whereas 13 sites contained An. goeldii, but not An. triannulatus. A large proportion, 68.97% (n= 140), of An. triannulatus larvae were sampled from ponds. An. goeldii larvae appeared equally likely to inhabit ar-tificial pools (37.93%, n= 77), ponds (29.55%, n= 60) and temporary ditches (25.12%, n= 51). No correlations between abundance and habitat type for either species were detected by ANOVA (data not shown).
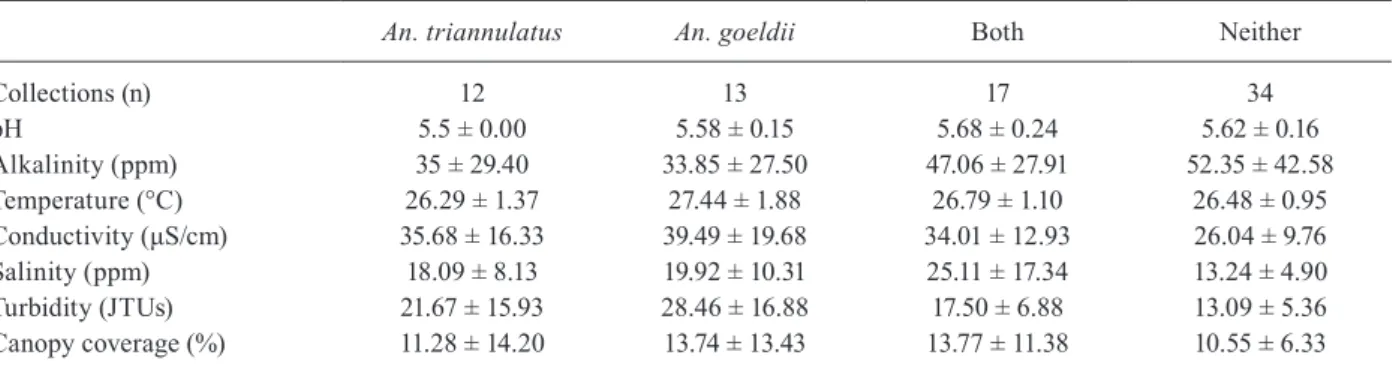
Habitat characteristics of An. triannulatus and An. goeldii were similar: the 76 sites were not differentiated by larval abundance (t = -0.2980, df = 42, p = 0.3836). ANOVA detected a significant difference in turbid-ity between sites containing only An. goeldii and those negative for either species (F = 4.89, p = 0.032) that was not supported by a t test (t = 1.179, df = 16, p = 0.055). There are no other significant differences between en-vironmental variables for sites unique for either species and sites either positive or negative for both (Table I).
Genealogical relationship - The concatenated (COI + white gene with intron) BI tree for An. triannulatus, with 50 parsimoniously informative sites, indicated two strongly supported (97 and 98 posterior probabilities)
distinct populations of An. triannulatus (Fig. 2). The two populations correspond to the Brazilian states, with the exception of samples from Mojú and Goianésia (9 and 10, respectively), that were included in the northern group (RR localities). The close relationship between the RR samples and localities Mojú and Goianésia was also evident in the SPN. This may indicate a historical boundary separating north and south populations, with the northern limit occurring just south of the Amazon River and including parts of Goianésia and Mojú. The more derived population 1 corresponds to localities in the Amazon Basin, near the hypothesised population origin (Pedro & Sallum 2009), with the majority of
pop-TABLE I
Characteristics (± 95% confidence intervals) of habitats with Anopheles triannulatus only, Anopheles goeldii only, both species or neither species present
An. triannulatus An. goeldii Both Neither
Collections (n) 12 13 17 34
pH 5.5 ± 0.00 5.58 ± 0.15 5.68 ± 0.24 5.62 ± 0.16
Alkalinity (ppm) 35 ± 29.40 33.85 ± 27.50 47.06 ± 27.91 52.35 ± 42.58
Temperature (°C) 26.29 ± 1.37 27.44 ± 1.88 26.79 ± 1.10 26.48 ± 0.95
Conductivity (μS/cm) 35.68 ± 16.33 39.49 ± 19.68 34.01 ± 12.93 26.04 ± 9.76
Salinity (ppm) 18.09 ± 8.13 19.92 ± 10.31 25.11 ± 17.34 13.24 ± 4.90
Turbidity (JTUs) 21.67 ± 15.93 28.46 ± 16.88 17.50 ± 6.88 13.09 ± 5.36
Canopy coverage (%) 11.28 ± 14.20 13.74 ± 13.43 13.77 ± 11.38 10.55 ± 6.33
ulation 2 occurring along one of the proposed routes of lineage expansion. Within grouping 2, smaller subdivi-sions, related to geography and corresponding to popula-tions 2 and 3, were apparent between haplotypes 9 and 3 that are separated by six mutations and two haplotypes 4 and 1, separated by two mutations (Fig. 3).
The concatenated (COI + white gene with intron) BI tree for An. goeldii, with 32 parsimoniously informa-tive sites, indicated two moderately supported (72 and 68 posterior probabilities) populations which correspond to the Brazilian states (Fig. 2). Unlike An. triannulatus, there does not appear to be any sub-structuring in the samples from PA or support for a separate Goianésia/ Mojú population.
Genetic variation - AMOVA indicated consistently higher FST and FCT fixation indices across genes and various COI groupings for An. triannulatus, i.e., ge-netic structuring among and within localities rather than between groups (Table II). However, there was strong genetic differentiation (41.01%) also seen in the COI grouping between states, which correlates well with the groups defined by the Bayesian tree.
The small genetic differentiation of An. goeldii be-tween localities suggests panmixia with no significant barriers to gene flow within individual states. AMOVA indicated a large proportion of variation between the two states and among samples from different breeding site types in a given locality (Table II). Genetic structuring in the latter may indicate environmental differences and niche partitioning as drivers of diversity.
SAMOVA analysis for both species found no evidence of a geographic barrier. The addition of the An. triannula-tus 449-bp fragment of the COI gene (n = 35) to all sam-ples from Pedro and Sallum (2009) was unable to replicate the five groupings originally described across Brazil.
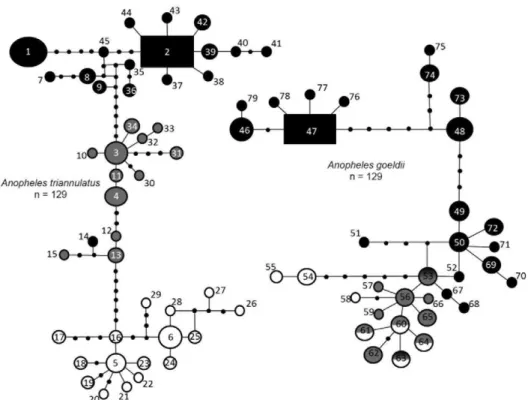
Population structure and demographic history - Analysis of mitochondrial data from 129 An. triannu-latus and 133 An. goeldii specimens (Fig. 3) led to the discovery of two very different demographic histories between these sympatric species, which often co-occur within the same larval habitats. The time of the begin-ning of lineage divergence was calculated following Da/2k, where Da is the average nucleotide divergence between lineages and 2k is the divergence rate (Heckel et al. 2005). We utilised the mutation rate of Drosophila (Walton et al. 2000, Yang et al. 2011) to estimate these parameters and their significance based on the coa-lescence (DnaSP v. 5.10) (Librado & Rozas 2009) and MEGA v. 5.1 (Tamura et al. 2011).
A parsimony network for An. triannulatus indicated that a minimum of six mutational steps separate three potential populations based on geography (Fig. 3). The most common haplotypes were 1 (n = 18), 2 (n = 15), 3 (n = 11) and 6 (n = 9) (Fig. 3), with seven haplotypes (15.6%) shared among localities and 38 (84.4%) unique (Supplementary data). Overall, An. triannulatus was consistent with a category I phylogeographic pattern (Avise 2000) characterised by pronounced genetic gaps between spatially circumscribed haplogroups. A high proportion of singletons (23, 51.1%), in addition to
dividual populations within An. triannulatus containing star-shaped nodes (surrounding haplotypes 2, 3 and 5), supports demographic expansions, background selec-tion or selective sweeps (Slatkin & Hudson 1991, Fu 1997). Based upon the 600-bp fragment, Dabetween the northern and southern states is 0.0118 [standard devia-tion (SD) = 0.003]. Therefore, the estimated divergence is 437,500-737,500 years ago, in the Pleistocene. The two PA populations had a Da = 0.014 (SD = 0.004), indicat-ing more ancestral divergence (congruent with Bayesian tree), approximately 500,000-900,000 years ago.
An. goeldiiCOI is consistent with a category III phy-logeographic pattern (Avise 2000) where most haplotypes are closely related, yet some geographic localisation ex-ists. The most common haplotypes were 46 (n = 21), 47 (n = 33) and 48 (n = 13) (Fig. 3), with 14 haplotypes (41.2%) shared among localities, and 20 (58.8%) unique (Supple-mentary data). Similar to An. triannulatus, there was a relatively high proportion of singletons (14, 41.2%), in-dicating a demographic expansion, background selection or selective sweep (Slatkin & Hudson 1991, Fu 1997), particularly in PA (singletons arising from haplotype 56). In contrast, haplotypes from RR exhibited longer branch-es, missing haplotypes and a near equal distribution of shared haplotypes and single mutations, consistent with a signal of an older lineage with balancing selection (Fig. 3). Dabetween northern and southern states is 0.008 (SD = 0.002). Therefore, the estimated divergence is 316,000-516,500 years ago (Pleistocene).
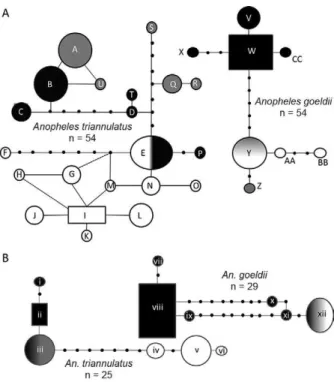
Networks of An. triannulatus nuclear data (white gene and ITS2) indicate a history of contractions and expansions. Similar to the COI gene, the ITS2 network depicts a category I pattern whereas the white gene re-veals a much more homogeneous haplotype distribution. Overall, the white gene follows a category II intraspecific pattern, with pronounced gaps between some branches and some clustering of anciently separated geographic populations (Fig. 4).
TABLE II
Analysis of molecular variance calculations for inter and intravariation among species and populations for various markers
Anopheles triannulatus Anopheles goeldii
Gene Source of variation
Variance (%)
Fixation index
Variance (%)
Fixation index
COI Between RR and PA 41.01 FCT = 0.41a 45.12 F
CT = 0.45
b
Among localities within states 29.23 FSC = 0.50b 5.29 F
SC = 0.10
b
Within a given locality 29.76 FST = 0.70b 49.59 F
ST = 0.50
b
white Between RR and PA -3.01 FCT = -0.03c 89.46 F
CT = 0.89
a
Among localities within states 58.62 FSC = 0.57b 0.42 F
SC = 0.04
c
Within a given locality 44.38 FST = 0.56b 10.12 F
ST = 0.90
b
COI Between SPN populations 38.85 FCT = 0.39c -
-Among localities 33.92 FSC = 0.55b -
-Within a given locality 27.23 FST = 0.73b -
-a: p < 0.05; b: p < 0.001; c: not significant; COI: cytochrome oxidase I; PA: state of Pará; RR: state of Roraima; SPN: statistical parsimony network derived groupings.
of the COI sequences found haplotype and nucleotide di-versity was greater among An. triannulatus populations (Supplementary data) in contrast to An. goeldii.
Genetic polymorphism analyses of the COI sequenc-es indicated that haplotype and nucleotide diversity was greater among An. triannulatus populations (Supple-mentary data) in contrast to An. goeldii. The white gene exhibited lower nucleotide diversities compared to COI, but surprisingly An. triannulatus continued to demon-strate high haplotype diversity (Supplementary data), which combined with relatively low nucleotide diversity may signal a rapid expansion (Avise 2000, de Jong et al. 2011). High COI variation between states and geograph-ic populations is strongly supported by population dif-ferentiation statistics (Table III), although the GST values were low, suggesting a history of gene flow (Table III).
In general, neutrality tests were negative for both species (Table IV), suggesting an excess of rare poly-morphisms consistent with either negative/positive se-lection or an increase in population size, although only one of these tests (Fs) was significant for An. triannu-latus, i.e., populations 2 and 3. Mismatch distribution for sudden expansions did not support this finding and, instead, revealed marginally significant expansion pat-terns for only population 1, corresponding to RR. Sud-den and spatial populations for An. goeldii could not be rejected (Fig. 5). Estimated expansions for both species are during the Pleistocene, An. triannulatus 129,693 years ago (59,857-194,877) and An. goeldii 112,387 years ago (17,111-187,449).
DISCUSSION
Distribution patterns of mosquito species are depen-dent on the availability of suitable aquatic habitats (Grillet 2000). Overlapping geographic distributions, in addition to the absence of significant difference in species abun-dance across sampled habitats, suggest that An. goeldii is a suitable comparison species for An. triannulatus. The lack of any significant differentiation between sympatric habitats, to those unique to a species or absent of either, suggests these species may be more broadly adapted (Eisenberg et al. 2000, Chase & Knight 2003). However, co-occurrence of species does not imply the same ability to exploit shared habitats (Diabate et al. 2005).
The combined sequence results support distinct de-mographic histories for the two species despite similar distribution and larval habitat co-occurrence. Across molecular markers An. goeldii consistently depicts two moderately supported populations corresponding to the two Brazilian states, however, An. triannulatus appears to have undergone historical fragmentation, subsequent secondary contact and homogenisation followed by more recent divergence due to allopatry. Either environmental changes (e.g., habitat availability and climatic oscilla-tions) alone cannot account for population divergence or differences in biology allow these two species to respond differently to climatic oscillations.
The clear separation of populations based on Brazil-ian states in An. goeldii strongly supports the alternative hypothesis of geographic isolation driving divergence rather than environmental changes. While often
contest-ed in the neotropics, the Pleistocene refugia hypothesis (Haffer 1969) postulates that climatic fluctuations result-ed in the fragmentation of continuous forest into refuges separated by expanses of grass-dominated savannah or desert. Alternatively, the Miocene marine incursion hy-pothesis suggests sea level changes during the late Ter-tiary (23.7-1.8 million years ago) created three isolated regions: the Brazilian Shield, the Guiana Shield and the eastern Andean slopes (Webb 1995, Bates 2001, Hoorn et al. 2010). The last commonly explored mechanism of divergence is the riverine barrier hypothesis, where ma-jor rivers act as barriers to gene flow, thus promoting speciation between populations on either side (Wallace 1852, Aleixo 2004, Mirabello & Conn 2008).
Although no boundary was indicated by SAMOVA, this does not discount the possibility that an historical boundary existed, separating north and south popula-tions. Although one study found evidence for waterways over 4 km wide being complete barriers to gene flow (Pedro & Sallum 2009), others have determined that the Amazon is not an effective barrier (Fairley et al. 2002, Mirabello & Conn 2008) and that geographic distance and/or differing demographic histories may be the main forces responsible for partitioning genetic variation (Mirabello & Conn 2008).
The discrepancy regarding the inclusion of Mojú and some of Goianésia among An. triannulatus RR popula-tion, but their inclusion with geographically similar PA samples in An. goeldii may be attributed to individual species’ responses to dispersal opportunities (Brouat et al. 2004). The two An. triannulatus populations identi-fied in Goianésia could also be the result of a suture zone.
TABLE III
Inter and intrapopulation differentiation of Anopheles triannulatus and Anopheles goeldii populations
based on statistical parsimony network Comparison
An. triannulatus An. goeldii
RR vs. PA Three populations RR vs. PA
HS 0.89a 0.86a 0.86a
KS* 1.77a 1.41a 1.60a
Z* 7.43a 7.00a 7.83a
Snn 0.99a 1.00a 0.97a
χ2 129a 258a 125.84a
GST 0.06 0.09 0.045
Kt 10.09 10.09 7.43
a: p < 0.0001; GST: genetic differentiation; HS: genetic differen-tiation based on haplotype data; KS*: differentiation based on sequence data; Kt: average number of nucleotide differences; n: number of total individuals compared; PA: state of Pará; RR: state of Roraima; Snn: measures how often the nearest neighbours of sequences are found in the same population; χ2:
Geographic boundaries/distance, variation in dispersal activity and ecological range may each contribute to the distinct patterns of divergence seen in An. triannulatus and An. goeldii. As species complexes are common in anophelines, additional studies are needed to resolve the extent of divergence. Continued studies using multiple markers at a local and continental scale will resolve the status of speciation and may clarify what role, if any, a given population, lineage or species has on malaria transmission, because population differences influence peak biting times, feeding preferences and vectorial ca-pacity (Lounibos & Conn 2000).
ACKNOWLEDGEMENTS
To Dr Povoa’s research group, at Evandro Chagas Institute, and to Dr Freddy Ruiz, Walter Reed Army Institute of Research, for assistance in mosquito collection and logistics, and to Sara Bickersmith, Wadsworth Center, New York State Department of Health, and Dr Jose Loiaza, Smithsonian Tropical Research Institute, for comments and assistance interpreting results.
REFERENCES
Akhavan D, Musgrove P, Abrantes A, d’A Gusmão R 1999. Cost-ef-fective malaria control in Brazil. Cost-efCost-ef-fectiveness of a Malaria Control Program in the Amazon basin of Brazil, 1988-1996. Soc Sci Med 49: 1385-1399.
Aleixo A 2004. Historical diversification of a terra-firme forest bird super species: a phylogeographic perspective on the role of dif-ferent hypotheses of Amazonian diversification. Evolution 58: 1303-1317.
Avise JC 2000. Phylogeography. The history and formation of spe-cies, University Press, Massachusetts, 447 pp.
Ballard JWO, Whitlock MC 2004. The incomplete natural history of mitochondria. Mol Ecol13: 729-744.
Barreto ML, Teixeira MG, Bastos FI, Ximenes RAA, Barata RB, Ro-drigues LC 2009. Sucessos e fracassos no controle de doenças infecciosas no Brasil: o contexto social e ambiental, políticas, intervenções e necessidades de pesquisa. Available from: down-load.thelancet.com/flatcontentassets/pdfs/brazil/brazilpor3.pdf.
Barton NH, Hewitt GM 1985. Analysis of hybrid zones. Annu Rev Ecol Syst 16: 113-148.
TABLE IV
Multiple statistical analyses evaluating the probability for a recent population expansion
Species n DT Da Fa F
S R2
Anopheles triannulatus 129 -0.22187 -1.28038 -0.99732 -10.329a 0.08650
Roraima 57 -0.37846 -1.32424 -1.17022 -1.488 0.09200
Pará 72 -0.47543 -0.97094 -0.93438 -5.842 0.08900
Population 1 56 -0.08718 -1.11433 -0.88956 -1.209 0.10200
Population 2 36 -1.06921 -0.55581 -0.85324 -3.582a 0.07770
Population 3 37 -1.02686 -0.40080 -0.71980 -4.809a 0.07800
Anopheles goeldii 133 -0.30013 -1.24177 -1.01960 -5.867 0.08260
Roraima 103 0.06971 -1.6295 -1.1537 -1.677 0.0989
Pará 30 -0.0415 0.15645 0.11023 -3.321 0.1185
a: significance, p < 0.50; D: Fu and Li’s D (Fu 1993); DT: Tajima’s D (Tajima 1989); F: Fu and Li’s F (Fu 1993); FS: Fu’s Fs (Fu 1997); n: sample size; R2: Ramos-Onsin’s and Roza’s R2 (Ramos-Onsins & Rozas 2002).
Species dispersal activity and differential selection can cause hybrid zones to appear mobile and settle as bound-aries between environments or in regions of low popula-tion density (Barton & Hewitt 1985, Mallet 1993, 2010). Suture zones that span several species suggest divergence was driven by a common influence of environmental change (Morgan et al. 2010). Further evaluation of spe-cies in the Goianésia area could resolve the contribution of environmental change to population diversity.
Overlapping geographic distributions, in addition to the absence of significant difference in species abun-dance across sampled habitats, implies little habitat differentiation between species and a broad ecological range. Although biological differences may drive di-vergence uniquely in each of these sympatric species, a common cause for diversity patterns cannot be ruled out.
Fig. 5: representative mismatch distributions with calculated τ and
Bates JM 2001. Avian diversification in Amazonia: evidence for his-torical complexity and a vicariance model for a basic diversifica-tion pattern. In I Viera, MA D’Incao, JM Cardoso da Silva, D Oren (eds.), Diversidade biológica e cultural da Amazônia, Mu-seu Paraense Emílio Goeldi, Belém, p. 11-9138.
Besansky NJ, Fahey GT 1997. Utility of the white gene in estimating phylogenetic relationships among mosquitoes (Diptera: Culici-dae). Mol Biol Evol 14: 442-454.
Bolnick DI, Svanback R, Araujo MS, Persson L 2007. Comparative support for the niche variation hypothesis that more generalized populations also are more heterogeneous. Proc Natl Acad Sci USA104: 10075-10079.
Bourke BP, Foster PG, Bergo ES, Calado DC, Sallum MAM 2010. Phylogenetic relationships among species of Anopheles ( Nysso-rhynchus) (Diptera, Culicidae) based on nuclear and mitochon-drial gene sequences. Acta Trop 114: 88-96.
Brochero H, Pareja PX, Ortiz G, Olano VA 2006. Breeding places and biting activity of Anopheles species in the municipality of Cimi-tarra, Santander, Colombia. Biomedica 26: 269-277.
Brouat C, Chevallier H, Meusnier S, Noblecourt T, Rasplus JY 2004. Specialization and habitat: spatial and environmental effects on abundance and genetic diversity of forest generalist and specialist Carabus species. Mol Ecol 13: 1815-1826.
Brower AVZ, De Salle R 1998. Patterns of mitochondrial versus nu- clear DNA sequence divergence among nymphalid butterflies: the utility of wingless as a source of characters for phylogenetic inference. Insect Mol Biol 7: 73-82.
Calado DC, Foster PG, Bergo ES, dos Santos CLS, Galardo AKR, Sallum MAM 2008. Resurrection of Anopheles goeldii from synonymy with Anopheles nuneztovari (Diptera, Culicidae) and a new record for Anopheles dunhami in the Brazilian Amazon. Mem Inst Oswaldo Cruz 103: 791-799.
Chase JM, Knight TM 2003. Drought-induced mosquito outbreaks in wetlands. Ecol Lett 6: 1017-1024.
Clement M, Posada D, Crandall KA 2000. TCS: a computer program to estimate gene genealogies. Mol Ecol 9: 1657-1659.
Cohuet A, Harris C, Robert V, Fontenille D 2010. Evolutionary forces on Anopheles: what makes a malaria vector. Trends Parasitol 26: 130-136.
Costantini C, Ayala D, Guelbeogo WG, Pombi M, Some CY, Bassole IHN, Ose K, Fosting JM, Sagnon NF, Fontenille D, Besansky NJ, Simard F 2009. Living at the edge: biogeographic patterns of habitat segregation conform to speciation by niche expansion in Anopheles gambiae. BMC Ecol 9: 16.
Crandall KA, Templeton AR 1993. Empirical tests of some preditions from coaslescent theory with applications to intraspecific phyl-ogeny reconstruction. Genet 134: 959-969.
da Silva-Nunes M, Moreno M, Conn JE, Gamboa D, Abeles S, Vinetz JM, Ferreira MU 2011. Amazonian malaria: asymptomatic hu-man reservoirs, diagnostic challenges, environmentally driven changes in mosquito vector populations and the mandate for sus-tainable control strategies. Acta Trop 121: 281-291.
de Barros FSM, de Aguiar DB, Rosa-Freitas MG, Luitgards-Moura JF, da Costa Gurgel H, Honorio NA, de Arruda ME, Tsouris P, Vasconcelos SD 2007. Distribution summaries of malaria vectors in the northern Brazilian Amazon. J Vector Ecol 32: 161-167.
de Jong MA, Wahlberg N, van Eijk M, Brakefield PM, Zwaan BJ 2011. Mitochondrial DNA signature for range-wide populations of Bicyclus anynana suggests a rapid expansion from recent refu-gia. PLoS ONE 6: e21385.
de Queiroz K 2007. Species concepts and species delimitation. Syst Biol 56: 879-886.
Deane LM, Causey OR, Deane MP 1946. An illustrated key by adult female characteristics for identification of thirty-five species of Anophelini with notes on the malaria vectors (Diptera: Culici-dae). In Studies on Brazilian anophelines from the Northeast and Amazon Regions, monographic series 18, The American Journal of Hygiene, Baltimore, p. 1-18.
Diabate A, Dabire RK, Kim EH, Dalton R, Millogo N, Baldet T, Si-mard S, Gimnig JE, Hawley WA, Lehmann T 2005. Larval devel-opment of the molecular forms of Anopheles gambiae (Diptera: Culicidae) in different habitats: a transplantation experiment. J Med Entomol 42: 548-553.
Dupanloup I, Schneider S, Excoffier L 2002. A simulated annealing approach to define the genetic structure of populations. Mol Ecol 11: 2571-2581.
Eisenberg JNS, Washburn JO, Schreiber SJ 2000. Generalist feeding behaviors of Aedessierrensis larvae and their effects on proto-zoan populations. Ecology 81: 921-935.
Excoffier L, Laval G, Schmeider S 2005. Arlequin version 3.0: an integrated software package for population genetic data analysis. Evol Bioinform Online 1: 47-50.
Fairley TL, Póvoa MM, Conn JE 2002. Evaluation of the Amazon River delta as a barrier to gene flow for the regional malaria vec-tor, Anopheles aquasalis (Diptera: Culicidae) in northeastern Brazil. J Med Entomol 39: 861-869.
Faran ME 1980. Mosquito studies (Diptera, Culicidae). XXXIV. A revision of the Albimanus section of the subgenus Nyssorhynchus of Anopheles. Contrib Amer Ent Inst 15: 1-215.
Faran ME, Linthicum KJ 1981. A handbook of the Amazonian spe-cies of Anopheles (Nyssorhynchus) (Diptera: Culicidae). Mosq Syst 13: 1-81.
Folmer O, Black M, Hoeh W, Lutz R, Vrijenhoek R 1994. DNA prim-ers for amplification of mitochondrial cytochrome c oxidase subunit I from diverse metazoan invertebrates. Mol Mar Biol Biotechnol 3: 294-297.
Forattini OP 1962. Entomologia médica, Vol. 1, Universidade de São Paulo, São Paulo, 416 pp.
Fu YX 1993. Statistical tests of neutrality of mutations. Genetics 133: 693-709.
Fu YX 1997. Statistical tests of neutrality of mutations against popu-lation growth, hitchhiking and background selection. Genetics 147: 915-925.
Galardo AKR, Arruda M, D’Almeida, Couto AAR, Lounibos LP, Zimmerman R 2007. Malaria vector incrimination in three rural riverine villages in the Brazilian Amazon. Am J Trop Med Hyg 76: 461-469.
Gram WK, Sork VL 2001. Association between environmental and genetic heterogeneity in forest tree populations. Ecology 82: 2012-2021.
Grillet ME 2000. Factors associated with distribution of Anopheles aquasalis and Anopheles oswaldoi (Diptera: Culicidae) in a ma-larious area, northeastern Venezuela. J Med Entomol 37: 231-238.
Grimaldi D, Engel MS 2005. Evolution of the insects, Cambridge Uni-versity Press, Cambridge, 772 pp.
Haffer J 1969. Speciation in Amazonian forest birds. Science 165: 131-137.
Hebert PDN, Cywinska A, Ball SL, de Waard JR 2003. Biological identifications through DNA barcodes. Proc R Soc Lond B Biol Sci 270: 313-321.
Heckel G, Burri R, Fink S, Desmet JF, Excoffier L 2005. Genetic structure and colonization processes in European populations of the common vole, Microtus arvalis. Evolution59: 2231-2242.
Hoorn C, Wesselingh FP, ter Steege H, Bermudez MA, Mora A, Sevink J, Sanmartín I, Sanchez-Meseguer A, Anderson CL, Figueiredo JP, Jaramillo C, Riff D, Negri FR, Hooghiemstra H, Lundberg J, Stadler T, Sarkinen T, Antonelli A 2010. Amazonia through time: Andean uplift, climate change, landscape evolution and biodiversity. Science 330: 927-931.
Huelsenbeck JP, Ronquist F 2001. MrBayes: Bayesian inference of phylogeny. Bioinformatics 17: 754-755.
Kumar S, Tamura K, Nei M 2004. MEGA3: integrated software for molecular evolutionary genetics analysis and sequence align-ment. Brief Bioinform 5: 150-163.
Li C, Wilkerson RC 2005. Identification of Anopheles (Nyssorhyn-chus)albitarsis complex species (Diptera: Culicidae) using rDNA internal transcribed spacer 2-based polymerase chain reaction primes. Mem Inst Oswaldo Cruz 100: 495-500.
Librado P, Rozas J 2009. DnaSP v. 5: a software for comprehen-sive analysis of DNA polymorphism data. Bioinformatics 25: 1451-1452.
Loaiza JR, Bermingham E, Sanjur OI, Scott ME, Bickersmith SA, Conn JE 2012. Review of genetic diversity in malaria vectors (Culicidae: Anophelinae). Infect Genet Evol12: 1-12.
Lounibos LP, Conn JE 2000. Malaria vector heterogeneity in South America. Am Entomol 46: 238-249.
Mallet J 1993. Speciation, raciation and color pattern evolution in Heliconius butterflies: evidence from hybrid zones. In RG Har-rison, Hybrid zones and the evolutionary process, Oxford Uni-versity Press, New York, p. 226-260.
Mallet J 2010. Shift happens! Shifting balance and the evolution of di-versity in warning colour and mimicry. Ecol Entomol 35: 90-104.
McKeon SN, Schlichting CD, Povoa MM, Conn JE 2013. Ecological suitability and spatial distribution of five Anopheles species in Amazonian Brazil. Am J Trop Med Hyg88: 1079-1086.
Minakawa N, Munga S, Atieli F, Mushinzimana E, Goufa Zhou, Githeko AK, Yan G 2005. Spatial distribution of anopheline lar-val habitats in western Kenyan highlands: effects of land cover types and topography. Am J Trop Med Hyg 73: 157-165.
Mirabello L, Conn JE 2008. Population analysis using the nuclear white gene detects Pliocene/Pleistocene lineage divergence with-in Anopheles nuneztovari in South America. Med Vet Entomol 22: 109-119.
Molina-Cruz A, de Mérida AM, Mill K, Rodríguez F, Schoua C, Yurrita MM, Molina E, Palmieri M, Black WC 2004. Gene flow among Anopheles albimanus populations in Central America, South America and the Caribbean assessed by microsatellites and mitochondrial DNA. Am J Trop Med Hyg 71: 350-359.
Montoya-Lerma J, Solarte YA, Giraldo-Calderón GI, Quiñones ML, Ruiz-López F, Wilkerson RC, González R 2011. Malaria vector species in Colombia - A review. Mem Inst Oswaldo Cruz 106 (Suppl. I): 223-238.
Moreno M, Bickersmith S, Harlow W, Hildebrandt J, McKeon SN, Silva-do-Nascimento TF, Loaiza JR, Ruiz F, Lourenço-de-Olivei-ra R, Sallum MAM, Bergo ES, Fritz GN, Wilkerson RC, Linton
YM, Dantur Juri MJ, Rangel Y, Povoa MM, Gutierrez-Builes LA, Correa MM, Conn JE 2013. Phylogeography of the neotropical Anopheles triannulatus complex (Diptera: Culicidae) supports deep structure and complex patterns. Parasit Vectors6: 47.
Morgan K, Linton YM, Somboon P, Saikia P, Dev V, Socheat D, Walton C 2010. Inter-specific gene flow dynamics during the Pleistocene-dated speciation of forest-dependent mosquitoes in Southeast Asia. Mol Ecol 19: 2269-2285.
Moutinho PR, Gil LHS, Cruz RB, Ribolla PEM 2011. Population dy-namics, structure and behavior of Anopheles darlingi in a rural set-tlement in the Amazon rainforest of Acre, Brazil. Malar J 10: 174.
MS - Ministério da Saúde 2008. Situação epidemiológica da Malária no Brasil 2008. [cited 2012 Aug 8]. Available from: portal.saude. gov.br/portal/arquivos/pdf/folder_malaria_2008_final.pdf.
Pedro PM, Sallum MA 2009. Spatial expansion and population struc-ture of the Neotropical malaria vector, Anopheles darlingi (Dip-tera: Culicidae). Biol J Linn Soc 97: 854-866.
Posada D 2008. jModelTest: Phylogenetic model averaging. Mol Biol Evol 25: 1253-1256.
Póvoa MM, Wirtz RA, Lacerda RNL, Miles MA, Warhurst D 2001. Ma-laria vectors in the municipality of Serra do Navio, state of Amapá, Amazon Region, Brazil. Mem Inst Oswaldo Cruz 96: 179-184.
Ramos-Onsins SE, Rozas J 2002. Statistical properties of new neutral-ity tests against population growth. Mol Biol Evol 19: 2092-2100.
Reidenbach KR, Cook S, Bertone MA, Harbach RE, Wiegmann BM, Besansky NJ 2009. Phylogenetic analysis and temporal diversifi-cation of mosquitoes (Diptera: Culicidae) based on nuclear genes and morphology. BMC Evol Biol9: 298.
Rogers AR, Harpending H 1992. Population growth makes waves in the distribution of pairwise genetic differences. Mol Biol Evol 9: 552-569.
Ronquist F, Huelsenbeck JP 2003. MrBayes 3: Bayesian phylogenetic inference under mixed models. Bioinformatics 19: 1572-1574.
Rosa-Freitas MG, Lourenço-de-Oliveira R, de Carvalho-Pinto CJ, Flores-Mendoza C, Silva-do-Nascimento TF 1998. Anopheline species complexes in Brazil. Current knowledge of those related to malaria transmission. Mem Inst Oswaldo Cruz 93: 651-655.
Rosa-Freitas MG, Tsouris P, Peterson AT, Honório NA, de Barros FSM, de Aguiar DB, Gurgel HC, de Arruda ME, Vasconcelos SD, Luitgards-Moura JF 2007. An ecoregional classification for the state of Roraima, Brazil. The importance of landscape in ma-laria biology. Mem Inst Oswaldo Cruz 102: 349-357.
Rubio-Palis Y l994. Variation of the vectorial capacity of some anoph-elines in western Venezuela. Am J Trop Med Hyg 50: 420-424.
Ruiz-Lopez F, Wilkerson RC, Conn JE, McKeon SN, Levin DM, Qui-ñones ML, Póvoa MM, Linton YM 2012. DNA barcoding reveals both known and novel taxa in the Albitarsis group (Anopheles: Nys-sorhynchus) of Neotropical malaria vectors. Parasit Vectors5: 44.
Sallum MAM, Marrelli MT, Nagaki SS, Laporta GZ, dos Santos CLS 2008. Insight into Anopheles (Nyssorhynchus) (Diptera: Culici-dae) species from Brazil. J Med Entomol 45: 970-981.
Sallum MAM, Schultz TR, Wilkerson RC 2000. Phylogeny of anoph-elinae (Diptera: Culicidae) based on morphological characters. Ann Entomol Soc Am93: 745-775.
Saunders GW, Le Gall L 2010. Editorial. Cryptogamie Algol 31: 373-375.
Schultz J, Wolf M 2009. ITS2 sequence-structure analysis in phylo-genetics: a how-to manual for molecular systematics. Mol Phylo-genet Evol 52: 520-523.
Shililu J, Ghebremeskel T, Seulu F, Mengistu S, Fekadu H, Zer-om M, Ghebregziabiher A, Sintasath D, Bretas G, Mbogo C, Githure J, Brantly E, Novak R, Beier JC 2003. Larval habitat diversity and ecology of anopheline larvae in Eritrea. J Med Entomol40: 921-929.
Silva-do-Nascimento TF, Lourenço-de-Oliveira R 2002. Anopheles halophylus, a new species of the subgenus Nyssorhynchus (Dip-tera: Culicidae) from Brazil. Mem Inst Oswaldo Cruz 97: 801-811.
Silva-do-Nascimento TF, Pitaluga LDR, Peixoto AA, Lourenço-de-Oli- veira R 2011. Molecular divergence in the timeless and cpr genes among three sympatric cryptic species of the Anopheles triannula-tus complex. Mem Inst Oswaldo Cruz 106 (Suppl. I): 218-222.
Silva-do-Nascimento TF, Wilkerson RC, Lourenço-de-Oliveira R, Monteiro FA 2006. Molecular confirmation of the specific status of Anopheles halophylus (Diptera: Culicidae) and evidence of a new cryptic species within An. triannulatus in central Brazil. J Med Entomol 43: 455-459.
Slatkin M, Hudson RR 1991. Pairwise comparisons of mitochondrial DNA sequences in stable and exponentially growing populations. Genetics 129: 555-562.
Stephens M, Donnelly P 2003. A comparison of Bayesian methods for haplotype reconstruction from population genotype data. Am J Hum Genet 73: 1162-1169.
Stephens M, Smith NJ, Donnelly P 2001. A new statistical method for haplotype reconstruction from population data. Am J Hum Genet 68: 978-989.
Sunghoon J, Duwal RK, Lee S 2011. COI barcoding of true bugs (In-secta, Heteroptera). Mol Ecol Resour 11: 266-270.
Tadei WP, Dutary-Thatcher B 2000. Malaria vectors in the Brazil-ian Amazon: Anopheles of the subgenus Nyssorhynchus. Rev Inst Med Trop Sao Paulo 42: 87-94.
Tadei WP, Dutary-Thatcher B, Santos JM, Rodrigues IB, Rafael MS 1998. Ecologic observations on anopheline vectors of malaria in the Brazilian Amazon. Am J Trop Med Hyg 59: 325-335.
Tajima F 1989. Statistical method for testing the neutral mutation hy-pothesis by DNA polymorphism. Genetics 123: 585-595.
Tamura K, Peterson D, Peterson N, Stecher G, Nei M, Kumar S 2011. MEGA5: Molecular Evolutionary Genetics Analysis using Maxi-mum Likelihood, Evolutionary Distance and MaxiMaxi-mum Parsi-mony Methods. Mol Biol Evol 28: 2731-2739.
Wallace AR 1852. On the monkeys of the Amazon. Proceedings of Zoological Society of London 20: 107-110.
Walton C, Handley JM, Tun-Lin W, Collins FH, Harbach RE, Baimai V, Butlin RK 2000. Population structure and population history of Anopheles dirus mosquitoes in Southeast Asia. Mol Biol Evol 17: 962-974.
Watterson GA 1975. On the number of segregating sites in genetic models without recombination. Theor Popul Biol7: 256-276.
Webb SD 1995. Biological implications of the middle Miocene Ama-zon seaway. Science269: 361-362.
White BJ, Cheng C, Sangaré D, Lobo NF, Collins FH, Besansky NJ 2009. The population genomics of trans-specific inversion poly-morphisms in Anopheles gambiae. Genetics183: 275-288.
WHO - World Health Organization 2011. World Malaria Re-port 2011. Available from: who.int/malaria/world_malaria_ report_2011/9789241564403_eng.pdf.
Wiemers M, Keller A, Wolf M 2009. ITS2 secondary structure im-proves phylogeny estimation in a radiation of blue butterflies of the subgenus Agrodiaetus (Lepidoptera: Lycaenidae: Polyomma-tus). BMC Evol Biol 9: 300.
Yang M, Ma Y, Wu J 2011. Mitochondrial genetic differentiation across populations of the malaria vector Anopheles lesteri from China (Diptera: Culicidae). Malar J10: 216.
Zapata MA, Cienfuegos AV, Quiros OI, Quinones ML, Luckhard S, Correa MM 2007. Discrimination of seven Anopheles species from San Pedro de Uraba, Antioquia, Colombia, by polymerase chain reaction-restriction fragment length polymorphism analy-sis of ITS sequences. Am J Trop Med Hyg 77: 67-72.
Zarza E, Reynoso VH, Emerson BC 2008. Diversification in the northern neotropics: mitochondrial and nuclear DNA phyloge-ography of the iguana Ctenosaura pectinata and related species. Mol Ecol 17: 3259-3275.
TABLE
Species distribution of anopheline larvae in different larval habitats by locality over three transmission seasons (2009-2011)
Locality Habitat type
Anopheles triannulatus
(n)
Anopheles goeldii
(n)
Amajarí (1) Marsh 0 0
Pool 1 1
Alto Alegre (2) Ditch 0 0
Marsh 4 0
Pond 0 7
Seepage 0 0
Stream margin 2 1
Boa Vista (3) Ditch 0 0
Marsh 0 0
Pond 0 4
Pool 0 14
Seepage 0 6
Stream margin 0 0
Mucajaí (4) Ditch 0 0
Pool 0 62
Iracema (5) Ditch 10 45
Pond 40 11
Petrolina (6) Ditch 0 0
Pond 0 0
Stream margin 0 3
Martins Pereira (7) Stream margin 1 2
Swamp 14 4
Ecuador (8) Pond 0 2
Seepage 0 5
Stream margin 0 0
Swamp 0 0
Mojú (9) Pond 19 19
Marsh 66 31
Stream margin 0 0
Goianésia (10) Marsh 0 0
Pond 14 0
Pool 0 0
Stream margin 0 0
Swamp 0 0
Tucuruí (11) Pond 7 2
Stream margin 6 0
Jacundá (12) Marsh 5 0
Pond 11 0
Stream margin 0 2
Marabá (13) Ditch 0 6
Marsh 0 0
Pond 2 3
Stream margin 1 0
Total 203 230
TABLE
Description of shared cytochrome oxidase Ihaplotypes and genetic polymorphism statistics
for Anopheles triannulatus and Anopheles goeldii
Site n Haplotypes π (SD) 1-∑ƒi2(SD) P K
An. triannulatus 1 1 1 - - -
-2 4 1 (2), 40, 41 0.01 (0.00) 0.83 (0.22) 12 7.67
5 37 1 (15), 2 (6), 7, 8, 9 (2), 35, 36 (2), 37, 39 (4), 43, 45 0.01 (0.00) 0.80 (0.05) 20 5.61 7 15 2 (9), 14, 38, 42 (3), 44 0.00 (0.00) 0.63 (0.13) 14 2.27
9 30 3 (11), 4 (7), 10, 11, 30, 31 (2), 32, 33, 34 (4) 0.00 (0.00) 0.81 (0.05) 12 1.95
10 14 6 (3), 12, 13 (3), 15, 16, 17 (2), 24, 25, 28 0.01 (0.00) 0.92 (0.05) 20 6.99 11 13 5 (2), 6, 16, 18, 19, 20, 21, 22, 26, 27 0.01 (0.00) 0.96 (0.04) 16 4 12 15 5 (4), 6 (4), 23 (2), 24, 25 (2), 29 0.01 (0.00) 0.83 (0.06) 9 2.99
129 0.02 (0.00) 0.95 (0.01) 57 10.1
An. goeldii 2 4 46, 47 (3) 0.00 (0.00) 0.50 (0.27) 2 1
3 15 46 (4), 47 (7), 48, 49, 77, 78 0.01 (0.00) 0.74 (0.09) 15 3.26 4 18 46 (3), 47 (6), 48 (2), 49 (2), 50, 63, 67, 72 0.01 (0.00) 0.86 (0.06) 18 6.78
5 50 46 (7), 47 (14), 48 (10), 49 (3), 50 (2), 51, 52, 63 (3),
70, 71, 73 (2), 74 (2), 75 0.01 (0.01) 0.86 (0.03) 24 6.29
6 3 47 (2), 72 0.01 (0.01) 0.67 (0.31) 11 7.33
7 6 46, 50, 68, 69, 73, 76 0.01 (0.00) 1.00 (0.10) 18 8.47
8 7 46 (5), 47, 53 0.01 (0.00) 0.52 (0.21) 12 3.81
9 17 53, 56, 57, 59, 60 (2), 61 (3), 62 (2), 64, 65, 66 0.00 (0.00) 0.93 (0.04) 10 2.18
11 2 54, 63 - - -
-13 11 54 (3), 55 (2), 58, 60, 63 (2), 64 0.01 (0.00) 0.91 (0.07) 13 5.6
133 0.01 (0.01) 0.90 (0.002) 44 7.43
K: average number of differences; n: number of sequences; P: polymorphic sites; SD: standard deviation; 1-Σfi2: haplotype
di-versity; Π: nucleotide didi-versity; 1-13: see Fig. 1 for more information. Bold indicates shared haplotypes and indicates diversity among lineages or species.
TABLE
Description of shared white haplotypes and genetic polymorphism statistics for Anopheles triannulatus and Anopheles goeldii
Species Site n Haplotypes π (SD) 1-∑ƒi2(SD) P K
An. triannulatus 1 1 B - - -
-2 3 B, E (2) - - -
-5 10 B (3), C (4), D (2), E 0.00 (0.00) 0.51 (0.16) 7 2.47
7 4 E (2), P, T - - -
-9 9 A (8), U 0.00 (0.00) 0.22 (0.17) 1 0.22
10 9 E, N (2), O, Q (3), R, S 0.01 (0.00) 0.81(0.12) 9 3.94
11 10 E, F, I, J (2), K, L (2), N (2) 0.01 (0.00) 0.93 (0.06) 11 4.02
12 8 G (2), H, I, J, L (2), M 0.00 (0.00) 0.93(0.08) 4 1.54
54 0.01 (0.00) 0.93 (0.02) 24 5.43
An. goeldii 2 4 V, W (2), CC - - -
-3 10 V (3), W (6), X 0.00 (0.00) 0.600(0.13) 4 1.07
4 10 V, W (9) 0.00 (0.00) 0.20 (0.15) 1 0.20
5 9 W (9) 0.00 (0.00) 0.000(0.00) 0 0
8 1 W - - -
-9 10 Y (9), Z 0.00 (0.00) 0.200(0.15) 2 0.4
13 8 Y (5), AA (2), BB 0.00 (0.00) 0.61 (0.16) 3 1.04
52 0.01 (0.00) 0.66 (0.05) 12 2.85
K: average number of differences; n: number of sequences; P: polymorphic sites; SD: standard deviation; 1-Σfi2: haplotype