Linkage disequilibrium and diversity for three genomic regions
in Azoreans and mainland Portuguese
Claudia C. Branco
1,2, Paula R. Pacheco
1,2, Ester Cabrol
1, Rita Cabral
1,2, Astrid M. Vicente
2,3and Luisa Mota-Vieira
1,21
Molecular Genetics and Pathology Unit, Hospital of Divino Espírito Santo of Ponta Delgada,
São Miguel Island, Azores, Portugal.
2
Instituto Gulbenkian de Ciência, Oeiras, Portugal.
3
Instituto Nacional de Saúde Dr. Ricardo Jorge, Lisboa, Portugal.
Abstract
Studies on linkage disequilibrium (LD) across the genome and populations have been used in recent years with the main objective of improving gene mapping of complex traits. Here, we characterize the patterns of genetic diversity of HLAloci and evaluate LD (D’) extent in three genomic regions: Xq13.3, NRY and HLA. In addition, we examine the distribution of DXS1225-DXS8082 haplotype diversity in Azoreans and mainland Portuguese. Allele distribution has demonstrated that the São Miguel population is genetically very diverse; haplotype analysis revealed 100% discrimi-natory power for X- and Y-markers and 94.3% for HLA markers. Standardized multiallelic D’ in these three genomic regions shows values lower than 0.33, thereby suggesting there is no extensive LD in the São Miguel population. Data regarding the distribution of DXS1225-DXS8082 haplotypes indicate that there are no significant differences among all the populations studied, (Azorean geographical groups, the Azores archipelago and mainland Portugal). Moreover, in these as well as in other European populations, the most frequent DXS1225-DXS8082 haplotype is 210-219. Even though São Miguel islanders and Azoreans do not constitute isolated populations and show LD for only very short physical distances, certain characteristics, such as the absence of genetic structure, the same envi-ronment and the possibility of constructing extensive pedigrees through church and civil records, offer an opportunity for dissecting the genetic background of complex diseases in these populations.
Key words:linkage disequilibrium, X-chromosome, Y-chromosome, HLA, São Miguel, Azores.
Received: September 18, 2008; Accepted: January 2, 2009.
Introduction
Linkage disequilibrium (LD), the nonrandom associ-ation of alleles at differentloci, varies across populations and genomic regions, as well as between pairs of markers in close proximity. Certain factors which generate LD vari-ance, as for example genetic drift and admixture, are popu-lation specific. Others, such as recombination rate, gene conversion and natural selection, are specific to genomic regions (Shifmanet al., 2003). For these reasons, studies on LD extent and population structure are a good starting point for the investigation of complex traits (Angiuset al., 2002).
The Azores is a Portuguese archipelago composed of nine islands distributed among three geographical groups: the Eastern group with two islands, São Miguel and Santa Maria; the Central group which includes five islands, Ter-ceira, Pico, Faial, São Jorge and Graciosa; and the Western
group, with Flores and Corvo islands. The Portuguese ex-plorers, who discovered the archipelago in 1427, only started the settlement in 1439 through a long and difficult process. Historical data report that the Portuguese crown was compelled to cede both land and privileges, not only to the Portuguese, but also to foreigners, so as to attract people to the islands. Thus the Azorean population received a sig-nificant contribution from people with genetic backgrounds other than Portuguese. This included individuals of Flem-ish, SpanFlem-ish, French, Italian, German, Scottish and Jewish origins, as well as Moorish prisoners and black slaves from Guinea, Cape Verde and São Tomé (Guill, 1993). The first islands to be settled were Santa Maria and São Miguel, the last being Flores and Corvo in the beginning of the 16th cen-tury, the latter being populated mainly with individuals from the other islands.
São Miguel is the largest island of the Azores, with a population of 131,609 inhabitants (2001 Census, Portugal National Institute of Statistics) derived from around 27 generations. Several studies (Santoset al., 2003; Montielet
Send correspondence to Luisa Mota-Vieira. Molecular Genetics and Pathology Unit, Hospital of Divino Espírito Santo of Ponta Delgada, EPE, 9500-370 Ponta Delgada, São Miguel Island, Azo-res, Portugal. E-mail: lmotavieira@hdes.pt.
al., 2005; Pacheco et al., 2005; Spínola et al., 2005a; Brancoet al., 2006, 2008a, 2008b, 2008c) have been under-taken, with the aim of characterizing the genetic pool of the Azoreans. These studies report high genetic variability and heterogeneity in the Azorean population, as explained by the history of the settlement of the islands. Recently, Laan et al. (2005) proposed that the evaluation of DXS1225-DXS8082 haplotype diversity constitutes an efficient marker of population genetic history due to its low recom-bination rate. Therefore, in order to unravel possible differ-ences between mainland Portuguese and Azoreans, unob-served in previous works, we re-analysed the data published in Brancoet al.(2008a) for the three Azorean geographical groups, as well as for the Azores archipelago and mainland Portugal. In addition, the present research, based on an analysis of the Xq13.3 non-recombining por-tion of the Y-chromosome (NRY) and HLA regions in São Miguel Islanders, also mainly aims at answering questions such as: What is the allelic distribution of HLA class I and II in this island population, and does it reveal the presence of a genetic structure? Does LD extent vary considerably between these three different genomic regions?
Material and Methods
Population samples and genotyping
The sample set was composed of healthy blood do-nors living in São Miguel Island and obtained from the “anonymous” Azorean DNA bank located in the main Hos-pital of the Azores archipelago, Portugal (Mota-Vieiraet al., 2005). LD for X- and Y-chromosomes was assessed only in males (189 and 149, respectively), whereas the analysis of the HLA region consisted of 106 individuals of both sexes (8 females and 98 males). The Xq13.3 region was analyzed according to Brancoet al.(2008a), by exam-ining eight microsatellite markers - DXS983, DXS1066, DXS986, DXS8092, DXS8082, DXS1225, DXS8037 and DXS995 - spanning approximately 6.9 centiMorgans (cM) or 20.9 megabases (Mb). Moreover, DXS1225-DXS8082 haplotype frequencies were estimated in the three Azorean geographical groups (Western, Central and Eastern), as well as in the Azores archipelago and mainland Portugal, by using a total of 527 individuals (450 islanders and 97 mainlanders), the same as were previously studied by these authors (Brancoet al., 2008a).
The characterization of 7 Y-STRs in 172 male indi-viduals is described in Pachecoet al.(2005). HLA class I (-A, -B and -Cw) and class II (-DRB1, -DQB1, -DPA1 and -DPB1) genotyping was undertaken in 106 individuals by PCR-SSP Olerup SSP (GenoVision Inc.), according to manufacturers’ instructions. After electrophoresis on a 4% agarose gel stained with SYBR® Green, the PCR products were visualized, followed by HLA allele identification us-ing the Helmberg-SCORE “Sequence Compilation and Rearrangment Evaluation for Research only” software
ver-sion 3.320T (Olerup SSP AB, Saltsjöbaden, Sweden). We also typed two dinucleotide STRs - D6S265 and TNFa-
lo-cated in the HLA region Brancoet al.(2008b).
Statistical analysis
Allele and DXS1225-DXS8082 haplotype frequen-cies were calculated by direct counting. Average gene di-versity estimation was done by using Arlequin software. Estimation of HLA haplotypes was obtained through the expectation maximization (EM) algorithm, an iterative pro-cedure from multilocus genotype data, with the unknown gamete phase implemented in Arlequin v3.0. Evaluation of standardized multiallelic disequilibrium coefficient, D’, was performed using the Haploxt application from GOLD software. This program calculates disequilibrium statistics from haplotype data. An estimation of average D’ values in each genomic region, was executed with a simple mathe-matical mean, for all values obtained for each marker pair. Since the extent of the three regions varied widely, a second analysis, taking into consideration a smaller genetic dis-tance of around 3 Mb, was undertaken, so as to give further insight into LD patterns over short distances, and to guaran-tee the truthfulness of the drawn conclusions.
Results
HLA diversity in São Miguel Island
An analysis of the HLA alleles in 106 individuals from São Miguel Island (Table 1) revealed that the average gene diversity for all HLA loci varied from 0.821 for -DQB1 and -DPA1 to 0.934 for -B. Considering HLAloci, the overall gene diversity for São Miguel islanders was 0.843 (Table 2). HLA allele frequencies in São Miguel, mainland Portugal and other European populations demon-strated the absence of statistically significant differences (GST= 0.03; data not shown).
Haplotype analysis reveals a total of 200 HLA haplo-types, corresponding to 94.3% discriminatory power. Only the three most representative HLA-A-B-DRB1 haplotypes where evaluated (data not shown and provided as supple-mentary information by the authors upon request). A*01-B*08-DRB1*03 is the most frequent haplotype in São Miguel (8%) followed by A*02-B*44-DRB1*04 and A*02-B*44-DRB1*07, both with 1.4% frequency. Com-parison with other European and African populations (Ar-naiz-Villenaet al., 1995, 1997, Martinez-Lasoet al., 1995) revealed 3 haplotypes, unique to the São Miguel Island population, namely DRB1*07, A*02-B*44-DRB1*11 and A*02-B*44-DRB1*15.
Linkage disequilibrium in São Miguel Island
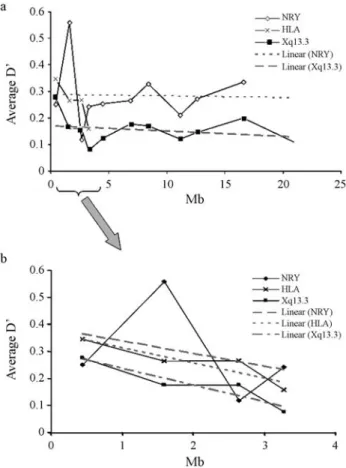
average values are shown in Table 2. Taken as a whole, di-versity results demonstrate that the São Miguel Island pop-ulation is very diverse. In terms of haplotype number, which in itself can influence the value of D’, we observed a smaller value for the NRY region. Since LD is generated by evolutionary processes, it is important to assess the patterns of LD, both in sex and autosomal chromosomes. In a com-parison of D’ in Xq13.3, both the NRY and HLA regions reveal lower LD than the Xq13.3 (Table 2). The data indi-cate a higher LD for the NRY, followed by the HLA region. On examining the analysis of LD patterns in shorter genetic distances (~3 Mb), we observed the same trend.
Nevertheless, values had increased for both Xq13.3 and NRY. The value for HLA had diminished due to the cut-off genetic distance value being smaller than that evaluated previously. The average D’2(0.247; Table 2) was not statis-tically different when compared to the observed value in larger genetic distance analysis (0.243; ~21 Mb).
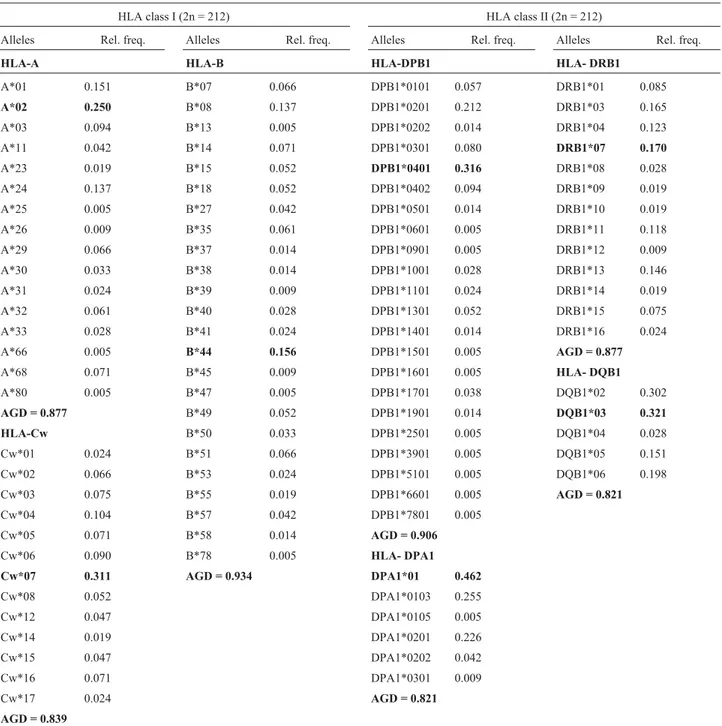
Figure 1a shows plotting average D’ over physical distances. We detected a decrease in LD values for shorter distances (< 4 Mb) in all the regions. As expected, the high-est value (> 0.5) obtained in the X-chromosome corre-sponds to the association DXS1225-DXS8082, which is the shortest physical distance between all the markers. In order Table 1- HLA class I and II allele frequencies and average gene diversity (AGD) in the São Miguel population (the highest values are in bold type).
HLA class I (2n = 212) HLA class II (2n = 212)
Alleles Rel. freq. Alleles Rel. freq. Alleles Rel. freq. Alleles Rel. freq.
HLA-A HLA-B HLA-DPB1 HLA- DRB1
A*01 0.151 B*07 0.066 DPB1*0101 0.057 DRB1*01 0.085
A*02 0.250 B*08 0.137 DPB1*0201 0.212 DRB1*03 0.165
A*03 0.094 B*13 0.005 DPB1*0202 0.014 DRB1*04 0.123
A*11 0.042 B*14 0.071 DPB1*0301 0.080 DRB1*07 0.170
A*23 0.019 B*15 0.052 DPB1*0401 0.316 DRB1*08 0.028
A*24 0.137 B*18 0.052 DPB1*0402 0.094 DRB1*09 0.019
A*25 0.005 B*27 0.042 DPB1*0501 0.014 DRB1*10 0.019
A*26 0.009 B*35 0.061 DPB1*0601 0.005 DRB1*11 0.118
A*29 0.066 B*37 0.014 DPB1*0901 0.005 DRB1*12 0.009
A*30 0.033 B*38 0.014 DPB1*1001 0.028 DRB1*13 0.146
A*31 0.024 B*39 0.009 DPB1*1101 0.024 DRB1*14 0.019
A*32 0.061 B*40 0.028 DPB1*1301 0.052 DRB1*15 0.075
A*33 0.028 B*41 0.024 DPB1*1401 0.014 DRB1*16 0.024
A*66 0.005 B*44 0.156 DPB1*1501 0.005 AGD = 0.877
A*68 0.071 B*45 0.009 DPB1*1601 0.005 HLA- DQB1
A*80 0.005 B*47 0.005 DPB1*1701 0.038 DQB1*02 0.302
AGD = 0.877 B*49 0.052 DPB1*1901 0.014 DQB1*03 0.321
HLA-Cw B*50 0.033 DPB1*2501 0.005 DQB1*04 0.028
Cw*01 0.024 B*51 0.066 DPB1*3901 0.005 DQB1*05 0.151
Cw*02 0.066 B*53 0.024 DPB1*5101 0.005 DQB1*06 0.198
Cw*03 0.075 B*55 0.019 DPB1*6601 0.005 AGD = 0.821
Cw*04 0.104 B*57 0.042 DPB1*7801 0.005
Cw*05 0.071 B*58 0.014 AGD = 0.906
Cw*06 0.090 B*78 0.005 HLA- DPA1
Cw*07 0.311 AGD = 0.934 DPA1*01 0.462
Cw*08 0.052 DPA1*0103 0.255
Cw*12 0.047 DPA1*0105 0.005
Cw*14 0.019 DPA1*0201 0.226
Cw*15 0.047 DPA1*0202 0.042
Cw*16 0.071 DPA1*0301 0.009
Cw*17 0.024 AGD = 0.821
to compare LD values, when taking into consideration the shortest distance studied (~3 Mb), we analysed D’ for the three genomic regions (Figure 1b). The results indicated the same tendency. We also added trend lines (grey lines; Fig-ures 1a and 1b), so as to understand the distribution of D’ values in these genomic regions. The results clearly demon-strated that D’ values diminished with physical distance. Nevertheless, we did not consider a trend line for HLAloci, in Figure 1a, since it would present a sharp decline, tending to negative values. We also noticed that, in both the NRY and Xq13.3 regions, stabilization in D’ values with physi-cal distance was registered (grey lines; Figures 1a and 1b),
probably due to less recombination in the Xq13.3 region and a lack in the NRY.
DXS1225-DXS8082 haplotype analysis in Azorean and mainland Portuguese populations
Several studies (Latiniet al., 2004; Belliset al., 2008) have demonstrated a firm association between the markers DXS1225-DXS8082 (Xq13.3), mainly as a result of their short physical distance (162 kb). Recently, Laan et al. (2005) proposed this haplotype as a good marker of popula-tion genetic history, due to its low recombinapopula-tion rate. The distribution of DXS1225-DXS8082 haplotypes was also analyzed (Table 3) in Azoreans and mainland Portuguese populations, in order to detect significant differences be-tween islanders and mainlanders. The results demonstrated that the most frequent haplotype in the Azorean and main-land Portuguese populations was 210-219 followed by 192-229. We identified a total of 52 different DXS1225-DXS8082 haplotypes, but only 16 with a frequency of³3%
(Table 3). Based on sample distribution, this selection of criterion (³3%) allows us to illustrate certain differences
between the Azorean and mainland populations. For in-stance, we could only observe the presence of haplotypes 192-219 and 214-219 in the Western, 212-219 in the Cen-tral, and 198-225 in the Eastern groups. From Table 3, we could also perceive that there are only 3 common haplotypes in the whole Azorean population and geograph-ical groups, namely 210-219 (the most frequent), 192-229 (the second most frequent) and 192-231 (absent in main-land Portugal). In the Azores archipelago population, we observed the presence of 9 out of 16 different haplotypes. If we add those with a frequency of³1% (data not shown),
we could identify 17 out of 52 (the remaining 35 do not reach 1% frequency). On considering the³3% criterion,
mainland Portugal shows 8 out of 27 different haplotypes (Table 3), all with a frequency of³1% (data not shown).
Discussion
The evolution of populations is dependent on several mechanisms, such as migration, genetic drift, selection and mutation, all affecting the patterns of diversity of neutral and disease variants. Consequently, the measure of diver-sity in neutral markers allows for inferring how these pro-cesses shape the overall signature of a population, besides deducing further implications in general disease apportion-ment, since non-neutrallocimay be under the same evolu-tionary forces. In general, the data corroborate previous studies (Pachecoet al., 2005; Brancoet al., 2006; Brancoet al., 2008a, 2008b, 2008c), where Azoreans and São Miguel islanders showed higher genetic diversity values than mainland Portugal and other European populations. This may be a direct consequence of the Azores settlement pro-cess, where a major contribution of mainland Portuguese and, to a lesser extent, Flemish, Spaniards, French, Italians, Table 2- Number of haplotypes (NH), gene diversity (GD) and
standard-ized multi-allelic disequilibrium coefficient (D’) for three genomic re-gions in the São Miguel Island population.
Genomic region NH GD D’1 D’2
Xq13.3 189 0.691 0.172 0.177
NRY 149 0.574 0.282 0.370
HLA 200 0.843 0.275 0.258
Average 179 0.703 0.243 0.247
D’1= LD over ~21 Mb; D’2= LD over ~3 Mb.
Germans, Scots, Jews, Moors and Negroes from Guinea, Cabo Verde and São Tomé is reported. Previous studies of HLA markers in mainland Portugal (3 loci, -A, -B and -DRB1; Spínolaet al., 2005b) and in Azores (6loci,-A, -B, -Cw, -DRB1, -DQA1 and -DQB1; Spínolaet al., 2005a) demonstrate average diversity values of 0.92 in the two populations. The results obtained in the present study, based on 7loci, showed a lower value (0.84). This may be explained by the difference in number of analysedlociand by the fact that Spinolaet al.(2005a) used a high-resolution methodology for the HLA genotype. In addition, the same authors (Spínolaet al., 2005a) question the identification of paternal lineage N3, specific to Asians and north Europeans (Helgasonet al., 2000; Rosseret al.2000), since, based on HLAloci, they did not encounter any results supporting this observation. Historic records reporting the presence of Asians or Mongolians in the archipelago are unknown. Nevertheless, with HLA data, the haplotype A*02 B*44 DRB1*04 was identified at a frequency of 1.42%. This haplotype, possibly oriental in origin, has previously been described in the Azores (Bruges-Armaset al., 1999). The introduction of this genetic contribution probably occurred during the expansion of trade navigation between Europe, America and Asia, in the 16thand 17thcenturies, when the Azores played a strategic role due to its geographic posi-tion.
Meyeret al. (2006) investigated LD among all the HLA loci in around 40 populations worldwide, and re-ported significant LD values. The present results, although showing that HLA has significant pairwise LDp-values (p
< 0.01; 13 out of 36 pairs with significant LD; data not shown), do not imply strong LD for this region (D’ values < 0.3). The distribution of LD among Y-linked alleles is ac-cepted as being substantially larger than that of X-linked markers, since, Y-alleles constitute/have only one-fourth of the effective population size. This assumption is confirmed by data obtained herein. Nevertheless, the highest peak identified in Figures 1a and 1b corresponds to the associa-tion between DYS392-DYS385. This was unexpected, since this region does not present recombination. We hy-pothesise that this observation may reflect the influence of stochastic processes, such as random sampling, or even point mutations throughout the evolution of populations, since these markers have a higher genetic distance (~1.75 Mb) when compared to markers with the lowest value (DYS389I-DYS389II; ~0.25 kb).
The study of DXS1225-DXS8082 haplotype diver-sity in Azorean and mainland Portuguese populations, has contributed to understanding how these populations are mutually related. The X-chromosome is an important tool for historical research, since there is but one copy in males, thus facilitating the determination of haplotypes. This fea-ture permits accurately determining LD extension, and also allows for inferring population “maternal lineages“. It is clear that, since this chromosome undergoes recombina-tion, direct maternal lineages may not be obtained. None-theless, on studying DXS1225-DXS8082, which has a very small probability of recombination (their physical distance is 162 kb), we could come to some interesting conclusions. Taking into account the frequency³1% proposed by Laan
Table 3- Common haplotypes of micro-satellitelociDXS1225-DXS8082 with frequency³3% for Azoreans and mainland Portuguese populations.
DXS1225-DXS8082 haplotypes
Azorean geographical groups Azores archipelago Mainland Portugal
Western (N = 93) Central (N = 150) Eastern (N = 207) (N = 450) (N = 97)
Abs. freq. % Abs. freq. % Abs. freq. % Abs. freq. % Abs. freq. %
192-219 3 3.23 - - -
--227 4 4.30 6 4.00 - - - - 3 3.09
-229 4 4.30 10 6.67 21 10.14 35 7.80 16 16.49
-231 4 4.30 7 4.67 13 6.28 24 5.35 -
-198-221 - - - - 13 6.28 16 3.56 3 3.09
-225 - - - - 8 3.86 - - -
--227 3 3.23 11 7.33 - - 19 4.23 -
--229 - - 6 4.00 7 3.38 15 3.34 3 3.09
202-211 8 8.60 10 6.67 - - 23 5.12 3 3.09
204-211 3 3.23 - - -
-206-219 2 3.92 - - -
-210-219 32 34.41 42 28.00 67 32.37 141 31.40 39 40.21
-221 - - 10 6.67 15 7.25 27 6.01 4 4.12
212-219 - - 5 3.33 - - -
-214-219 4 4.30 - - -
et al.(2005), it was possible to notice that most haplotypes were present in all the evaluated populations, thereby sug-gesting that there were no mutual differences. Moreover, the 210-219 haplotype, reported by Laanet al.(2005) as be-ing the most widely represented in Europe, was also the most frequent in this study. These results confirm previous works, where a strong similarity between Azoreans and other Europeans was evident (Pachecoet al., 2005; Branco et al., 2006 2008a, 2008b, 2008c).
There is some controversy regarding the amount of useful LD for mapping studies. According to Abecasiset al.(2001), the value of D’ = 0.33, which corresponds to a 10-fold increase in the required sample size, is commonly taken as the minimum usable amount of LD. On the other hand, Reichet al.(2001) consider that D’ > 0.5 is useful. Although both of these D’ values are estimates based on SNP (single nucleotide polymorphism) markers, Schulzeet al.(2002), on comparing both SNPs and microsatellites, re-ported the same values for D’. In the present case, none of the samples studied manifested values higher than 0.5 or 0.33, thus indicating no LD for the São Miguel population. These results are corroborated by those obtained by Service et al.(2006) and Brancoet al.(2008a), where the Azoreans presented the lowest values of LD when compared with iso-lated and outbred populations. Even though the Azores are not an isolated population, there are certain characteristics that offer the opportunity for dissecting the genetic back-ground of complex diseases in these populations, such as the absence of genetic structure, the same environment and the possibility of constructing extensive pedigrees through church and civil records. The absence of structure reduces the presence of false genetic associations in complex dis-ease studies. The same environment allows for better con-trol over external factors that may be influencing the development of a complex disease. Finally, extensive pedi-grees permit the development of reliable studies on linkage, with statistical significance. In summary, the overall data implies that the identification of identical-by-descent (IBD) regions surrounding disease susceptibility genes or other complex traitlociin the São Miguel population, as well as in Azoreans, will require very high marker density, where data from the HapMap project (The International HapMap Consortium, 2007) will most certainly increase the power of IBD mapping.
Acknowledgments
We would like to express our gratitude to all blood donors, all health professionals of Azorean Health Centres, of the Serviço de Patologia Clínica do Hospital da Horta, EPE and of the Serviço de Hematologia do Hospital do Divino Espirito Santo de Ponta Delgada, EPE, directly in-volved in blood collection, as well as the Secretaria Re-gional dos Assuntos Sociais of Azores Government. This work was supported by grants from the Direcção Regional da Ciência e Tecnologia, Azores (Ref. M1.2.1/I/003/2005),
and Fundação para a Ciência e a Tecnologia of Portugal, POCI 2010 program (POCI/SAL-MMO/58413/2004). CCB and PRP were funded by grants (Ref. SFRH/BD/12254/2003 and SFRH/BD/27453/2006, re-spectively) from the Fundação para a Ciência e a Tecnolo-gia of Portugal.
References
Abecasis GR, Noguchi E, Heinzmann A, Traherne JA, Bhattacharyya S, Leaves NI, Anderson GG, Zhang Y, Lench NJ, Carey Aet al.(2001) Extent and distribution of linkage disequilibrium in three genomic regions. Am J Hum Genet 68:191-197.
Angius A, Bebbere D, Petretto E, Falchi M, Forabosco P, Maes-trale B, Casu G, Persico I, Melis PM and Pirastu M (2002) Not all isolates are equal: Linkage disequilibrium analysis in Xq13.3 reveals different patterns in Sardinian sub popula-tions. Hum Genet 111:9-15.
Arnaiz-Villena A, Benmamar D, Alvarez M, Diaz-Campos N, Varela P, Gomez-Casado E and Martinez-Laso J (1995) HLA allele and haplotype frequencies in Algerians. Related-ness to Spaniards and Basques. Hum Immunol 43:259-268. Arnaiz-Villena A, Martinez Laso J, Gomez Casado E, Diaz Cam-pos N, Santos P, Martinho A and Breda Coimbra H (1997) Relatedness among Basques, Portuguese, Spaniards, and Algerians studied by HLA allelic frequencies and haplo-types. Immunogenetics 47:37-43.
Bellis C, Cox HC, Ovcaric M, Begley KN, Lea RA, Quinlan S, Burgner D, Heath SC, Blangero J and Griffiths LR (2008) Linkage disequilibrium analysis in the genetically isolated Norfolk Island population. Heredity 100:366-373.
Branco CC, Cabrol E, São Bento M, Gomes CT, Cabral R, Vicente AM, Pacheco PR and Mota Vieira L (2008a) Evalu-ation of linkage disequilibrium on the Xq13.3 region: Com-parison between the Azores Islands and mainland Portugal. Am J Hum Biol 20:364-366.
Branco CC, Pacheco PR, Cabral R, Vicente AM and Mota Vieira L (2008b) Genetic signature of the São Miguel Island popu-lation (Azores) assessed by 21 microsatellite loci. Am J Hum Biol 20:118-120.
Branco CC, Palla R, Lino S, Pacheco PR, Cabral R, de Fez L, Peixoto BR and Mota Vieira L (2006) Assessment of the Azorean ancestry by Alu insertion polymorphisms. Am J Hum Biol 18:223-226.
Branco CC, São-Bento M, Gomes CT, Cabral R, Pacheco PR and Mota-Vieira L (2008c) Azores Islands: Genetic origin, gene flow and diversity patterns. Ann Hum Biol 35:65-74. Bruges-Armas J, Martinez-Laso J, Martins B, Allende L,
Go-mez-Casado E, Longas J, Varela P, Castro MJ and Arnaiz-Villena A (1999) HLA in the Azores Archipelago: Possible presence of Mongoloid genes. Tissue Antigens 54:349-359. Guill JH (1993) A History of the Azores Islands. Division of
Golden Shield International Publications, California, 660 pp.
Helgason A, Siguroardóttir S, Nicholson J, Sykes B, Hill EW, Bradley DG, Bosnes V, Gulcher JR, Ward R and Stefansson K (2000) Estimating Scandinavian and Gaelic ancestry in the male settlers of Iceland. Am J Hum Genet 67:697-717. Laan M, Wiebe V, Khusnutdinova E, Remm M and Paabo S
Linkage disequilibrium and haplotype study in Eurasian populations. Eur J Hum Genet 13:452-462.
Latini V, Sole G, Doratiotto S, Poddie D, Memmi M, Varesi L, Vona G, Cao A and Ristaldi MS (2004) Genetic isolates in Corsica (France): Linkage disequilibrium extension analysis on the Xq13 region. Eur J Hum Genet 12:613-619.
Martinez-Laso J, De Juan D, Martinez-Quiles N, Gomez-Casado E, Cuadrado E and Arnaiz-Villena A (1995) The contribu-tion of HLA-A, -B, -C and -DR, -DQ DNA typing to the study of the origins of Spaniards and Basques. Tissue Anti-gens 45:237-245.
Meyer D, Single RM, Mack SJ, Erlich HA and Thomson G (2006) Signatures of demographic history and natural selection in the human major histo-compatibility complex loci. Genetics 173:2121-2142.
Montiel R, Bettencourt C, Silva C, Santos C, Prata, MJ and Lima M (2005) Analysis of Y chromosome variability and its comparison with mtDNA variability reveals different demo-graphic histories between islands in the Azores Archipelago (Portugal). Ann Hum Genet 69:135-144.
Mota-Vieira L, Pacheco PR, Almeida ML, Cabral R, Carvalho J, Branco CC, de Fez L, Peixoto BR, Araújo AL and Men-donça P (2005) Human DNA bank in São Miguel island (Azores), a resource for genetic diversity studies. In: Amo-rim A, Côrte Real F and Morling N (eds), Proceedings of the 21st International Congress of Forensic Genetics, Ponta Delgada. Progress in Forensic Genetics 1288:388-390.
Pacheco PR, Branco CC, Cabral R, Costa S, Araújo AL, Peixoto BR, Mendonça P and Mota Vieira L (2005) The Y chromo-somal heritage of the Azores Islands population. Ann Hum Genet 69:145-156.
Reich DE, Cargill M, Bolk S, Ireland J, Sabeti PC, Richter DJ, Lavery T, Kouyoumjian R, Farhadian SF, Ward R et al. (2001) Linkage disequilibrium in the human genome. Na-ture 411:199-204.
Rosser ZH, Zerjal T, Hurles ME, Adojaan M, Alavantic D, Amo-rim A, Amos W, Armenteros M, Arroyo E, Barbujani Get al.(2000) Y-chromosomal diversity in Europe is clinal and influenced primarily by geography, rather than by language. Am J Hum Genet 67:1526-1543.
Santos C, Lima M, Montiel R, Angles N, Pires L, Abade A and Aluja MP (2003) Genetic structure and origin of peopling in the Azores islands (Portugal): The view from mtDNA. Ann Hum Genet 67:433-456.
Schulze TG, Chen YS, Akula N, Hennessy K, Badner JA, McInnis MG, DePaulo JR, Schumacher J, Cichon S, Propping Pet al.(2002) Can long-range micro-satellite data be used to predict short-range linkage disequilibrium? Hum Mol Genet 11:1363-1372.
Service S, DeYoung J, Karayiorgou M, Roos JL, Pretorious H, Bedoya G, Ospina J, Ruiz-Linares A, Macedo A, Palha JAet al.(2006) Magnitude and distribution of linkage disequilib-rium in population isolates and implications for genome wide association studies. Nat Genet 38:556-560.
Shifman S, Kuypers J, Kokoris M, Yakir B and Darvasi A (2003) Linkage disequilibrium patterns of the human genome across populations. Hum Mol Genet 12:771-776.
Spínola H, Brehm A, Bettencourt B, Middleton D and Bruges Armas J (2005a) HLA class I and II polymorphisms in Azores show different settlements in Oriental and Central is-lands. Tissue Antigens 66:217-230.
Spínola H, Middleton D and Brehm A (2005b) HLA genes in Por-tugal inferred from sequence-based typing: On the crossroad between Europe and Africa. Tissue Antigens 66:26-36. The International HapMap Consortium (2007) A second
genera-tion human haplotype map of over 3.1 million SNPs. Nature 449:851-861.
Associate Editor: Francisco Mauro Salzano