Identification and phylogenetic inferences on stocks of sharks
affected by the fishing industry off the Northern coast of Brazil
Luis Fernando da Silva Rodrigues-Filho
1, Tainá Carreira da Rocha
1, Péricles Sena do Rêgo
1,2,
Horacio Schneider
1, Iracilda Sampaio
1and Marcelo Vallinoto
1,31
Laboratório de Genética e Biologia Molecular, Instituto de Estudos Costeiros,
Universidade Federal do Pará, Bragança, PA, Brazil.
2Universidade Estadual do Maranhão, São Luis, MA, Brazil.
3
Centro de Investigação em Biodiversidade e Recursos Genéticos, Universidade do Porto, Vairão, Portugal.
Abstract
The ongoing decline in abundance and diversity of shark stocks, primarily due to uncontrolled fishery exploitation, is a worldwide problem. An additional problem for the development of conservation and management programmes is the identification of species diversity within a given area, given the morphological similarities among shark species, and the typical disembarkation of processed carcasses which are almost impossible to differentiate. The main aim of the present study was to identify those shark species being exploited off northern Brazil, by using the 12S-16S mo-lecular marker. For this, DNA sequences were obtained from 122 specimens collected on the docks and the fish mar-ket in Bragança, in the Brazilian state of Pará. We identified at least 11 species. Three-quarters of the specimens collected were eitherCarcharhinus porosus or Rhizoprionodon sp, while a notable absence was the daggernose shark, Isogomphodon oxyrhyncus, previously one of the most common species in local catches. The study emphasises the value of molecular techniques for the identification of cryptic shark species, and the potential of the 12S-16S marker as a tool for phylogenetic inferences in a study of elasmobranchs.
Key words:sharks, molecular identification, phylogenetic, mtDNA, conservation.
Received: July 22, 2008; Accepted: November 27, 2008.
Introduction
The natural stocks of many shark species are in sharp decline in most parts of the World (Baum et al., 2003). Studies of these elasmobranchs have shown that the most significant threat to this group is anthropogenic – primarily from fishery industries – resulting in a growing number of extinction-threatened species (Camhiet al., 1998; Dulvyet al., 2003). The effects induced by removing these predators from the ocean food web remain unpredictable. However, Myerset al.(2007) provide evidence of oceanic ecosystem transformations.
A decline of up to 89% has been recorded in the abun-dance of certain coastal species in the northwest Atlantic (Baumet al., 2003). Baum and Myers (2004) have sug-gested that the downward trend in the abundance of many shark species, especially in the Gulf of Mexico, began with the onset of industrialised fisheries. They cite the example of the oceanic Carcharhinus longimanus, which, in the 1950’s, was originally one of the most common species in
the Gulf of Mexico, but has since declined by 99% to date. Shepherd and Myers (2005) found that the populations of 16 shark species are diminishing in the Gulf of Mexico, mainly as a result of incidental harvesting. However, reli-able data on the exploitation of elasmobranch stocks are scarce, and it seems likely that the number of shark species being harvested by local sport and commercial fishermen is considerably underestimated (Cortés, 2002).
In Brazil, sharks are harvested intensively, primarily for the commercialisation of fins and secondarily, their meat. Between 1980 and 1994, these accounted for 6.4% and 12.7% of total fishery catches in the states of Paraná and Santa Catarina, respectively (Paiva, 1997). In Paraná, the contribution of this group to the total catch was larger than that of important teleost species, such as weakfish (5.9%) and mullet (5.1%). This demand has maintained an-nual catches of sharks in Brazil at around 30,000 tons over the past two decades, and has resulted in a number of spe-cies being classified as endangered (IBAMA, Instrução Normativa n. 5, May 21th, 2004).
In the Brazilian state of Pará, commercial catches of sharks are mainly disembarked in the ports of Belém, Bragança and Vigia, where they are most easily marketed Send correspondence to Marcelo Vallinoto. Laboratório de
Gené-tica e Biologia Molecular, Instituto de Estudos Costeiros, Uni-versidade Federal do Pará, Al. Leandro Ribeiro s/n, 68.600-000 Bragança, PA, Brazil. E-mail: mvallino@ufpa.br.
(Fundação PROZEE, 2006). Annual shark catches in this state were 6750-7570 tons between 1997 and 2000, al-though productivity has fallen over recent years, the total reaching less than 4400 tons in 2004 (CEPNOR/IBAMA, 2004; Fundação PROZEE, 2006).
As in the Gulf of Mexico, an important aspect of the harvesting of sharks in this region – which encompasses the Amazon estuary – is the fact that these animals are captured primarily during fishing for other target species, such as Tuna (Thunnus), Spanish mackerel (Scomberomorus brasiliensis) and Red snapper (Lutjanus purpureus), and are thus normally harvested incidentally (Szpilman 2004; Elias MP, MSc Dissertation, Universidade Federal do Pará, Belém, PA, 2004). Given this, there are few reliable data on either the species of shark being harvested in this region or catch sizes, and thus both parameters are probably consid-erably underestimated.
Therefore, sharks are extremely vulnerable world-wide to fishing practices of almost all types and descrip-tions, the effects of this situation being further aggravated by a number of characteristics specific to the group, such as their slow growth and maturation rates, and low fecundity (Hoenig and Gruber, 1990).
On considering these factors, the Brazilian Environ-ment Ministry has included a number of species on its red list (MMA, 2004), this including the sandbar shark (Carcharhinus porosus), lemon shark (Negaprion brevirostris), daggernose (Isogomphodon oxyrhyncus), nurse shark (Ginglymostoma cirratum), whale shark (Rhincodon typus), and all the species of the genus Sphyrna. However, scarce reliable data are available on the elasmobranch species being harvested or the size of catches (Lessaet al., 1999), this being especially the case in north-ern Brazil, where research lags far behind growth of the fishery industry.
A wide knowledge of the fish species that occur within a given area and their relative importance for local fisheries, are vital for a working understanding of stock dynamics. To-gether with existing information on species traits, survey data on current population characteristics provide an essen-tial baseline for the development of management plans at the species level. Management of fish stocks is amply recom-mended (FAO, 2000), but is generally hindered by a lack of species-specific data. This situation is aggravated in the case of sharks, due to morphological similarity among species, thus hampering reliable taxonomic identification (Stevens and Wayte, 1998; Coelho and Erzini, 2008; Valenzuelaet al., 2008). Worse still, most commercial fishermen process sharks at sea, removing the head, entrails and fins prior to disembarkation (Castro, 1993).
On considering these problems, the use of molecular tools for the identification of shark samples has grown con-siderably in recent years, this resulting in the development of diverse techniques based on RFLP (Heist and Gold, 1999), mitochondrial DNA sequences (Hoelzel, 2001;
Douadyet al., 2003; Greiget al., 2005; Iglésiaset al., 2005; Wardet al., 2008) and species-specific primers or repeats (Panket al., 2001; Shivjiet al.2002, 2005; Abercrombrieet al., 2005; Clarke et al., 2006a; Magnussen et al., 2007; Pinhalet al., 2008). One of the most important studies on shark identification is that of Greiget al.(2005), based on the region of the mitochondrial genome which extends from the 12S rRNA gene to the 16S rRNA (12S-16S), and which has provided a phylogenetic signal adequate enough for the discrimination of at least 35 shark species. Using the same mitochondrial region, Iglésiaset al.(2005) were able to identify a paraphyletic arrangement in the family Scyliorhinidae, re-emphasising the difficulties not only of classifying this group, but also of understanding its evolu-tionary history.
All told, the identification of those shark species be-ing exploited by the fishery industry in northern Brazil will be fundamentally important for understanding the effects of harvesting patterns, and will provide an essential base-line for the development of conservation and management programmes. As in other regions, processing the catch at sea impedes reliable identification of species after disem-barkation, making the use of molecular markers essential for efficient recognition of species and monitoring shark stocks. Given these considerations, the primary objective of the present study was to obtain species-specific DNA se-quences from sharks disembarked by local fisheries in northern Brazil, through comparisons with data available in the literature (Greiget al., 2005; Iglésiaset al., 2005).
Materials and Methods
Sampling, DNA extraction and sequencing
In the present study, 36 sequences available in the lit-erature (Greiget al., 2005) were obtained from GenBank (Table 1). Furthermore, seven individuals collected whole were identified by using the Compagno (1984) species key, the data therefrom being inserted into the data bank for comparison and possible identification of species (referred to as “present study” in Table 1). The speciesMustelus norrisi and Mustelus canis (Triakidae) were used as out-group. For the identification study, 122 samples of shark tissue were collected from processed carcasses, known locally ascharutos (from which the head, entrails and fins had been removed), at the municipal fish market in Bragança and at the docks in Bacuriteua and Bragança (in the Brazilian state of Pará) between October, 2005 and De-cember, 2006. The samples were labelled according to the common name attributed to each individual by the fisher-man or fishmonger from whom each specimen had been obtained, fixed in 95% ethanol and stored at -20 °C until DNA extraction.
phenol-chloroform extraction protocol, with precipitation by sodium acetate/isopropanol. Following extraction, a re-gion of the mitochondrial genome (mtDNA) which stretches from the region of the 12S rRNA gene, passing through the tRNA-Valine gene to the 16S rRNA segment was amplified by PCR using the primers 12SA and 16SA (Greiget al., 2005).
The PCR protocol was standardised to a final volume of 25 mL containing 0.25 mL of each primer (12SA =
5 pmol/mL, 16SA = 5 pmol/mL), 1mL of MgCl2(25 mM),
4 mL of dNTP mix (1.25 mM), 2.5 mL of 10x buffer
(Invitrogen – Tris-HCl and KCl, pH 7.8), 0.2mL (5 U/mL)
Taqpolymerase (Invitrogen), approximately 100 ng of total DNA and purified water to complete the final volume. The temperature cycles followed recommendations by Greiget al.(2005).
Following amplification, 2.5mL of the product was
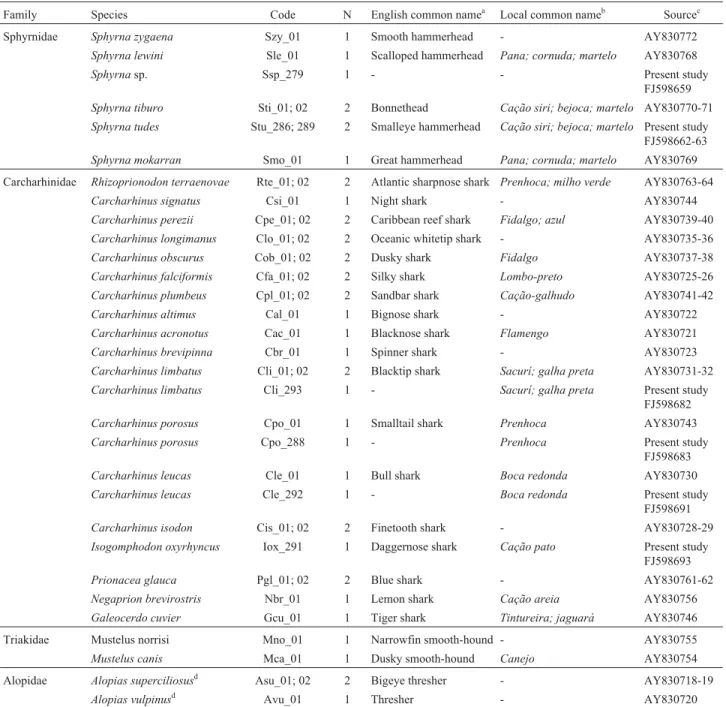
purified using an Exo-SAP-IT kit (Amersham-Pharmacia) and sequenced by the dideoxytermination method (Sanger et al., 1977), with reagents from the DYEnamicTM dye ter-Table 1- Reference species for the sequence identification recorded in this study. These include samples obtained from GenBank, and voucher specimens collected during the present study.
Family Species Code N English common namea Local common nameb Sourcec Sphyrnidae Sphyrna zygaena Szy_01 1 Smooth hammerhead - AY830772
Sphyrna lewini Sle_01 1 Scalloped hammerhead Pana; cornuda; martelo AY830768
Sphyrnasp. Ssp_279 1 - - Present study
FJ598659
Sphyrna tiburo Sti_01; 02 2 Bonnethead Cação siri; bejoca; martelo AY830770-71
Sphyrna tudes Stu_286; 289 2 Smalleye hammerhead Cação siri; bejoca; martelo Present study FJ598662-63
Sphyrna mokarran Smo_01 1 Great hammerhead Pana; cornuda; martelo AY830769 Carcharhinidae Rhizoprionodon terraenovae Rte_01; 02 2 Atlantic sharpnose shark Prenhoca; milho verde AY830763-64
Carcharhinus signatus Csi_01 1 Night shark - AY830744
Carcharhinus perezii Cpe_01; 02 2 Caribbean reef shark Fidalgo; azul AY830739-40
Carcharhinus longimanus Clo_01; 02 2 Oceanic whitetip shark - AY830735-36
Carcharhinus obscurus Cob_01; 02 2 Dusky shark Fidalgo AY830737-38
Carcharhinus falciformis Cfa_01; 02 2 Silky shark Lombo-preto AY830725-26
Carcharhinus plumbeus Cpl_01; 02 2 Sandbar shark Cação-galhudo AY830741-42
Carcharhinus altimus Cal_01 1 Bignose shark - AY830722
Carcharhinus acronotus Cac_01 1 Blacknose shark Flamengo AY830721
Carcharhinus brevipinna Cbr_01 1 Spinner shark - AY830723
Carcharhinus limbatus Cli_01; 02 2 Blacktip shark Sacurí; galha preta AY830731-32
Carcharhinus limbatus Cli_293 1 - Sacurí; galha preta Present study FJ598682
Carcharhinus porosus Cpo_01 1 Smalltail shark Prenhoca AY830743
Carcharhinus porosus Cpo_288 1 - Prenhoca Present study FJ598683
Carcharhinus leucas Cle_01 1 Bull shark Boca redonda AY830730
Carcharhinus leucas Cle_292 1 - Boca redonda Present study FJ598691
Carcharhinus isodon Cis_01; 02 2 Finetooth shark - AY830728-29
Isogomphodon oxyrhyncus Iox_291 1 Daggernose shark Cação pato Present study FJ598693
Prionacea glauca Pgl_01; 02 2 Blue shark - AY830761-62
Negaprion brevirostris Nbr_01 1 Lemon shark Cação areia AY830756
Galeocerdo cuvier Gcu_01 1 Tiger shark Tintureira; jaguará AY830746 Triakidae Mustelus norrisi Mno_01 1 Narrowfin smooth-hound - AY830755
Mustelus canis Mca_01 1 Dusky smooth-hound Canejo AY830754 Alopidae Alopias superciliosusd Asu_01; 02 2 Bigeye thresher - AY830718-19
Alopias vulpinusd Avu_01 1 Thresher - AY830720
minator kit (MEGABACE: Amersham Biosciences UK). Samples were sequenced in a MegaBACE 1000 (GE HealthCare) automatic sequencer. In addition to the prim-ers mentioned above, the internal primer 12SINT was used to ensure complete sequencing of the target region (Greiget al., 2005).
Phylogenetic analyses
Sequences were edited and aligned using the CLUSTALW program (Thompsonet al., 1997) run in the BIOEDIT 5.0.6 package (Hall, 1999), with subsequent vi-sual checking and manual correction of sequences.
The quality of the available phylogenetic information was evaluated following alignment and prior to data analy-sis. Saturation of substitutions was tested through a com-parison of the number of transitions and transversions versusdivergence, thereby providing a visual image of sat-uration through the DAMBE (Xia and Xie, 2001) program. This procedure was necessary due to the large number of taxa being evaluated, which included members from dis-tinct families, and which could thus increase the probability of saturation among sequences.
The first step in the taxonomic identification of speci-mens was sequencing the seven known species, these then being added to the Greiget al.(2005) data base (Table 1). Inferences on the relationships between samples and the different taxonomic levels were based on uncorrected “p” distances. In this case, the aim was to determine the genetic distance (divergence) of the marker in question in order to define the limits between each taxonomic level.
For phylogenetic analyses, Maximum Likelihood (ML) trees were constructed using the GARLI program, version 0.951 (Zwickl D, PhD thesis, University of Texas at Austin, Texas, 2006). The preference for this program rather than the others available was due to its capacity to run large numbers of bootstrap replicates on large data bases, such as the one used here, which has both a wide va-riety of taxa and long sequences. The analysis was based on the General Time Reversible algorithm, and the signifi-cance of the groupings observed in all trees being estimated through bootstrap analysis based on 1000 pseudoreplicates. The robustness of this analysis was evaluated on consider-ing bootstrap values of at least 90% as beconsider-ing statistically significant.
Bayesian analysis was carried out in the MrBayes programme (Ronquist and Huelsenbeck, 2003). This proce-dure is similar to ML, but differs in its approach to the use of probabilities. In Bayesian analysis, inferences are based on a posteriori probabilities of the phylogenetic trees (Schneider, 2007), which in MrBayes are estimated using Markov Chain analysis. We used four default heated chains, each of five million generations sampled every 100 generations by applying the stop rule command. The runs were subsequently evaluated for cut-off by using the Tracer program (Rambaut and Drummond, 2004).
Results
A sequence of 1380 base-pairs was obtained for the 12S-16S region in 122 shark samples. Of these, 378 sites were variable and 325 were informative for parsimony analysis. Mean nucleotide composition was 25.5% Thy-mine, 22.0% Cytosine, 36.0% Adenine and 16.5% Gua-nine. Based on plotting divergence levels against transition and transversion rates, no evidence of saturation was found (not shown).
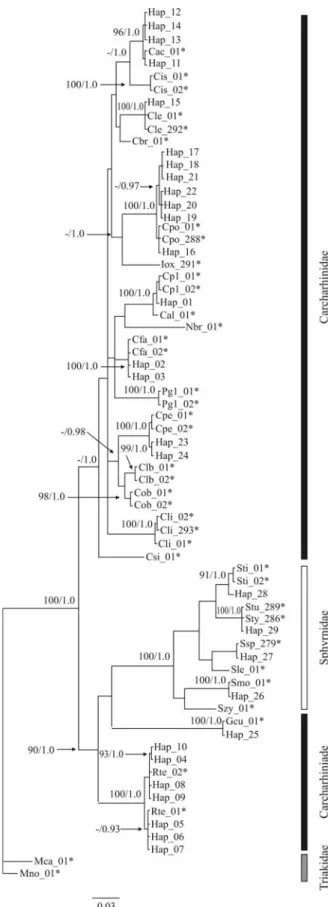
Bayesian and ML trees were constructed for the order Carchariniformes, as all the species identified in the study belonged to this group. The 122 sequences resulted in the identification of 29 different haplotypes (Table 2), which were used in phylogenetic analysis. The trees indicated that the samples belonged to at least 11 species (Figure 1), four of which from the hammerhead family Sphyrnidae
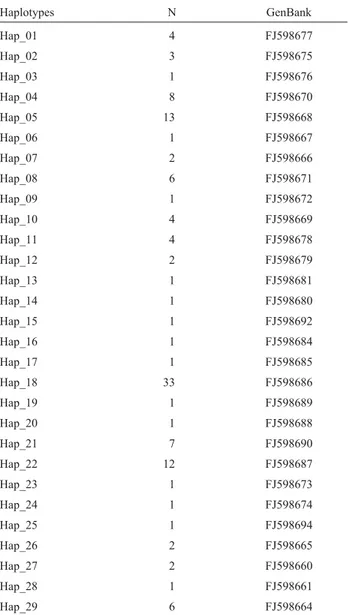
Table 2- Number of samples collected with their respective haplotypes and GenBank access.
Haplotypes N GenBank
Hap_01 4 FJ598677
Hap_02 3 FJ598675
Hap_03 1 FJ598676
Hap_04 8 FJ598670
Hap_05 13 FJ598668
Hap_06 1 FJ598667
Hap_07 2 FJ598666
Hap_08 6 FJ598671
Hap_09 1 FJ598672
Hap_10 4 FJ598669
Hap_11 4 FJ598678
Hap_12 2 FJ598679
Hap_13 1 FJ598681
Hap_14 1 FJ598680
Hap_15 1 FJ598692
Hap_16 1 FJ598684
Hap_17 1 FJ598685
Hap_18 33 FJ598686
Hap_19 1 FJ598689
Hap_20 1 FJ598688
Hap_21 7 FJ598690
Hap_22 12 FJ598687
Hap_23 1 FJ598673
Hap_24 1 FJ598674
Hap_25 1 FJ598694
Hap_26 2 FJ598665
Hap_27 2 FJ598660
Hap_28 1 FJ598661
(Sphyrna mokarran, Sphyrna tudes, Sphyrna tiburo and Sphyrnasp.). An un-identified species was closely aligned withSphyrna lewiniobtained from GenBank. A fifth spe-cies, the tiger shark (Galeocerdo cuvier), formed the sister group of the Sphyrnidae, distinct from the family Carcharhinidae.
The genus Rhizoprionodon (Carcharhinidae) was well-represented, with 35 individuals, divided into two well-defined subgroups in the trees. This genus was the sis-ter group to the Sphyrnidae/G. cuvierdichotomy.
The genusCarcharhinusrevealed the largest number of species, with five, namely Carcharhinus falciformis, Carcharhinus leucas,Carcharhinus perezi,Carcharhinus acronotus, andCarcharhinus porosus. The latter was the most common, with 57 individuals. A trichotomy was ob-served between the individuals of this group represented by the haplotype Hap_01 and sequences of Carcharhinus plumbeus and Carcharhinus altimus obtained from GenBank (Figure 1).
The genetic divergence values (uncorrected “p” dis-tance) varied between 0.00% and 15.35% (Table 3). Inter-specific divergence between members of the Carcharhinidae and Sphyrnidae was between 7.66% and 10.00%. Similar values were recorded when comparing these two families with the Triakidae (6.65-9.80% for the Carcharhinidae, and 9.60-10.80% for the Sphyrnidae). Dis-tances between Galeocerdo and other genera of the Carcharhinidae (7.56-8.63%) were similar to those found between families, whereas very much lower values (3.80-4.82%) were recorded between two other carcharhinid genera, Carcharhinus and Isogomphodon. The value for trichotomy involvingC. altimus,C. plumbeus and Hap_01 was extremely low (0.53%), similar to intra-specific levels of divergence (see below), thus imped-ing reliable identification of specimens.
Regarding intra-specific divergence and despite the lack of a clear definition of divergence criteria for the dif-ferentiation of genera, the 12S-16S region proved to be ef-fective for identifying species. All those specimens which diverged from identified species at the 0.0-0.4% level were allocated to the respective species, given that such values are well below the levels observed between distinct species (Table 3).
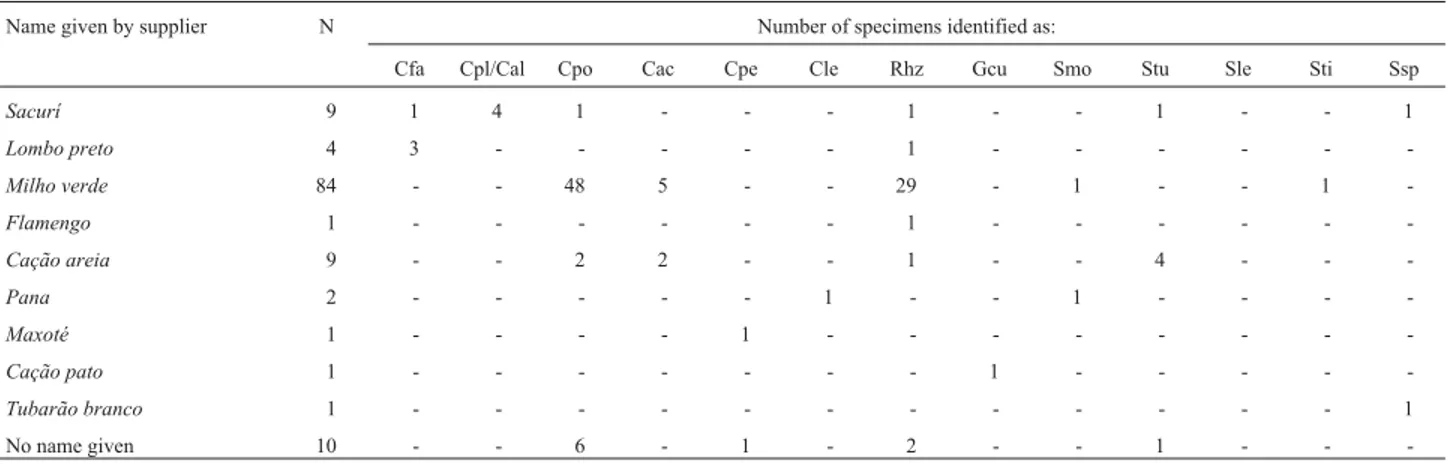
The identification of specimens by fishermen and fishmongers bore little relationship to their taxonomic clas-sification (Table 4). Whenever a vernacular name was given to two or more specimens, they invariably repre-sented at least two different genera. Similarly, only one identified species (C. altimus/C. plumbeus) represented by more than one specimen was consistently allocated to a sin-gle name - “Sacurí” - although sharks of five other species were also identified by this same name. Even the most com-monly-used name (“Milho Verde”) was applied to a large number of individuals from two different genera. This quite emphatically confirms that the personnel involved directly
Figure 1- Phylogram based on a Bayesian analysis of mitochondrial DNA sequences (12S-16S), rooted withMustelus norrisiandMustelus canis
in the exploitation of stocks have little reliable knowledge of the shark species involved.
Discussion
Stevenset al.(2000) and Dulvy et al.(2003) have suggested that current trends of fishery exploitation of stocks of elasmobranchs are unsustainable, and that many shark species present a serious extinction risk. Some spe-cies, such as the blue shark (Prionace glauca) exceed maxi-mum sustainable yield levels as a consequence of current trade volumes (Clarkeet al., 2006b). A major problem for
the investigation and management of stocks is the identifi-cation of those species being harvested, especially difficult in the case of sharks, given both the taxonomic complexity of this group and typical processing of the catch at sea, when most of the diagnostic traits of the specimen are re-moved.
A number of studies – including the present one – have now shown that molecular markers can constitute an extremely effective tool for the resolution of taxonomic questions in shark species. Pinhalet al.(2008) used frag-ment-sizes from a PCR of 5S region repeats to identify dif-Table 3- Uncorrected “p” distance (%) between identified species and those from Table 1. Values are the medium between each comparison. a – se-quences from Greiget al.(2005); b – voucher specimens collected during the present study; () number of specimens; - Not calculated.
Slea Ssp.b Stiab Stub Smoab Rhzab Cpeab Cfaab Cplab Cala Cacab Cliab Cpoab Cleab Ioxb Gcuab Mnoa Mcaa Asua Avua
Slea
(1)
-Ssp.b
(3) 2.5 0
Stiab
(3) 3.3 3.6 0.4 Stub(8) 4.3 4.7 2.4 0.06 Smoab
(3) 5.6 5.9 5.5 5.6 0
Rhzab
(37) 8.3 7.9 7.7 7.66 7.67 0.4 Cpeab
(4) 9 9.2 8.75 8.9 9.77 6.8 0.18 Cfaab
(6) 9.05 9.25 8.6 8.48 9.3 6.32 3.85 0.1 Cplab(4) 8.6 8.9 8.97 8.46 8.73 6.52 4.57 3 0.2 Cala
(1) 8.6 9 8.83 8.43 8.6 6.58 4.42 3.05 0.53 -Cacab
(9) 8.6 8.7 8.48 8.8 8.85 6.56 4.32 3.35 3.88 3.94 0.14 Cliab
(3) 8.6 9.1 8.4 8.7 9.56 7.37 4.85 4.23 5 4.73 4.36 0.06 Cpoab
(58) 9.1 9.04 8.96 9 9.28 7 4.89 4.53 5.41 5.15 4.08 5.69 0.32 Cleab(3) 9.4 10 8.83 8.88 9.33 7.3 4.22 3.7 4.45 4.13 3.66 4.95 4.99 0.13 Ioxb
(1) 8.7 9 8.2 8.3 8.4 6.5 4.82 4.15 4.53 4.2 3.8 4.6 4.48 4.13 -Gcuab
(2) 9.3 9.6 8.33 8.46 9.1 8.12 8.27 8.15 8.46 8.5 7.56 8.33 8.03 8.63 7.7 0 Mnoa
(1) 9.8 10.8 10.4 10.46 9.7 9.26 8.35 7.45 8.56 8.6 8.2 7.96 7.67 8.06 8.2 9.8 -Mcaa
(1) 9.6 10.3 9.63 10.13 10.1 8.78 7.42 6.65 7.83 7.5 7.34 7.3 7.27 6.96 8 9 3.1 -Asua(2) 15 15 14.9 14.23 14.2 14.78 15 15.35 14 14 14.44 14.16 14.72 15.16 14.7 14.7 13 12.3 0 Avua
(1) 14.5 14.7 14.63 14 13.9 14.2 14.77 14.95 13.4 13.4 13.96 14 14.32 14.73 14.6 13.7 13 12.9 5.5
-Table 4- Matrix comparing the name given to the specimen by the supplier and species identified through molecular analysis of the 122 samples of shark tissue collected during the present study.
Name given by supplier N Number of specimens identified as:
Cfa Cpl/Cal Cpo Cac Cpe Cle Rhz Gcu Smo Stu Sle Sti Ssp
Sacurí 9 1 4 1 - - - 1 - - 1 - - 1
Lombo preto 4 3 - - - 1 - - -
-Milho verde 84 - - 48 5 - - 29 - 1 - - 1
-Flamengo 1 - - - 1 - - -
-Cação areia 9 - - 2 2 - - 1 - - 4 - -
-Pana 2 - - - 1 - - 1 - - -
-Maxoté 1 - - - - 1 - - -
-Cação pato 1 - - - 1 - - - -
-Tubarão branco 1 - - - 1
No name given 10 - - 6 - 1 - 2 - - 1 - -
ferent species of sharks collected in Brazilian and Venezuelan coastal sites. This was effective, but cannot be used for phylogenetic analysis.
The mitochondrial region used here permitted the identification of all the specimens collected, as well as con-tributing to the understanding of certain phylogenetic ques-tions, thereby corroborating the results of Greig et al. (2005). It is important to note that intra-specific variation was low, this emphasising the monophyletic pattern of indi-viduals from a given species. These same authors also noted that the low levels of intra-specific variability did not result in paraphyletic relationships among species. The same was observed here, with only one unsolved question: the arrangement betweenC. altimus, C. plumbeusand indi-viduals represented by the Hap_01 haplotype. This may be due to paraphyly among these species, as observed by Greiget al.(2005) and Heist and Gold (1999) in their RFLP analyses of the cytochrome b gene, in which they found more substitutions between the Atlantic and Pacific popu-lations ofC. plumbeusthan between the Atlantic popula-tions of this same species andC. altimus.
In the hammerhead group, in addition to the three spe-cies identified unequivocally (S. mokarran,S. tudes, andS. tiburo), a distinct clade was observed, which was the closest to, but nevertheless well distinguished (divergence of 2.5%) from,S. lewini, and almost certainly represents a distinct but as yet unidentified species. One possibility is that this species isSphyrna media, which is known to occur in the region, but was not represented in the data bank. It is also possible that two cryptic lineages of S. lewini coexist in the Atlantic (Quattroet al., 2006). The resolution of these relationships is of major importance, considering that all the hammerhead species are considered to be especially vulnerable to the ef-fects of commercial fishing (MMA, 2004).
It was not possible to reliably identify the different species of the genusRhizoprionodon, given that the diver-gence recorded between the different subgroups (< 1%) was insufficient to arrive at reliable conclusions as to species status. The lack of data for other spespecies of this genus -e.g. Rhizoprionodon lalandeiandRhizoprionodon porosus (Compagno, 1984; Lessa and Santana, 1998) - prohibits confirmation of the taxa recorded here. The occurrence of these two species off northern Brazil might nevertheless ac-count for the two subgroups observed in the arrangement presented here (Figure 1).
One especially interesting result arising from the present study was the high divergence values observed be-tween Galeocerdo cuvier and all the other carcharhinid species, which appears to contradict its inclusion in this group, thereby supporting Compagno (1984) and Szpilman (2004). With Rhizoprionodon as the sister group to a Galeocerdo/Sphyrnidae clade, the sum of evidence from analyses appears to indicate that bothRhizoprionodonand Galeocerdomay, in fact, represent distinct families. Cer-tainly, the divergence values recorded for these two genera
were consistent with those observed between members of the Sphyrnidae and Carcharhinidae, although this hypothe-sis would need to be tested with additional markers and analyses.
By contrast, the results of the present study also indi-cate that one of the most endangered species of the region – the daggernose shark,Isogomphodon oxyrhyncus- does in fact belong to the genus Carcharhinus, as argued by Compagno (1984). This species, once among the most common sharks on the Bragança fish market, was not even collected in our study. This further supports the classifica-tion of this species as critically endangered (MMA, 2004; IUCN), due to a combination of restricted geographic range and overexploitation by the fishery industry.
The Carcharhinus species identified in the present analysis are all known to occur in the study area (Compagno, 1984; Lessaet al., 1999; Szpilman, 2004). Of these,C. porosuswas by far the most common in our sam-ple, as observed in previous studies (Elias MP, MSc Disser-tation, Universidade Federal do Pará, Belém-PA, 2004). While this species is not listed internationally (IUCN), it is among those sharks considered to be endangered by the Brazilian government (MMA, 2004).
Summing up, the results of the present study not only confirmed the efficiency of the 12S-16S marker for the identification of shark species, but also emphasise its po-tential as a phylogenetic tool. Nevertheless, the arrange-ments presented here need to be tested with additional markers, considering that most of the groupings – espe-cially those involving the Carcharhinidae – were not statis-tically significant. This is most likely related to the low levels of genetic variability intrinsic to sharks, which im-plies that the complementary analysis of more variable markers, such as the mitochondrial control region (D-loop), COI or the cytochrome b gene, would provide more defini-tive answers.
This is the first molecular study of sharks from north-ern Brazil. It was very successful in the taxonomic identifi-cation of cryptic specimens, especially those of the genera CarcharhinusandSphyrna, which are normally classified to no more than the genus level (Ward, 2000; Chanet al., 2003; Wardet al., 2008). Thus, the molecular monitoring of local catches may prove to be an essential tool in the de-velopment of effective strategies for the conservation and management of shark populations in this region.
Acknowledgments
We are grateful to the Instituto de Estudos Costeiros (IECOS) and CNPq (projeto no. 552126/2005-5) for finan-cial and logistical support.
References
assessment of the international fin trade and law enforce-ment. Conserv Genet 6:775-788.
Baum JK, Myers RA, Kehler DG, Worm B, Harley SJ and Doherty PA (2003) Collapse and conservation of shark pop-ulations in the northwest Atlantic. Science 299:389-392. Baum JK and Myers RA (2004) Shifting baselines and the decline
of pelagic sharks in the Gulf of Mexico. Ecol Lett 7:135-145.
Camhi M, Fowler S, Musick J and Bräutigan FS (1998) Sharks & their relatives. Ecology and Conservation. IUCN/SSC Shark Specialist Group. IUCN, Gland, and Cambridge, 39 pp. Castro JI (1993) A Field Guide to the Sharks Commonly Caught
in Commercial Fisheries of the Southeastern United States. NOAA Technical Memorandum NMFS-SEFSC-338. Na-tional Oceanic and Atmospheric Administration, Miami, 47 pp.
Clarke SC, Magnussen JE, Abercrombie DL, Mcallister MD and Shivji MS (2006a) Identification of shark species composi-tion and proporcomposi-tion in the Hong Kong shark fin market based on molecular genetics and trade records. Conserv Biol 20:201-211.
Clarke SC, McAllister MK, Milner-Gulland EJ, Kirkwood GP, Michielsens CGJ, Agnew DJ, Pikitch EK, Nakano H and Shivji MS (2006b) Global estimates of shark catches using trade records from commercial markets. Ecol Lett 9:1115-1126.
Chan RWK, Dixon PI, Pepperell JGD and Reid D (2003) Applica-tion of DNA-based techniques for the identificaApplica-tion of whaler sharks (Carcharhinus spp) caught in protective beach meshing and by recreational fisheries off the coast of New South Wales. Fish Bull 101:910-914.
Coelho R and Erzini K (2008) Identification of deep water lantern sharks (Chondrichthyes, Etmopteridae) using morphometric data and multivariate analysis. J Mar Biol Assoc UK 88:199-204.
Compagno LJV (1984) FAO species catalogue. v. 4. Sharks of the world. An annotated and illustrated catalogue of shark spe-cies known to date. Part 2. Carcharhiniformes. FAO Fish Synop 4:251-655.
Cortés E (2002) Stock assessment of small coastal sharks in the U.S. Atlantic and Gulf of Mexico. Conserv Biol 16:1048-1062.
Douady CJ, Dosay M, Shivji MS and Stanhope MJ (2003) Molec-ular phylogenetic evidence refuting the hypothesis of Batoidea (rays and skates) as derived sharks. Mol Phylo-genet Evol 26:215-221.
Dulvy NK, Sadovy Y and Reynolds JD (2003) Extinction vulner-ability in marine populations. Fish Fish 4:25-64.
Fundação PROZEE (2006) Relatório Final do Projeto de Monito-ramento da Atividade Pesqueira no Litoral do Brasil – Pro-jeto Estatpesca. SEAP, Brasilia, 328 pp.
FAO (Food and Agriculture Organization) (2000) Conservation and Management of Sharks. FAO Tech Guide Resp Fish 4:1-37.
Greig TW, Moore MK, Woodley CM and Quattro JM (2005) Mi-tochondrial gene sequences useful for species identification of western North Atlantic Ocean sharks. Fish Bull 103:516-523.
Hall TA (1999) BioEdit: A user-friendly biological sequence alignment editor and analysis program for Windows 95/98/NT. Nucleic Acids Symp Ser 41:95-98.
Heist EJ and Gold JR (1999) Genetic identification of sharks in the U.S. Atlantic large coastal shark fishery. Fish Bull 97:53-61.
Hoelzel AR (2001) Shark fishing in fin soup. Conserv Genet 2:69-72.
Hoenig JM and Gruber SH (1990) Life-history patterns in the elasmobranchs: Implications for fisheries management. In: Pratt HL and Gruber SH (eds) Elasmobranchs as Living Re-sources: Advances in the Biology, Ecology, Systematics, and the Status of the Fisheries. Proceedings of the Second United States-Japan Workshop East-West Center, Hono-lulu, pp 1-16.
Iglésias SP, Lecointre G and Sellos DY (2005) Extensive para-phylies within sharks of the order Carcharhiniformes in-ferred from nuclear and mitochondrial genes. Mol Phylo-genet Evol 34:569-583.
Lessa R and Santana FM (1998) Age determination and growth of the smalltail shark, Carcharhinus porosus, from northern Brazil. Mar Freshw Res 49:705-711.
Magnussen JE, Pikitch EK, Clarke SC, Nicholson C, Hoelzel AR and Shivji MS (2007) Genetic tracking of basking shark products in international trade. Anim Conserv 10:199-207. Myers RA, Baum JK, Shepherd TD, Powers SP and Peterson CH
(2007) Cascading effects of the loss of apex predatory sharks from a coastal ocean. Science 315:1846-1850. Paiva MP (1997) Recursos Pesqueiros Estuarinos e Marinhos do
Brasil. Edições UFC, Fortaleza, 286 pp.
Pank M, Stanhope M, Natanson L, Kohler N and Shivji M (2001) Rapid and simultaneous identification of body parts from the morphologically similar sharksCarcharhinus obscurus
andCarcharhinus plumbeus(Carcharhinidae) using multi-plex PCR. Mar Biotechnol 3:231-240.
Pinhal D, Gadig OBF, Wasko AP, Oliveira C, Ron E, Foresti F and Martins C (2008) Discrimination of Shark species by simple PCR of 5S rDNA repeats. Genet Mol Biol 31:361-365.
Quattro JM, Stone DS, Driggers WB, Anderson CA, Priede KA, Hoppmann EC, Campbell NH, Duncan KM and Grady JM (2006) Genetic evidence of cryptic speciation within ham-merhead sharks (GenusSphyrna). Mar Biol 148:1143-1155. Rambaut A and Drummond AJ (2004) Tracer, v. 1.1. University
of Oxford, Oxford.
Ronquist F and Huelsenbeck JP (2003) MrBayes 3: Bayesian in-ference of phylogenetic trees. Bioinformatics 19:1572-1574.
Sambrook J, Fritsch EF and Maniatis T (1989) Molecular Clon-ing: A Laboratory Manual. 2nd edition. Cold Spring Harbor Laboratory Press, New York, pp 1453.
Sanger F, Nichlen S and Coulson AR (1977) DNA sequencing with chain-termination inhibitors. Proc Natl Acad Sci USA 74:5463-5468.
Schneider H (2007) Métodos de Análise Filogenética: Um Guia Prático. Holos Editora e Sociedade Brasileira de Genética, Riberão Preto, pp 144.
Shepherd TD and Myers RA (2005) Direct and indirect fishery ef-fects on small coastal elasmobranchs in the northern Gulf of Mexico. Ecol Lett 8:1095-1104.
Shivji MS, Chapman DD, Pikitch EK and Raymond PW (2005) Genetic profiling reveals illegal international trade in fins of the great white shark, Carcharodon carcharias. Conserv Genet 6:1035-1039.
Stevens JD and Wayte SE (1998) A review of Australia’s pelagic shark resources. FRDC Project n. 98/107. Fisheries Re-search and Development Corporation, Canberra, 64 pp. Stevens JD, Bonfil R, Dulvy NK and Walker PA (2000) The
ef-fects of fishing on sharks, rays, and chimaeras
(Chondrichthyans) and the implications for marine ecosys-tems. ICES J Mar Sci 57:476-494.
Szpilman M (2004) Tubarões no Brasil: Guia Prático de Iden-tificação. Editora Aqualittera, Rio de Janeiro, 160 pp. Thompson JD, Gibson TJ, Plewniak F, Jeanmougin J and Higgins
DG (1997) The clustal- windows interface: Flexible strate-gies for multiple sequence alignment aided by quality analy-sis tools. Nucleic Acids Res 25:76-4882.
Valenzuela A, Bustamante C and Lamilla J (2008) Morphological characteristics of five bycatch sharks caught by southern Chilean demersal longline fisheries. Sci Mar 72:231-237. Xia X and Xie Z (2001) DAMBE: Data analysis in molecular
biol-ogy and evolution. J Hered 92:371-373.
Ward RD (2000) Genetics in fisheries management. Hydrobio-logia 420:191-201.
Ward RD, Holmes BH, William TW and Last PR (2008) DNA barcoding Australasian chondrichthyans: Results and poten-tial uses in conservation. Mar Freshw Res 59:57-71.
Internet Resources
Centro de Pesquisa e Gestão de Recursos Pesqueiros do Litoral
Norte (CEPNOR/IBAMA) (2004).
http://www.ibama.gov.br/cepnor/index.php?id_menu = 52 (January 20, 2007).
International Union for Conservation of Nature (IUCN), http://www.iucn.org/themes/ssc/redlist2006/redlist2006.ht m (June 16, 2007).
Lessa R, Santana FM, Rincón G, Gadig OB and El-Deir ACA (1999) Avaliação a ações prioritárias para a conservação de biodi-versidade da zona costeira e marinha. Biodiversidade de elasmobrânquios do Brasil. http://www.bdt.org.br/work-shop/costa/elasmo (June 17, 2007).
NIH Genetic Sequence Database (GenBank),
http://www.ncbi.nlm.nih.gov/Genbank/ (June 20, 2007).
Associate Editor: Louis Bernard Klaczko