Genetic structure and gene flow in
Eugenia dysenterica
DC in the Brazilian
Cerrado utilizing SSR markers
Maria Imaculada Zucchi
1, Rosana Pereira Vianello Brondani
2, José Baldin Pinheiro
3,
Lázaro José Chaves
3, Alexandre Siqueira Guedes Coelho
4and Roland Vencovsky
1,31
Universidade de São Paulo, ESALQ, Departamento de Genética, Piracicaba,SP, Brazil.
2Embrapa Arroz e Feijão, Santo Antônio de Goiás, GO, Brazil.
3
Universidade Federal de Goiás, Escola de Agronomia, Campus Samambaia, Goiânia, GO, Brazil.
4Universidade Federal de Goiás, Instituto de Ciências Biológicas, Campus Samambaia, Goiânia, GO,
Brazil.
Abstract
The “cagaita tree” (Eugenia dysenterica) is a plant found widespread in the Brazilian Cerrado. Its fruit is used for popular consumption and for industrial purposes. This study opens a new perspective for the generation of population genetic data and parameters estimates for devising sound collection and conservation procedures for Eugenia dysenterica. A battery of 356 primer pairs developed for Eucalyptus spp. was tested on the “cagaita tree”. Only 10 primer pairs were found to be transferable between the two species. Using a polyacrilamide gel, an average of 10.4 alleles per locus was detected, in a sample of 116 individuals from 10 natural “cagaita tree” populations. Seven polymorphic loci allowed estimation of genetic parameters, including expected average heterozygosity He= 0,442, among population diversity, RST= 0,268 and gene flow Nm = 0,680. Results indicated a potential of SSR locus transferability developed forEucalyptus to other species of different genera, such as in the case of the “cagaita tree”. The high genetic diversity among populations detected with SSR markers indicated that these markers are highly sensitive to detect population structure. Estimated Nm values and the existence of private alleles indicated reduced gene flow and consequently possible damage to the metapopulation structure.
Key words:SSR, Myrtaceae, Cerrado, tropical tree, genetic diversity and transferability.
Received: November 21, 2002; Accepted: August 12, 2003.
Introduction
Eugenia dysenterica, commonly known as the “cagaita tree” is a fruit species native to the Cerrado (Bra-zilian Savannah) region belonging to the Myrtaceae fam-ily that presents potential for use in agricultural production systems (Almeida, 1998). It is outstanding for its social and economic potential for processing many sub-products and may contribute to increase income as well as jobs in the regional communities. Besides being an ornamental and honey-bearing plant, it can be used for cork extraction and in small buildings or in the manufac-ture of charcoal, providing good quality firewood; its bark is used in tanneries. Its leaves have anti-diarrhea and jaun-dice properties and its fruits are laxative (Heringer and Ferreira, 1974).
The fruit trees native to the Cerrado are species from several genera and families that produce fruits of interest for food and industrialization. There is a potential and growing market for the fruit trees, which, however, is not much exploited by farmers. Fruit harvesting is mostly ex-tractive or predatory.
The Cerrado vegetation in Brazil has been frag-mented by expanding agricultural frontiers, which have af-fected the population dynamic of many species, including the “cagaita tree” populations. Alteration in these areas may reduce the genetic variability by founder or bottleneck effects. Genetic drift and restricted gene flow increase in-breeding and also the genetic divergence among popula-tions. Inbreeding can lead to the fixation of deleterious alleles, threatening certain populations present in this habi-tat with extinction (Gilpin and Soulé, 1986; Younget al., 1996).
The diversity among populations, gene flow and other genetic parameters should be evaluated in a study of natural populations of native species. Knowledge of native www.sbg.org.br
Send correspondence to: Maria Imaculada Zucchi. Universidade de São Paulo, ESALQ, Departamento de Genética, Av. Pádua Dias, 11 Caixa Postal 83, 13400-970 Piracicaba, SP, Brazil. E-mail: [email protected].
species populations has been widened with the advent of molecular markers. Microsatellite markers (SSR) have been used in natural population studies (Collevattiet al., 1999; Daynandanet al., 1997) as they are highly polymor-phic when compared with other classes of markers. SSR markers have been widely used as a tool to answer several questions on population genetics, such as gene flow and pa-ternity analysis (Wright and Bentzen, 1994).
However, advances in the use of microsatellites have been hindered due to the high cost and time taken to de-velop specific primers for each locus of the native species. The chance of success in the transferability (heterologous amplification) of DNA sequences by PCR is inversely re-lated with the evolutionary distance between the two spe-cies. Many studies have shown the possibility of using pairs of primers designed for one species belonging to the same genus (Ciprianiet al., 1999; Isagi and Suhandono, 1997) or even among different genera (Roaet al., 2000; White and Powell, 1997).
In the present study the transferability to Eugenia dysentericaof primer pairs developed forEucalyptusspp., which belongs to the same family, was investigated in order to identify microsatellite markers in the “cagaita tree” for studies of the genetic variability, population structure, gene flow and reproductive system. The main objective of this research was the generation of information for domestica-tion and breeding of the species and its conservadomestica-tion.
Material and Methods
Plant material
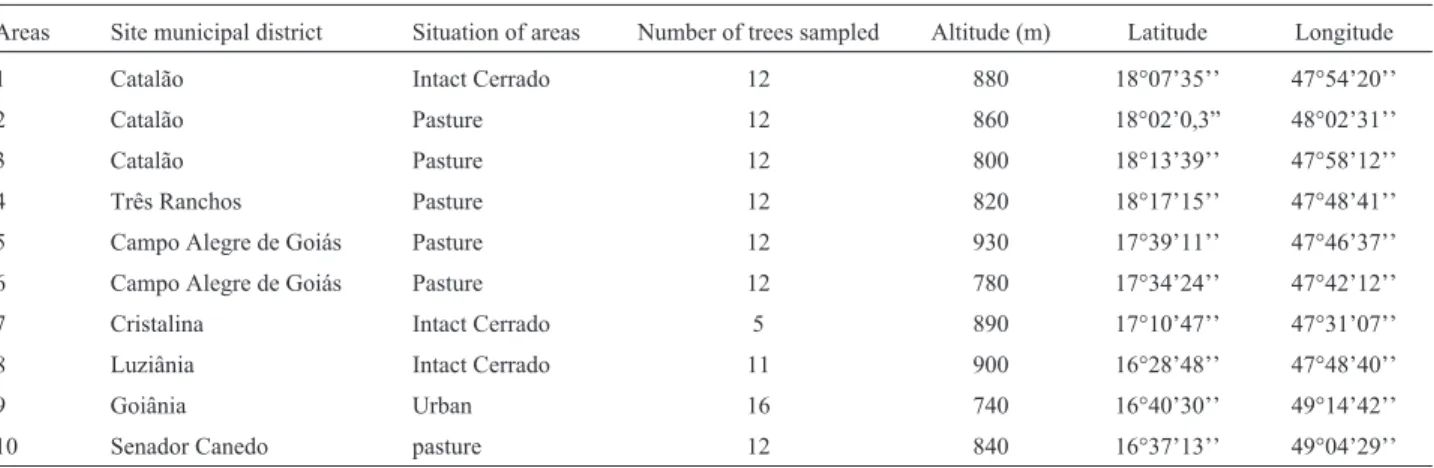
The study material was collected in ten locations in southeast Goiás state, forming ten populations, represented by 116 trees (matrices). Plant material (leaves) was col-lected from each one of the 116 “cagaiata trees” for genotypic characterization of the plants. Table 1 shows the locations where the populations were collected, including some characterization of the areas.
SSR locus transferability and amplification by PCR
In this study the transferability of primer pairs devel-oped forEucalyptuswas assessed forEugenia dysenterica, which belongs to the same Mirtaceae family but to different genera.
Three hundred and fifty-six primer pairs developed for Eucalyptus spp. (Eucalyptus grandi x Eucalyptus urophilla) by Brondaniet al. (1998) were used. These pairs of primers were tested for amplification in Eugenia dysenterica.
For the reaction of amplification by PCR, 15 ng of genomic DNA were used in 25 µL volume containing
50 mM KCl, 20 mM Tris-HCl pH 8.8; 1.5 mM MgCl2; 10 mM dNTPs; 0.2µm of each primer (forward and
re-verse) and 1U of Taq polymerase.
The PCR protocol consisted of a prior initial denatur-ation at 96 °C for 3 min, followed by 30 cycles at 94 °C for 30 s, 60 °C for 1 min, 72 °C for 1 min, and the last step for extension at 72 °C for 7 min. The amplified fragments were separated in 4% polyacrylamide gel, in a run with 1X TBE at 2000 v for 2 h, and stained with silver nitrate.
Statistical analysis of the data
Allelic and genotypic frequencies for each locus were obtained from the data readings in the gels. These frequen-cies were submitted to a goodness-of-fit test (Fisher’s exact test) to the proportion of Hardy-Weinberg equilibrium as defined by Weir (1996) using the TFPGA program (Miller, 1997). Fisher’s exact test was performed by the conven-tional Monte Carlo method using 10 batches with 1,000 permutations per batch.
Genetic diversity and F statistics were estimated un-der a random model according to Weir (1996) where the sampled populations are considered as representatives of the species with a common evolutionary history. The allelic frequencies, the number of alleles per locus (A), the ob-served (Ho) and expected (He) heterozygosities and the F statistics of Wright (FIS, FSTand FIT) were estimated using the GDA program (Lewis and Zaykin, 2000).
Table 1- Locations in the state of Goiás, number of “cataiga trees” sampled and respective geographic position.
Areas Site municipal district Situation of areas Number of trees sampled Altitude (m) Latitude Longitude
1 Catalão Intact Cerrado 12 880 18°07’35’’ 47°54’20’’
2 Catalão Pasture 12 860 18°02’0,3” 48°02’31’’
3 Catalão Pasture 12 800 18°13’39’’ 47°58’12’’
4 Três Ranchos Pasture 12 820 18°17’15’’ 47°48’41’’
5 Campo Alegre de Goiás Pasture 12 930 17°39’11’’ 47°46’37’’
6 Campo Alegre de Goiás Pasture 12 780 17°34’24’’ 47°42’12’’
7 Cristalina Intact Cerrado 5 890 17°10’47’’ 47°31’07’’
8 Luziânia Intact Cerrado 11 900 16°28’48’’ 47°48’40’’
9 Goiânia Urban 16 740 16°40’30’’ 49°14’42’’
The mutation process in microsatellite loci is not in line with the expectations under an infinite alleles model with low mutation rates. Therefore the analogue of the FST statistics, namely the RSTparameter (Slatkin, 1995) devel-oped specifically for microsatellite data, was also used. Pa-rameters RSTand gene flow (Nm) were estimated using the RSTCal program (Goodman, 1997). The variability struc-ture was visualized using dendrograms constructed from the matrix of Nei’s genetic distances and the UPGMA clus-tering criteria, using the NTSYS program (Rolf, 1989). The stability of the clusters was also tested by a re-sampling procedure with 10,000 bootstraps.
The patterns of spatial variation were analyzed using Pearson’s coefficient of correlation (r) between Nei’s ge-netic distance matrix (Nei, 1972) and the geographic dis-tances between populations matrix. The significance of this correlation was tested through Mantel’s Z statistic (Mantel, 1967), using 9,999 random permutations.
Results
Transferability of SSR Eucalyptus primers to
Eugenia dysenterica
The 356 primers tested were classified according to the quality obtained in the PCR: 2.8% (ten pairs of primers) amplified clear SSR products, 30.0% presented non spe-cific band amplification and 67.2% did not amplify any band (Zucchiet al.2002).
The selected ten pairs of primers were used for the population genetic structure study. First, all primers were submitted to the basic program with 56 °C for primer an-nealing. Those that did not amplify satisfactorily were sub-mitted to amplification cycles with lower annealing temperatures. EMBRA 17 and EMBRA 134 amplified sat-isfactorily at 52 °C.
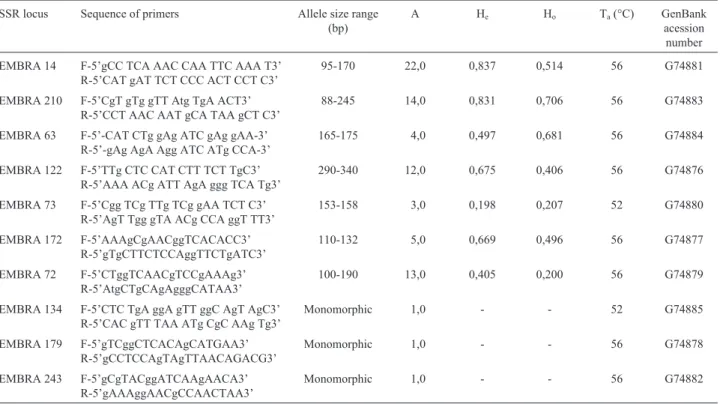
Table 2 shows the amplification conditions used for the ten SSR loci assessed and their respective allelic ampli-tudes. The greatest allelic amplitude was 167 base pairs. The allelic frequencies are shown in Table 3.
Genetic Variation
The average number of alleles per polymorphic locus was 10.43, with a range from three alleles (EMBRA 73 lo-cus) to 22 alleles (EMBRA 14 lolo-cus).
Table 4 shows that the observed heterozygosity ranged from 0.253 (population 1) to 0.599 (Population 10) with a mean of 0.458. The lowest expected heterozygosity was 0.276 for population 1, whereas population 9 presented the greatest expected heterozygosity (0.670). The mean value obtained was 0.442.
Fisher’s exact test (Table 5) showed that some popu-lations were not in Hardy-Weinberg Equilibrium for most of the studied loci. For population 10 this test was signifi-cant for six out of seven loci for which the Hardy-Weinberg equilibrium condition was therefore rejected.
Table 2- Sequence of primer pairs developed forEucalyptus*that amplified microsatellite loci inEugenia dysentericawith allele size range, number of alleles per locus (A), expected heterozigosity (He), observed heterozigosity (Ho) and annealing temperature (Ta).
SSR locus Sequence of primers Allele size range
(bp)
A He Ho Ta(°C) GenBank
acession number
EMBRA 14 F-5’gCC TCA AAC CAA TTC AAA T3’ R-5’CAT gAT TCT CCC ACT CCT C3’
95-170 22,0 0,837 0,514 56 G74881
EMBRA 210 F-5’CgT gTg gTT Atg TgA ACT3’ R-5’CCT AAC AAT gCA TAA gCT C3’
88-245 14,0 0,831 0,706 56 G74883
EMBRA 63 F-5’-CAT CTg gAg ATC gAg gAA-3’ R-5’-gAg AgA Agg ATC ATg CCA-3’
165-175 4,0 0,497 0,681 56 G74884
EMBRA 122 F-5’TTg CTC CAT CTT TCT TgC3’ R-5’AAA ACg ATT AgA ggg TCA Tg3’
290-340 12,0 0,675 0,406 56 G74876
EMBRA 73 F-5’Cgg TCg TTg TCg gAA TCT C3’ R-5’AgT Tgg gTA ACg CCA ggT TT3’
153-158 3,0 0,198 0,207 52 G74880
EMBRA 172 F-5’AAAgCgAACggTCACACC3’ R-5’gTgCTTCTCCAggTTCTgATC3’
110-132 5,0 0,669 0,496 56 G74877
EMBRA 72 F-5’CTggTCAACgTCCgAAAg3’ R-5’AtgCTgCAgAgggCATAA3’
100-190 13,0 0,405 0,200 56 G74879
EMBRA 134 F-5’CTC TgA ggA gTT ggC AgT AgC3’ R-5’CAC gTT TAA ATg CgC AAg Tg3’
Monomorphic 1,0 - - 52 G74885
EMBRA 179 F-5’gTCggCTCACAgCATGAA3’ R-5’gCCTCCAgTAgTTAACAGACG3’
Monomorphic 1,0 - - 56 G74878
EMBRA 243 F-5’gCgTACggATCAAgAACA3’ R-5’gAAAggAACgCCAACTAA3’
Monomorphic 1,0 - - 56 G74882
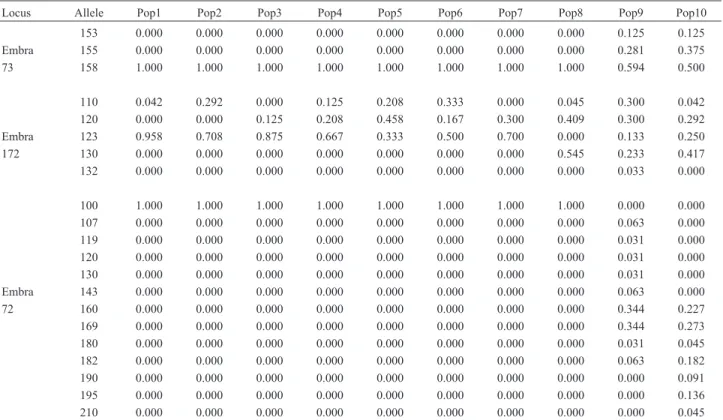
Table 3- Table of allelic frequencies of the seven SSR loci, estimated from 116 individuals of 10 populations ofEugenia dysenterica.
Locus Allele Pop1 Pop2 Pop3 Pop4 Pop5 Pop6 Pop7 Pop8 Pop9 Pop10
95 0.000 0.000 0.000 0.000 0.000 0.000 0.000 0.000 0.000 0.045
100 0.000 0.000 0.000 0.000 0.000 0.000 0.000 0.000 0.063 0.000
102 0.000 0.000 0.000 0.000 0.000 0.000 0.000 0.000 0.031 0.000
110 0.000 0.000 0.000 0.000 0.000 0.000 0.000 0.000 0.063 0.000
111 0.000 0.000 0.000 0.000 0.000 0.000 0.000 0.000 0.000 0.045
113 0.000 0.000 0.000 0.000 0.000 0.000 0.000 0.000 0.094 0.000
115 0.042 0.000 0.100 0.000 0.000 0.000 0.800 0.000 0.000 0.000
Embra 118 0.000 0.000 0.000 0.000 0.000 0.000 0.000 0.500 0.000 0.000
14 120 0.583 0.182 0.150 0.125 0.227 0.227 0.000 0.083 0.031 0.000
125 0.250 0.500 0.600 0.583 0.500 0.682 0.000 0.000 0.000 0.000
130 0.042 0.000 0.000 0.000 0.000 0.000 0.000 0.000 0.000 0.000
132 0.042 0.227 0.050 0.292 0.227 0.091 0.100 0.083 0.063 0.000
135 0.000 0.000 0.000 0.000 0.000 0.000 0.000 0.083 0.125 0.000
137 0.000 0.091 0.100 0.000 0.045 0.000 0.000 0.000 0.000 0.000
140 0.000 0.000 0.000 0.000 0.000 0.000 0.000 0.000 0.375 0.273
142 0.000 0.000 0.000 0.000 0.000 0.000 0.000 0.000 0.000 0.318
145 0.042 0.000 0.000 0.000 0.000 0.000 0.000 0.000 0.000 0.000
148 0.000 0.000 0.000 0.000 0.000 0.000 0.000 0.000 0.000 0.182
150 0.000 0.000 0.000 0.000 0.000 0.000 0.000 0.083 0.094 0.000
155 0.000 0.000 0.000 0.000 0.000 0.000 0.000 0.000 0.000 0.045
162 0.000 0.000 0.000 0.000 0.000 0.000 0.000 0.083 0.000 0.000
170 0.000 0.000 0.000 0.000 0.000 0.000 0.100 0.083 0.063 0.091
170 0.000 0.000 0.000 0.000 0.000 0.000 0.000 0.182 0.000 0.000
182 0.042 0.000 0.333 0.000 0.000 0.000 0.000 0.000 0.000 0.000
188 0.000 0.083 0.042 0.250 0.583 0.200 0.250 0.318 0.000 0.000
190 0.000 0.000 0.000 0.000 0.000 0.000 0.000 0.000 0.067 0.000
Embra 194 0.083 0.000 0.125 0.000 0.083 0.000 0.375 0.000 0.000 0.000
210 195 0.000 0.000 0.000 0.000 0.000 0.000 0.000 0.000 0.433 0.083
204 0.000 0.000 0.000 0.000 0.000 0.150 0.000 0.000 0.000 0.000
205 0.000 0.000 0.000 0.000 0.000 0.000 0.000 0.000 0.067 0.333
210 0.000 0.000 0.000 0.000 0.000 0.000 0.000 0.000 0.000 0.125
215 0.000 0.000 0.000 0.000 0.000 0.000 0.000 0.000 0.233 0.292
220 0.250 0.458 0.167 0.375 0.042 0.150 0.125 0.455 0.167 0.167
225 0.000 0.000 0.000 0.000 0.000 0.000 0.000 0.000 0.033 0.000
230 0.625 0.458 0.333 0.333 0.208 0.450 0.250 0.045 0.000 0.000
243 0.000 0.000 0.000 0.042 0.083 0.050 0.000 0.000 0.000 0.000
165 0.167 0.333 0.333 0.125 0.500 0.500 0.500 0.364 0.000 0.000
Embra 168 0.000 0.083 0.000 0.333 0.000 0.000 0.000 0.136 0.000 0.000
63 170 0.000 0.000 0.000 0.000 0.000 0.000 0.000 0.000 0.094 0.125
175 0.833 0.583 0.667 0.542 0.500 0.500 0.500 0.500 0.906 0.875
290 0.000 0.000 0.000 0.000 0.000 0.000 0.000 0.000 0.000 0.056
296 0.773 0.500 0.438 0.750 0.800 0.875 0.500 0.727 0.000 0.000
298 0.045 0.000 0.188 0.125 0.000 0.000 0.000 0.000 0.000 0.000
300 0.182 0.500 0.375 0.125 0.200 0.125 0.500 0.273 0.000 0.000
Embra 305 0.000 0.000 0.000 0.000 0.000 0.000 0.000 0.000 0.033 0.000
122 310 0.000 0.000 0.000 0.000 0.000 0.000 0.000 0.000 0.233 0.222
315 0.000 0.000 0.000 0.000 0.000 0.000 0.000 0.000 0.000 0.056
320 0.000 0.000 0.000 0.000 0.000 0.000 0.000 0.000 0.200 0.278
327 0.000 0.000 0.000 0.000 0.000 0.000 0.000 0.000 0.133 0.333
330 0.000 0.000 0.000 0.000 0.000 0.000 0.000 0.000 0.067 0.056
340 0.000 0.000 0.000 0.000 0.000 0.000 0.000 0.000 0.300 0.000
Figure 1 shows many exclusive alleles in certain populations, with the presence of 15 exclusive alleles in population 9, 11 in population 10, three in population 8, two in population 2 and one in population 6. Although the populations shared most of the 73 alleles there were an ex-pressive number of alleles that characterized certain popu-lations specifically (such as in the case of popupopu-lations 9 and 10).
Genetic structure
Table 4 shows the intrapopulation fixation index (f = FIS) estimated for each population from the heterozygosity indeces (Hoand He). The mean value was f = -0.037 with a range of -0.316 to 0.197. From the analysis of variance the average f = -0.017 was obtained (IC 95%: -0.276 to 0.134; Table 6). These results, together with Fisher’s exact test, indicated that the populations have a rate of cross-pollination compatible with allogamy.
The estimated RST and FST values were 0.269 and 0.250, respectively. These estimates are similar and both significantly different from zero, as can be observed in Ta-ble 6. The Nm parameter estimate, calculated from the RST estimate, was 0.680 individuals per generation, indicating an intermediate migration rate among the populations. Considering the FST= 0.250 estimate, Nm = 0.750 individu-als were obtained per generation.
Nei’s genetic distances calculated pairwise between the populations varied from 0.046 to 0.407. These led to the dendrogram presented in Figure 3. The cophenetic correla-tion of the UPGMA clustering of this matrix was high (0.943). Populations 9 and 10 were shown to be very simi-lar and formed a genetically divergent group. They are lo-cated in the extreme west of the sampled region. Populations 1 to 8 formed another group and are located in the eastern part of the studied region. It is important to point out that these populations are separated by the Corumbá river depression, forming two spatially discontinuous groups. This structure was visualized by the dendrogram, Table 3 (Cont.)
Locus Allele Pop1 Pop2 Pop3 Pop4 Pop5 Pop6 Pop7 Pop8 Pop9 Pop10
153 0.000 0.000 0.000 0.000 0.000 0.000 0.000 0.000 0.125 0.125
Embra 155 0.000 0.000 0.000 0.000 0.000 0.000 0.000 0.000 0.281 0.375
73 158 1.000 1.000 1.000 1.000 1.000 1.000 1.000 1.000 0.594 0.500
110 0.042 0.292 0.000 0.125 0.208 0.333 0.000 0.045 0.300 0.042
120 0.000 0.000 0.125 0.208 0.458 0.167 0.300 0.409 0.300 0.292
Embra 123 0.958 0.708 0.875 0.667 0.333 0.500 0.700 0.000 0.133 0.250
172 130 0.000 0.000 0.000 0.000 0.000 0.000 0.000 0.545 0.233 0.417
132 0.000 0.000 0.000 0.000 0.000 0.000 0.000 0.000 0.033 0.000
100 1.000 1.000 1.000 1.000 1.000 1.000 1.000 1.000 0.000 0.000
107 0.000 0.000 0.000 0.000 0.000 0.000 0.000 0.000 0.063 0.000
119 0.000 0.000 0.000 0.000 0.000 0.000 0.000 0.000 0.031 0.000
120 0.000 0.000 0.000 0.000 0.000 0.000 0.000 0.000 0.031 0.000
130 0.000 0.000 0.000 0.000 0.000 0.000 0.000 0.000 0.031 0.000
Embra 143 0.000 0.000 0.000 0.000 0.000 0.000 0.000 0.000 0.063 0.000
72 160 0.000 0.000 0.000 0.000 0.000 0.000 0.000 0.000 0.344 0.227
169 0.000 0.000 0.000 0.000 0.000 0.000 0.000 0.000 0.344 0.273
180 0.000 0.000 0.000 0.000 0.000 0.000 0.000 0.000 0.031 0.045
182 0.000 0.000 0.000 0.000 0.000 0.000 0.000 0.000 0.063 0.182
190 0.000 0.000 0.000 0.000 0.000 0.000 0.000 0.000 0.000 0.091
195 0.000 0.000 0.000 0.000 0.000 0.000 0.000 0.000 0.000 0.136
210 0.000 0.000 0.000 0.000 0.000 0.000 0.000 0.000 0.000 0.045
Table 4- Estimates of genetic parameters in ten Eugenia dysenterica
populations N: number of individuals sampled, L: number of microsatellite loci; A: mean number of alleles; Ho: Observed heterozygosity; Heexpected heterozygosity; f: fixation index; ta: apparent crossing rate.
Pop. N L A Ho He f ta
1 12 7 2,714 0,253 0,276 0,088 0,838
2 12 7 2,286 0,449 0,403 -0,123 1,280
3 12 7 2,714 0,366 0,394 0,076 0,859
4 12 7 2,572 0,453 0,408 -0,117 1,265
5 12 7 2,572 0,497 0,404 -0,245 1,649
6 12 7 2,428 0,411 0,374 -0,106 1,237
7 5 7 2,143 0,450 0,389 -0,183 1,448
8 11 7 3,000 0,563 0,438 -0,316 1,924
9 16 7 6,000 0,541 0,670 0,197 0,671
10 12 7 4,857 0,599 0,667 0,105 0,810
where populations 9 and 10 diverged genetically from the other populations. This population structure is congruent with the results obtained by Telles et al. (2001) using isoenzymes, with progeny data of the same populations.
The matrix correlation between Nei’s genetic dis-tances and the respective geographic disdis-tances was high
and positive (r = 0.872) and significant at 1% level of probability (Figure 3). This result indicates that the genetic variability pattern among the populations is structured in space. A similar result but with a lower correlation (r = 0,725) was reported by Telleset al., 2001, with isoenzyme markers.
Discussion
Knowledge of the genetic variability distribution be-tween and within naturalEugenia dysentericapopulations is essential to adopt efficient strategies forex situandin situ
germplasm conservation.
SSR markers are a powerful tool for this type of study. However, the progress of using markers based on microsatellites has been hindered because of the high cost and time spent for developing species specific primers. The chance of success of heterologous amplification for any DNA sequence by PCR is inversely related to the evolu-tionary distance between two species. Many studies have shown, however, that there is the possibility of using pairs of primers designed for one species or another species of the same genus (Ciprianiet al., 1999) or even of different genera (Roa et al., 2000). The transferability of micro-satellites among related species is a consequence of the homology of the DNA sequence in the regions that flank the microsatellites. Other studies on tropical trees have demonstrated a high ratio of SSR loci transferability among taxonomically related tree species, as occurs with Table 5- Probabilities of goodness-of-fit test (Fisher’s exact test) to Hardy-Weinberg equilibrium for each locus.
Locus Pop1 Pop2 Pop3 Pop 4 Pop 5 Pop 6 Pop 7 Pop 8 Pop 9 Pop 10
EMBRA 14 0,012 0.084 0.182 0.779 0.657 0.034 0.113 0.408 0.001 0.022
EMBRA 210 0.578 0.001 0.000 0.164 0.436 0.080 0.647 0.637 0.739 0.001
EMBRA 63 1.000 0.136 0.214 0.027 0.0025 0.001 0.121 0.008 1.000 1.000
EMBRA 122 0.427 1.000 0.406 0.139 1.000 1.000 0.128 0.501 0.000 0.011
EMBRA 73 0.000 0.000 0.000 0.000 0.000 0.000 0.000 0.000 0.414 0.004
EMBRA 172 1.000 1.000 1.000 0.395 0.002 0.842 0.331 0.097 0.000 0.007
EMBRA 72 0.000 0.000 0.000 0.000 0.000 0.000 0.000 0.000 0.000 0.022
Table 6- Wright’s F statistic’s, RSTand the number of migrants per generation (Nm) for ten natural Eugenia dysenterica populations. Confidence interval of 95% probability based on 10,000 bootstraps.
FIS FIT FST RST NmA NmB
Under all the loci -0,017 0,238 0,250 0,269 0,680 0,750
Upper (IC 95%) 0,134 0,388 0,348 0,359 0.766 —
Lower (IC 95%) -0,276 0,025 0,194 0,245 0,442 —
NmA: based in RST. NmB: based in FST.
Figure 1- Number of private/exclusive alleles for 73 alleles obtained in seven polymorphic loci of the SSR markers, in tenEugenia dysenterica
populations.
Figure 2- Genetic divergence pattern among ten “cagaita tree” popula-tions, defined by the UPGMA clustering, based on the genetic identity ob-tained from Nei’s genetic distances (1972). Cophenetic correlations equal to 0.943.
Leguminosae (Dayanandanet al., 1997), Meliaceae (White and Powell, 1997) and among Eucalyptus species (Brondaniet al., 1998). In this study, only 10 primer pairs of 356 developed forEucalyptus spp. were found to be transferable the two species (Zucchi,et al.2002).
Roa et al. (2000) studied transferability in cassava (Manihot esculenta) for six different species (all wild) of theManihotgenus. Only two in eight of the amplified loci (or two pairs of primers) did not amplify for the two more distant wild cassava species. It has been found that many microsatellite primers can be used to amplify heterology among different genera. These authors showed the possibil-ity of using SSR primers to amplify heterology in different species and genera (Byrneet al., 1996; Katziret al., 1996; Isagi and Suhhandono, 1997; Smulder et al., 1997; Steilnkellneret al., 1997).
Dayanandanet al. (1997) used pairs of primers devel-oped for a tropical tree, Pithcellobium elegans, to detect SSR loci that amplified for other species in the same family (Leguminosae). Thirteen species from the Leguminosae family, 12 from the Mimosidae subfamily and one from the Pappilionoidae family, were used. The six pairs of primers developed forP. eleganswere successful in amplifying for species of the same genus and of different genera.
Regarding genetic variation, a relatively high level of multiallelism in all the seven polymorphic loci was ob-served in the present study. The average number of alleles per locus was 10.4 and the mean expected heterozygosity reached 0.442 which is greater than the value found in a similar study with the same “cagaita tree” populations us-ing isoenzyme markers.
The FISvalue found here for theEugenia dysenterica populations was negligible. This value suggests that the species is predominantilly allogamic. This result contrasted FIS = -0.017 value obtained by SSR markers with the FIS= 0.243 value obtained by Telles (2000) with isozymes from seedlings of the same population. The conflicting re-sults may be due to the use of data at different stages of de-velopment, seedling or adults plants could show different isozymes patterns or even because of differences in the na-ture of the genetic marker used. Enzymes may be related to adaptive traits and subject to natural selection, while microsatellites are non coding regions of the genome and, therefore, are selectively neutral.
Proença & Gibbs (1994) studied the reproductive bi-ology ofE. dysentericaand concluded that it is pollinated by large bees. The flowers open in the morning for one day and following the pattern called “big bang”, the plants flower intensely for a relatively short period. Mainly mon-keys and humans disperse the seeds, although some other animals also perform this function (Ferreira & Cunha, 1980).
The apparent cross-fertilization rate here estimated was high ($t = 1,08) and greater than that found with isozyme markers ($t = 0.83) and seedling data. Pollinators or
dispersing agents may also be responsible for this differ-ence.
For example, the trees analyzed with SSR markers are probably plants that had been part of the natural Cerrado and were, in most cases, 50 old years or more. On the other hand seedlings (progenies genotyped with isoenzymes) are recent plants from recent pollination events performed by insect populations that probably are different from the in-sect population of 50 years ago.
Govindajaru (1989) distinguished three levels of gene flow: high Nm > 1, intermediate (0.25 < Nm < 0.99) and low Nm < 0.25. The value found here (Nm = 0,68) was therefore intermediate. As this flow was estimated on the basis of the RSTparameter it cannot not be considered con-temporaneous, but a consequence of the genetic history of these populations. The restricted gene flow can be also ex-plained by main pollinater, the large bees, and the flower-ing manner of the “cagaita tree”, that happens fast and abundantly, that does not allow a great number of flights of the pollinater to supply itself with pollen, and is thus re-stricted to small distances.
Regarding the measure of diversity among popula-tions, it was noted that the RSTand FSTestimates were very similar. It is believed that more results of this nature would be necessary to ascertain the tendencies in the difference between RSTand FST. These values were higher than those obtained with isozyme markers for the same populations suggesting that microsatellites are more sensitive than isozymes for measuring differentiation among populations than isozymes. This was also evident from the detection of private or exclusive alleles in this study that were not de-tected in the data reported by Telles (2001).
Although this is a species with a high degree of allogamy, the estimated gene flow among the populations was relatively small and possibly a consequence of human settlement of the Cerrado. An interesting fact to discuss is the high frequency of exclusive alleles in populations 9 and 10 that may have been caused by genetic drift and absence of gene flow. In fact, population 9 is located in an urban re-gion (Table 1) and population 10, although natural, is com-pletely isolated from the others.
Of the localities studied except areas 1, 8 and part of area 7, the others were present in areas with bigger alter-ation in consequence of human settlement of the Cerrado, either for locating inside the urban area of Goiânia (area 9), or for locating in implanted pastures. Some areas have been fertilized when these grasses were planted, as for example area 2, 4 and 10, that presented higher calcium (Ca), mag-nesium (Mg) and phosphorus (K) values in comparison with natural areas (Silva, 1999).
pro-duce a relatively high amount of genetic divergence among the local population (Loveless and Hamrick 1984; Proença and Gibbs, 1994). Due to recent expansion of agricultural activities in the Cerrado and high rates of biodiversity loss and endemic species, the region is considered one of the world’s hotspots for conservation (Myerset al.2002). The region is highly fragmented by increased agricultural activ-ities, and there is no clear information about the spatial dis-tribution ofEugenia dysentericatrees before recent human occupation (Diniz-Filho and Telles, 2002).
Another hypothesis to be considered regarding the high rate of exclusive alleles in population 9 is that its ge-netic constitution could have been altered by human intro-ductions. Slatkin (1985) described a methodology to assess gene flow from rare (or private/exclusive) alleles. The dis-tribution of the frequencies of these rare alleles (alleles that appear in a single population) is used to estimate the mean number of migrants exchanged among local populations. The logarithm of Nm is approximately linearly related to the logarithm of the mean of the frequency of the pri-vate/exclusive alleles (Slatkin, 1985; Slatkin and Barton, 1986).
The high correlation coefficient between the genetic and geographic distance matrices suggested that there is a spatial pattern of genetic variability among the populations. This structure probably originated from a stocastic differ-entiation process, with higher levels of gene flow among closer populations and decreased flow as distances in-creased (isolation by distance).
Results indicated a potential of SSR locus transfer-ability developed forEucalyptusto other species of differ-ent genera, such as in the case of the “cagaita tree”. The high genetic diversity among populations detected with SSR markers indicated that these markers are highly sensi-tive to detect population structure. Results of the present study were not entirely congruent with those obtained with isozyme markers especially with respect to gene flow and diversity. However estimated Nm being less than 1.0 and the existence of private alleles call attention to damages of the metapopulation structure that may have occurred in these populations.
References
Almeida SP (1998) Frutas nativas do cerrado:caracterização fí-sico-química e fonte potencial de nutrientes. In: Embrapa-CPAC (ed) Cerrado: ambiente e flora. Plantaltina, pp 556. Brondani RPV, Brondani C, Tarchini R and Grattapaglia D (1998)
Development, characterization and mapping of micro-satellite markers inEucalyptus grandisand E. urophylla. Theor Appl Genet 97:816-827.
Byrne M, Marquez-Garcia MI, Uren T, Smith DS and Moran GF (1996) Conservation and genetic diversity of microsatellite loci, in the genusEucalipytus. Aust J Bot 44:331-341. Cipriani G, Lot G, Huang WG, Marrazzo MT, Peterlunger E and
Testolin R (1999) AC/GT and AG/CT microsatellite repeats in peach [Prunus persica(L) Batsch]: isolation,
character-ization and cross-species amplification in Prunus. Theor Appl Genet 99:65-72.
Collevatti RG, Brondani RPV and Grattapaglia D (1999) Devel-opment and characterization of microsatellite markers for genetic analysis of a Brazilian endangered tree species of Caryocar brasiliense.Heredity 83:748-756.
Daynandan S, Bawa KS and Kesseli R (1997) Conservation of microsatellites among tropical tree (Leguminosae). Am J Bot 84:1658-1663.
Diniz-Filho JAF and Telles MCP (2002) Spatial Autocorrelation analysis and the identification of operational units for con-servation in continuous populations, Concon-servation Biology 16:924-935.
Ferreira MB and Cunha LHS (1980) Dispersão de plantas le-nhosas de cerrado: germinação e desenvolvimento. Informe Agropecuário 16:12-17.
Gilpin ME and Soulé ME (1986) Minimum viable populations: process of species extinction. In: Soulé, ME (ed) Conserva-tion Biology, the Science of Scarcity and Diversity, Sinuer Associates, Sunderland, pp 19-34.
Goodman SJ (1997) RSTCalc: a collection of computer program for calculating estimates of genetic differentiation from microsatellite and determining their significance. Mol Ecol 6:881-885.
Govindajuru RD (1989) Variation in gene flow levels among pre-dominantly self-pollinated plants. J Evol Biol 2:173-181. Heringer EP and Ferreira MB (1974) Informações preliminares
acerca da floração precose de vinte espécies arbóreas do Cerrado do Planalto Central. 25 Congresso Nacional de Botânica, Mossoró, Brasil.
Isagi Y and Suhandono S (1997) PCR primers amplifying micro-satellite loci ofQuercus mysinifoliaBlume and their conser-vation between oak species. Mol Ecol 6:897-899.
Katzir N, Danin-Poleg Y, Tzuki G, Karchi Z, Lavi V and Cregan PB (1996). Lenght polymorphism and homology of micro-satellites in several Curcubitaceae species. Theor Appl Genet 93:1282-1290.
Lewis PO and Zaykin D (2000) Genetic Data Analysis: Computer program for the analysis of allelic data. Version 1.0 (d15) Free program distributed by authors over the Internet from the GDA Home Page at http://alleyn.eeb.uconn.edu/gda/ 2000.
Mantel N (1967) The detection of disease clustering and a gener-alized regression approach. Cancer Resear 27:209-220. Miller M (1997) Tools For Population Genetic Analyses
(TFPGA) 1.3: A windows program for analyses of allozyme and molecular population genetic data.
Myers N, Mittermeier RA, Mittermeier CG, Fonseca GAB and Kent J (2000) Biodiversity hotspot for conservation priori-ties. Nature 403:853-858.
Nei M (1972) Genetics distance between populations. Am Natu-ralist 106:283-292.
Proença CEB and Gibbs PE (1994) Reproductive biology of eight sympatric Myrtaceae from Central Brazil. New Phytologist 126:342-354.
Rolf FJ (1989) NTSYS-Pc: Numerical Taxonomy and Multi-variate Analysis System. Exeter publisher, New York.
Silva RSM (1999) Caracterização de sub-populações de cagaita (Eugenia dysentericaDC.) da região sudeste do estado de Goiás. Dissertação, Escola de Agronomia, Universidade Fe-deral de Goiás, Goiânia.
Slatkin M (1985) Gene flow in natural population. Ann Rev Ecol Syst 16:393-430.
Slatkin M (1995) A measure of population subdivision based on microsatellite allele frequencies. Genetics 139:457-462.
Slatkin M and Barton NH (1986) A comparison of three indirect methods for estimating average levels of gene flow. Evolu-tion 43:1349-1368.
Smulder MJM, Bredemeijer G, Rus-Kortekass W, Arens P and Vosman B (1997) Used of short microsatellite from base se-quence to generate polymorphism among Lycopersicum esculentumcultivars and accession of otherLycopersicum species. Theor Appl Genet 97:264-272.
Steinkellner H, Lexer C, Tutresschek E, Glossil J (1997) Conser-vation of (GA)n microsatellite loci betweenQuercus spe-cies. Mol Ecol 6:1189-1194.
Telles M. Diversidade genética e estrutura genética populacional de cagaiteira (Eugenia dysenteriaDC.) do sudeste de Goiás. Dissertação, Escola de Agronomia, Universidade Federal de Goiás, Goiânia.
Telles MPC, Diniz-Filho JAF, Coelho ASG and Chaves LJ (2001) Autocorrelação espacial das frequências alélicas em subpopulações de cagaiteira (Eugenia dysenterica DC, Mytaceae) no Sudeste de Goiás. Rev Bras Bot 24:145-154. Weir BS (1996) Genetics data analysis II – Methods for discrete
population genetic data. Suderland MA, Sinauer Associates, Inc. Publishers.
White G and Powell W (1997) Cross-species amplification of SSR loci in the Meliaceae family. Mol Ecol 6:1195-1197. Wright JM and Bentzen P (1994) Microsatellites: genetic markers
of the future. Rev Fish Biol Fisher 4:384-388.
Young A, Boyle T and Brown T (1996) The population genetic consequences of habitat fragmentation for plants. Trends Ecol Evol 11:413-418.
Zucchi MI, Brondani RV, Pinheiro JB, Brondani C and Vencovsky R (2002) Transferability of microsatellite mark-ers from Eucalyptus spp. to Eugenia dysenterica (Myrtaceae family). Mol Ecol Notes 2:512–514.