SSR and AFLP based genetic diversity of soybean germplasm differing
in photoperiod sensitivity
Ram K. Singh
1,3*, Virendra S. Bhatia
1, K.V. Bhat
2, Trilochan Mohapatra
3, Nagendra K. Singh
3,
Kailash C. Bansal
3and K.R. Koundal
31
National Research Centre for Soybean, Indore, India.
2
National Research Centre for DNA Fingerprinting, National Bureau of Plant Genetic Resources,
Pusa Campus, New Delhi, India.
3
National Research Centre on Plant Biotechnology, Indian Agricultural Research Institute, Pusa Campus,
New Delhi, India.
Abstract
Forty-four soybean genotypes with different photoperiod response were selected after screening of 1000 soybean accessions under artificial condition and were profiled using 40 SSR and 5 AFLP primer pairs. The average polymor-phism information content (PIC) for SSR and AFLP marker systems was 0.507 and 0.120, respectively. Clustering of genotypes was done using UPGMA method for SSR and AFLP and correlation was 0.337 and 0.504, respectively. Mantel’s correlation coefficients between Jaccard’s similarity coefficient and the cophenetic values were fairly high in both the marker systems (SSR = 0.924; AFLP = 0.958) indicating very good fit for the clustering pattern. UPGMA based cluster analysis classified soybean genotypes into four major groups with fairly moderate bootstrap support. These major clusters corresponded with the photoperiod response and place of origin. The results indicate that the photoperiod insensitive genotypes, 11/2/1939 (EC 325097) and MACS 330 would be better choice for broadening the genetic base of soybean for this trait.
Key words:photoperiod response, SSR, AFLP, genetic diversity, soybean.
Received: April 28, 2009; Accepted: December 1, 2009.
The photoperiod response is a major criterion, which determines the latitudinal adaptation of a soybean variety (Hartwig and Kiihl, 1979). A considerable variation in the relative sensitivity of soybean genotypes to differences in photoperiod has been reported (Sinclair and Hinson, 1992). Robertset al.(1996) had also emphasized the importance of photoperiod-insensitivity in the improvement of soybean crop after characterizing soybean genotypes in conjunction with an analysis of the world-wide range of photo-thermal environments in which soybean crops are grown. Most of the Indian soybean cultivars (> 95%) were found to be highly sensitive to photoperiod that limits their cultivation in only localized area (Bhatiaet al., 2003). Thus, it is im-portant to identify genetically diverse source of photo-period-insensitivity gene(s) to broaden the genetic base of Indian soybean cultivars.
Better knowledge of the genetic similarity of breed-ing materials could help to maintain genetic diversity and
sustain long-term selection gains. Furthermore, monitoring the genetic variability within the gene pool of elite breeding material could make crop improvement more efficient by the directed accumulation of favored alleles thus decreas-ing the amount of material to be screened. Several studies have used molecular markers to help in identification of ge-netically diverse genotypes to use in crosses in cultivar im-provement programme. These studies have more success than conventional selection programme in producing pro-ductive lines from plant introduction/exotic lines crosses with elite lines (Maughanet al., 1996; Thompson and Nel-son, 1998). Among the molecular markers simple sequence repeats (SSR) are reproducible, co-dominant and distrib-uted through out the genome. The AFLPs being dominant markers allow studying many loci simultaneously and gen-erating highly reproducible markers that are also consid-ered to be locus specific within a species (Maughanet al., 1996). These two markers can detect higher levels of ge-netic diversity in soybean and have been utilized for many purposes including genome mapping, gene tagging, estima-tion of genetic diversity and varietal identificaestima-tion (Maughanet al., 1995, 1996; Powellet al., 1996; Creganet al., 1999; Brown-Guediraet al., 2000; Narvelet al., 2000;
www.sbg.org.br
Send correspondence to Ram K. Singh. Division of Crop Improve-ment, Indian Institute of Sugarcane Research, Rai Bareli Road, Lucknow-226002 U.P., India. E-mail: [email protected].
*
Present address: Division of Crop Improvement, Indian Institute of Sugarcane Research, Lucknow-226002 India.
Udeet al., 2003; Wangeet al., 2006; Singhet al., 2008). However, no information is available on assessment of ge-netic diversity in response to photoperiodism in soybean. The present study was conducted to identify genetic diver-sity in the soybean gene pool for photoperiod insensitivity using SSR and AFLP markers.
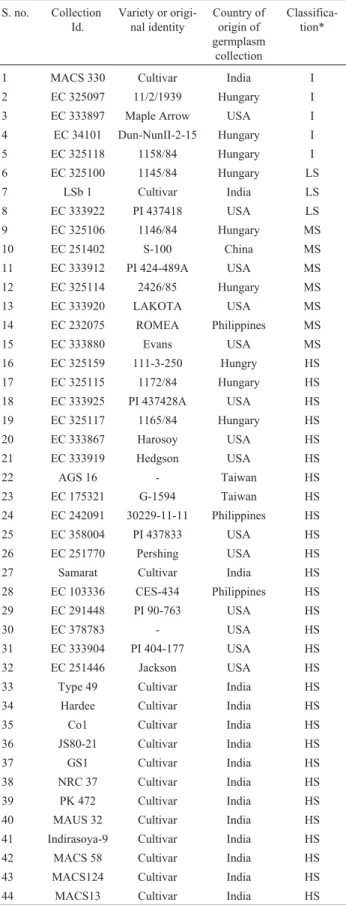
One thousand soybean genotypes obtained from In-dia, USA, Hungary, Philippines and Taiwan were screened for sensitivity to photoperiodism as described by Singhet al.(2008). Out of these 44 genotypes, 15 genotypes show-ing different degree of photoperiod insensitivity and 29 sensitive genotypes were selected for analysis using SSR and AFLP markers. The place of origin, EC number and their response to photoperiodism are given in Table 1. Ten leaves, one each from ten plants of 44 soybean genotypes were collected and DNA was isolated by the method de-scribed by Doyle and Doyle (1990).
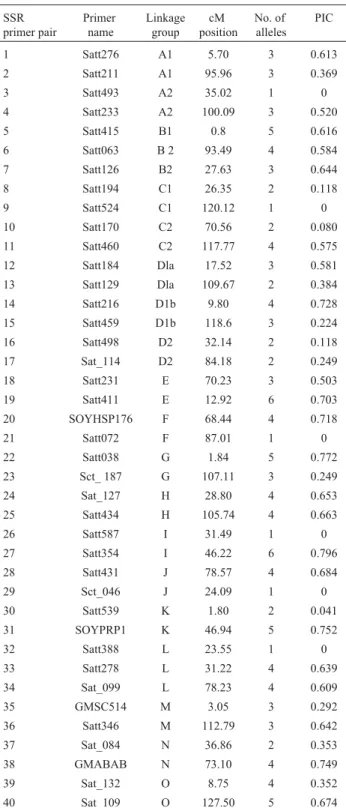
Simple sequence repeat (SSR)/ microsatellite analy-sis was carried out using 40 mapped markers distributed on all the 20 chromosomes (Cregan et al., 1999) (Table 2). Amplification was carried out in a 10mL reaction mixture consisting of 1X PCR assay buffer (Bangalore Genei Pvt. Ltd., India), 200mM of the four dNTPs (MBI Fermentas, Lithuania, USA), 12 ng (1.8 picomole) each of forward and reverse primers (Life Technologies, USA), 0.5 units of Taq DNA polymerase (Bangalore Genei Pvt. Ltd., India) and 25 ng template DNA. PCR reactions were carried out in a thermal cycler (Gene Amp 9600 model, version 2.01 from Perkin Elmer, USA) using the following cycling parame-ters: initial denaturation at 94 °C for 5 min, followed by 35 cycles of 94 °C for 1 min, 55 °C for 1 min, 72 °C for 2 min and finally a primer extension cycle of 7 min at 72 °C. The amplification products were separated on 3% metaphor agarose gels containing 1.5% gel star (FMC Bio Products, Rockland, USA). Gels were run for 3 h at 50 V in 1X TBE buffer. DNA fragments were visualized under UV light and photographed using a Polaroid photographic system. The size of the fragments was estimated using a 50-bp DNA ladder (MBI Fermentas, Lithuania).
AFLP fingerprints were generated based on the proto-col of Zabeau and Vos (1993) with the AFLP Analysis Sys-tem II (Invitrogen Corporation, Grand Island, NY) following the manufacturer’s instructions. The size of the fragments was estimated using a 20-bp DNA ladder (MBI Fermentas, Lithuania).
The scoring of bands was done as present (1) or ab-sent (0) for each AFLP and SSR marker allele and data was entered in a binary data matrix as discrete variables. Jaccard’s coefficient of similarity was calculated and a dendrogram was constructed by using Unweighted Pair Group Method of Arithmetic Mean (UPGMA). The com-puter package NTSYS-PC Version 2.02 (Rohlf, 1998) was used for cluster analysis. The same software was used to perform the Mantel test of correlation between the cophe-netic values and the Jaccard similarity coefficients to
ascer-Table 1- Genotypes and cultivars, country of origin and classification
re-garding sensitivity to photoperiodism of the 44 soybean genotypes/cul-tivars used in this study.
S. no. Collection Id.
Variety or origi-nal identity
Country of origin of germplasm
collection
Classifica-tion*
1 MACS 330 Cultivar India I
2 EC 325097 11/2/1939 Hungary I
3 EC 333897 Maple Arrow USA I
4 EC 34101 Dun-NunII-2-15 Hungary I
5 EC 325118 1158/84 Hungary I
6 EC 325100 1145/84 Hungary LS
7 LSb 1 Cultivar India LS
8 EC 333922 PI 437418 USA LS
9 EC 325106 1146/84 Hungary MS
10 EC 251402 S-100 China MS
11 EC 333912 PI 424-489A USA MS
12 EC 325114 2426/85 Hungary MS
13 EC 333920 LAKOTA USA MS
14 EC 232075 ROMEA Philippines MS
15 EC 333880 Evans USA MS
16 EC 325159 111-3-250 Hungry HS
17 EC 325115 1172/84 Hungary HS
18 EC 333925 PI 437428A USA HS
19 EC 325117 1165/84 Hungary HS
20 EC 333867 Harosoy USA HS
21 EC 333919 Hedgson USA HS
22 AGS 16 - Taiwan HS
23 EC 175321 G-1594 Taiwan HS
24 EC 242091 30229-11-11 Philippines HS
25 EC 358004 PI 437833 USA HS
26 EC 251770 Pershing USA HS
27 Samarat Cultivar India HS
28 EC 103336 CES-434 Philippines HS
29 EC 291448 PI 90-763 USA HS
30 EC 378783 - USA HS
31 EC 333904 PI 404-177 USA HS
32 EC 251446 Jackson USA HS
33 Type 49 Cultivar India HS
34 Hardee Cultivar India HS
35 Co1 Cultivar India HS
36 JS80-21 Cultivar India HS
37 GS1 Cultivar India HS
38 NRC 37 Cultivar India HS
39 PK 472 Cultivar India HS
40 MAUS 32 Cultivar India HS
41 Indirasoya-9 Cultivar India HS
42 MACS 58 Cultivar India HS
43 MACS124 Cultivar India HS
44 MACS13 Cultivar India HS
tain reliability of the obtained clusters. Robustness of the clustering pattern was also tested using bootstrap analysis using Free Tree - Free ware software (Pavliceket al., 1999). The polymorphism information content (PIC) was calcu-lated for SSR marker as 1 -Spij2wherepijis the frequency
of the jthallele ofithmarker (Weir, 1990) while PIC for
AFLP marker was calculated as described by Powellet al.
(1996).
Among the 40 SSR primer pairs used in the present study, 34 (85.0%) were polymorphic, while six primers re-vealed monomorphic patterns. In total, 120 alleles were de-tected for the 34 polymorphic SSR primers, with an average of 3.53 alleles per locus. Allele sizes ranged from 90 bp to 300 bp. Summarized data for the SSR loci and their PIC values are presented in Table 2. The PIC value, a reflection of allelic diversity and frequency among the soybean geno-types analyzed were generally high for all the SSR loci tested. PIC values ranged from 0.041 to 0.796, with an av-erage of 0.507. Seven SSR loci revealed PIC values higher than 0.70. Among these, Satt354 and Satt038 are notewor-thy due to their relatively high polymorphism (six and five alleles each, respectively), and high PIC values (0.796 and 0.772), respectively. The polymorphism of SSR loci de-tected in this study was consistent with data obtained in some previous studies (Doldiet al., 1997; Brown-Guedira
et al., 2000; Narvelet al., 2000), but was lower than that re-ported by others (Rongwenet al., 1995; Diwan and Cregan, 1997). The PIC values of our study were in agreement with the data of Doldiet al.(1997) and Brown-Guedira et al.
(2000), who detected mean gene diversity values of 0.50 and 0.69 in a group of 39 and 36 elite/commercial soybean cultivars, respectively.
The five AFLP primer combinations used in this study were selected on the basis of a high number of scorable polymorphic bands. It was possible to discrimi-nate each one of the 44 soybean genotypes using five primer combinations. Band sizes ranged from 100 to 700 bp. The five primer pairs revealed a total of 449 differ-ent bands that were of sufficidiffer-ent intensity to be scored, and 208 (46.3%) of these were polymorphic. The percentage of polymorphic bands per assay unit ranged from 34.0% (E-ACT/M-CAT) to 57% (E-AAG/M-CTT), with an average of 46.3%. The average PIC score for AFLP primer combi-nation was 0.12, with a range of 0.08 to 0.16 (Table 3). A similar average PIC score for AFLP was also reported in an earlier study on soybean (Udeet al., 2003). 91 polymorphic bands showed PIC scores > 0.30 indicating that only 20.3% of the 449 bands contributed significantly to the genetic variation of the soybean genotypes. A PIC score > 0.30 has been described previously in soybean based on RFLP (Keimet al., 1992; Lorenzenet al., 1995), RAPD (Thomp-son and Nel(Thomp-son, 1998) and AFLP (Udeet al., 2003) results and shows its usefulness in other soybean germplasm di-versity studies. Thus, the polymorphism seen by SSR and AFLP efficiently distinguished all these accessions of soy-bean genotypes.
The similarity coefficients based on shared SSR and AFLP bands revealed that the average genetic similarity (GS) between genotypes was 0.446, with a range of 0.220 to 0.765. GS estimates for AFLP and SSR were 0.504 and 0.337, respectively. As expected, the level of
polymor-Table 2- SSR loci, linkage group with position, allele number and
poly-morphism information content (PIC) for 44 soybean genotypes/cultivars.
SSR primer pair
Primer name
Linkage group
cM position
No. of alleles
PIC
1 Satt276 A1 5.70 3 0.613
2 Satt211 A1 95.96 3 0.369
3 Satt493 A2 35.02 1 0
4 Satt233 A2 100.09 3 0.520
5 Satt415 B1 0.8 5 0.616
6 Satt063 B 2 93.49 4 0.584
7 Satt126 B2 27.63 3 0.644
8 Satt194 C1 26.35 2 0.118
9 Satt524 C1 120.12 1 0
10 Satt170 C2 70.56 2 0.080
11 Satt460 C2 117.77 4 0.575
12 Satt184 Dla 17.52 3 0.581
13 Satt129 Dla 109.67 2 0.384
14 Satt216 D1b 9.80 4 0.728
15 Satt459 D1b 118.6 3 0.224
16 Satt498 D2 32.14 2 0.118
17 Sat_114 D2 84.18 2 0.249
18 Satt231 E 70.23 3 0.503
19 Satt411 E 12.92 6 0.703
20 SOYHSP176 F 68.44 4 0.718
21 Satt072 F 87.01 1 0
22 Satt038 G 1.84 5 0.772
23 Sct_ 187 G 107.11 3 0.249
24 Sat_127 H 28.80 4 0.653
25 Satt434 H 105.74 4 0.663
26 Satt587 I 31.49 1 0
27 Satt354 I 46.22 6 0.796
28 Satt431 J 78.57 4 0.684
29 Sct_046 J 24.09 1 0
30 Satt539 K 1.80 2 0.041
31 SOYPRP1 K 46.94 5 0.752
32 Satt388 L 23.55 1 0
33 Satt278 L 31.22 4 0.639
34 Sat_099 L 78.23 4 0.609
35 GMSC514 M 3.05 3 0.292
36 Satt346 M 112.79 3 0.642
37 Sat_084 N 36.86 2 0.353
38 GMABAB N 73.10 4 0.749
39 Sat_132 O 8.75 4 0.352
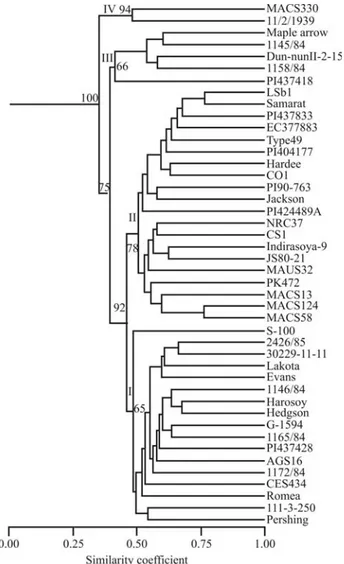
phism was higher for SSR (0.507) than for AFLP (0.12), reflecting the hypervariability of SSR markers. SSR/micro-satellite analysis thus revealed significantly lower mean ge-netic similarity values (0.337) than AFLP (0.504). Similar results have been reported for soybean (Powellet al., 1996) and olive (Bandeljet al., 2003). Dendrograms were con-structed from genetic similarity data, and clusters were tested for associations. Cophenetic coefficients were fairly high in both molecular systems (SSR = 0.924 and AFLP = 0.958) indicating a good fit for clustering. The Mantel correlation test was used to compare between SSR and AFLP, as well as the combined data. The cophenetic matrix values and the estimated correlations for the two molecular systems and with combination were r = 0.604 (SSRvs.AFLP), r = 0.771 (SSRvs.combination) and 0.971 (AFLPvs.combination), respectively. All these were sta-tistically significant. The slightly lower level of correlation between SSR and AFLP in the present study could proba-bly reflect that these markers are known to target different genomic fractions involving repeat and/or unique se-quences, which may have differentially evolved or been preserved during the course of natural or artificial selection. Cluster analysis based on coefficient of similarity classified the soybean genotypes into four major clusters, which were designated as I, II, III and IV in this study (Fig-ure 1). The dendrogram indicated that 82% of the 44 soybean genotypes clustered in the range of 0.55 to 0.76 similarity coefficients. A correspondence between photo-periodism and place of origin of the cultivars was evident from Figure 1. The Mantel test indicated good fit for the clustering pattern with fairly moderate bootstrap supports (65%-100%). The cluster ‘I’ was composed of six geno-types from USA, five from Hungary, three from Philip-pines, two from Taiwan and one from China, however S-100 appeared as an outlier in this group (Figure 1). Flowering in this group was delayed from 12-68 days in ex-tended photoperiod. Grouping of soybean ancestors/cul-tivars ftom the USA with Hungarian, French and Japanese genotypes was also reported (Brown-Guediraet al., 2000). The grouping of Jackson, S-100, Evans and Pershing in dif-ferent subclusters in the present study is in the agreement with previous results (Udeet al., 2003). Cluster II mainly consisted of Indian soybean cultivars (14 cultivars) along
with six genotypes from the USA and was again divided into subclusters. The genotypes of this group did not flower under extended photoperiods and are highly photoperiod-sensitive, except for LSb1 and PI424-489A, which flow-ered after 7 and 14 days under extended photoperiod, re-spectively. Grouping of six genotypes/cultivars from the USA along with Indian soybean cultivars in II-a is obvious, as most of the initial Indian soybean varieties are either di-rect introductions from theUSA or were selected or bred us-ing introductions as one of the parent (Karmakar and Bhat-nagar, 1996). The genotypes of subgroup II - b comprised only Indian soybean cultivars and clustered together with 53% similarity. The Indian soybean cultivars shown to cluster in this study mainly came from the central and southern zones of India, and the result is in agreement with an earlier report (Hymowitz and Kaizuma, 1981).
Cluster III consisted of four genotypes (three from Hungary (1145/84, Dun NunII-2-15, 1158/84) and one
Table 3- Total number of bands, proportion of polymorphic bands and
polymorphism information content (PIC) for each AFLP primer pair used in the analysis of 44 soybean lines.
Primer pair Total no. of bands
Proportion of poly-morphic bands
PIC
E-ACC/M-CAA 89 0.55 0.15
E-AAG/M-CTT 101 0.57 0.16
E-ACC/M-CAC 75 0.47 0.12
E-ACA/M-CAC 86 0.43 0.08
E-ACT/M-CAT 98 0.34 0.097
Figure 1- Dendrogram of 44 soybean lines produced by the UPGMA
from the USA (Maple Arrow), which grouped together with 0.545 similarities. Though genotype PI 437418 did not group with cluster III, it showed a reasonable level of simi-larity with this cluster and, thus can be considered as an out-lier of this group. The genotypes of this group showed delayed flowering from 1-5 days in extended photoperiod. Cluster IV included one genotype each from Hungary and India. This cluster consisted of diverse genotypes (MACS330, a cross from Monetta (USA) X EC95937 (USSR), and 11/2/1939, a line from Hungary) which showed no delay in flowering under extended photoperiod. The cluster formed by these two genotypes is not strong and showed only 0.50 similarity between each of its members, which, in turn, showed 0.36 similarity with other genotypes of the present study. It is evident from dendrogram (Figure 1) that soybean cultivars/genotypes from the USA grouped along with genotypes of different origin in differ-ent clusters, the reason being that a large number of the ac-cessions in the USDA soybean collection are from the same regions of China and Korea. These introductions that make up the base of the American germplasm (Brown-Guediraet al., 2000) were used for development of soybean cultivars in the USA.
Soybean producing regions in India range from the lower Himalayan Hills and Northern Plain in the north to the Deccan Plateau in the south. The soybean varieties cul-tivated in these areas were developed through separate breeding programs, because most of the Indian soybean va-rieties are photoperiod sensitive, restricting their cultiva-tion to localized areas only. The genotypes, 11/2/1939 (Hungary) and MACS330 (India) identified as photoperiod insensitive in the present study formed a separate group, as clearly shown by UPGMA (Figure 1). Literature reports in-dicate that there is a relationship between marker diversity of parents and genetic variance of the resulting progeny. Collecting data on genetic diversity in parents and progeny, however, is time consuming and expensive (Maughan et al., 1996). Thus, identifying genetically diverse parents based for desirable trait based on molecular markers would be a good approach for the production of desirable progeny. This approach has been already used for production of high yielding progeny in soybean (Thompson and Nelson, 1998). In the present study, we are making available poten-tial germplasm resources for photoperiod insensitivity to soybean breeders that can be used for introgression of photoperiod insensitivity genes into soybean cultivars for wider adaptability.
Acknowledgments
R.K. Singh is grateful to the National Agricultural Technology Project (Team of Excellence), Indian Council of Agricultural Research, Government of India for the fel-lowship. The authors thank the Director of NRC for Soy-bean Indore for facilities and support provided.
References
Bandelj D, Jakse J and Javornik B (2003) Assessment of genetic variability of olive varieties by microsatellite and AFLP markers. Euphytica 136:93-102.
Bhatia VS, Yadav S, Rashmi A, Lakshami N and Guruprasad KN (2003) Assessment of photoperiod sensitivity for flowering in Indian soybean varieties. Ind J Plant Physiol 8:81-84. Brown-Guedira GL, Thompson JA, Nelson RL and Warburton
ML (2000) Evaluation of genetic diversity of soybean intro-ductions and North American ancestors using RAPD and SSR markers. Crop Sci 40:815-823.
Cregan PB, Jarvik T, Bush AL, Shoemaker RC, Lark KG, Kahler AL, Kaya N, VanToai TT, Lohnes DG, Chung Jet al.(1999) An integrated genetic linkage map of the soybean. Crop Sci 39:1464-1490.
Diwan N and Cregan PB (1997) Automated sizing of fluores-cent-labeled simple sequence repeat (SSR) markers to assay genetic variation in soybean. Theor Appl Genet 95:723-733. Doldi ML, Vollmann J and Lelley T (1997) Genetic diversity in
soybean as determined by RAPD and microsatellite analy-sis. Plant Breed 116:331-335.
Doyle JJ and Doyle JL (1990) Isolation of plant DNA from fresh tissue. Focus 12:13-14.
Hartwig EE and Kiihl RAS (1979) Identification and utilization of a delayed flowering character in soybeans for short day con-ditions. Field Crop Res 2:145-151.
Hymowitz T and Kaizuma N (1981) Soybean seed protein electro-phoresis profiles from 15 Asian countries or regions: Hy-potheses on paths of dissemination of soybeans from China. Econ Bot 35:10-23.
Karmakar PG and Bhatnagar PS (1996) Genetic improvement of soybean varieties released in India from 1969 to 1993. Euphytica 90:95-103.
Keim P, Beavis W, Schupp J and Freestone R (1992) Evaluation of soybean RFLP marker diversity in adapted germplasm. Theor Appl Genet 85:205-212.
Lorenzen LL, Boutin S, Young N, Specht JE and Shoemaker RC (1995) Soybean pedigree analysis using map- based mark-ers: I. Tracking RFLP markers in cultivars. Crop Sci 35:1326-1336.
Maughan PJ, Saghai Maroof MA and Buss GR (1995) Micro-satellite and amplified sequence length polymorphism in cultivated and wild soybean. Genome 38:715-725. Maughan PJ, Saghai Maroof MA, Buss GR and Huestis GM
(1996) Amplified fragment length polymorphism (AFLP) in soybean: Species diversity, inheritance and near isogenic line analysis. Theor Appl Genet 93:392-401.
Narvel JM, Fehr WR, Chu W, Grant D and Shoemaker RC (2000) Simple sequence repeats diversity among soybean plant in-troduction and elite genotypes. Crop Sci 40:1452-1458. Pavlicek A, Hrda S and Flegr J (1999) Free Tree - Freeware
pro-gram for construction of phylogenetic trees on the basis of distance data and bootstrap/jackknife analysis of the tree ro-bustness. Application in the RAPD analysis of the genus Frenkelia. Folia Biol 45:97-99.
Powell W, Morgante M, Andre C, Hanafey M, Vogel J, Tingey S and Rafalski A (1996) The comparison of RFLP, RAPD, AFLP and SSR (microsatellite) markers for germplasm analysis. Mol Breed 2:225-238.
characterize genotypic flowering responses to photoperiod and temperature: A soybean exemplar. Theor Appl Genet 93:519-533.
Rohlf FJ (1998) NTSYS-PC Numerical Taxonomy and Multi-variate Analysis system. Exeter Software, New York. Rongwen J, Akkaya MS, Lavi U and Cregan PB (1995) The use of
microsatellite DNA markers for soybean genotype identifi-cation. Theor Appl Genet 19:43-48.
Sinclair TR and Hinson K (1992) Soybean flowering in response to the long juvenile trait. Crop Sci 32:1242-1248.
Singh RK, Bhat KV, Bhatia VS, Mohapatra T and Singh NK (2008) Association mapping for photoperiod insensitivity trait in soybean. Natl Acad Sci Lett 31:281-283.
Thompson JA and Nelson RL (1998) Utilization of diverse germplasm for soybean yield improvement. Crop Sci 38:1362-1368.
Ude GN, Kenworthy WJ, Costa JM, Cregan PB and Alvernaz J (2003) Genetic diversity of soybean cultivars from China,
Japan, North America and North American ancestral lines determined by Amplified Fragment Length Polymorphism. Crop Sci 43:1858-1867.
Wange L, Guan R, Zhangxiong L, Chang R and Qui L (2006) Ge-netic diversity of Chinese cultivated soybean as revealed by SSR markers. Crop Sci 46:1032-1038.
Weir B (1990) Genetic Data Analysis: Methods for Desecrate Population Genetic Data. Sinauor Assoc, Sunderland, 376 pp.
Zabeau M and Vos P (1993) Selective restriction fragment ampli-fication: A general method for DNA fingerprinting. Euro-pean Patent Application number 92402629.7. Publication number 0 534858 A1.
Associate Editor: Everaldo Gonçalves de Barros