i
Using HDF5 as Best Practices for a
Business Intelligence Initiative
Tiago Cardoso Pereira Fialho Pombeiro
Internship at Sysvalue
This internship report is presented as a partial requirement
in order to obtain the grade of Master in Information
ii
NOVA Information Management School
Instituto Superior de Estatística e Gestão de Informação
Universidade Nova de Lisboa
USING HDF5 AS BEST PRACTICES FOR A
BUSINESS INTELLIGENCE INITIATIVE
INTERNSHIP AT SYSVALUE
by
Tiago Cardoso Pereira Fialho Pombeiro
This internship report is presented as a partial requirement in order to obtain the grade of Master in Information Management, with the specialization on Knowledge Management and Business Intelligence.
Supervisor: Professor Doutor Pedro Miguel Fernandes Ruivo
iii
ACKNOWLEDGMENTS
In the world of information management, the need to manage and present performance data is a big challenge. The thematic: “Using HDF5 as Best Practices for a Business Intelligence Initiative” is very pertinent in the context of the master that the student attended. It provided the opportunity to expand his horizons on this matter, the possibility to learn how to give a pragmatic and informed support to development decisions by going from research and empirical data to conclusions or results. It provided as well the opportunity to apply multiple good practices on the development of a business intelligence initiatives.
The incalculable value of Dr. José Cruz - project manager and lead developer - to the development of the component described on this report, as for tutoring on this internship has to be exalted for without his vision, work, advice and inspiration none of this work could have been achieved.
Thanks for everyone in Sysvalue and in Nova IMS that made this internship possible, as for a very pleasant and rewarding experience.
A special thanks to my supervisor Professor Doctor Pedro Ruivo for driving me on the right direction and making this last step of my master possible and such a rewarding experience.
iv
ABSTRACT
The goal of this report is to detail the internship done by the student Tiago Pombeiro in the company Sysvalue. The internship is a partial requirement for obtaining the Master's degree in Information Management with the specialization on Knowledge Management and Business Intelligence.
The work done places in the development of a component of the product Lighthouse, a platform of continuous monitoring as a service developed and commercialized by Sysvalue. More specifically the component in question focuses in a system for: capture, storage, provision and presentation of the performance data that is captured by the services / infrastructures that are being monitored by the platform, proving the advantages of the use of data format Hierarchical Data Format 5 (HDF5). The development of this component was applied to a business intelligence initiative so that the good practices of this field would be applied.
This report starts by giving an introduction to the context and goals where the internship is inserted upon, followed by the detailed description of the background, context and objectives of the internship itself.
After it is presented the literature background focused on the development of business intelligence projects, as well for HDF5 concepts and purposes - all subjects that were relevant for the internship practical work.
Hereafter the used methodology is described, from which the task and schedule were defined. Subsequently to this section a presentation of the results of the tasks is done, followed by a critical opinion about them. To finalize it is presented the possible future works that can follow this project presented as well a pragmatic reflexion of the internship.
KEYWORDS
v
INDEX
1.
Introduction ... 1
2.
Internship ... 3
2.1.
Background ... 3
2.2.
Context Characterization ... 3
2.3.
Objectives ... 7
3.
Literature Background ... 9
3.1.
Development of BI Projects ... 9
3.2.
Intelligence Creation ... 10
3.3.
Implementation of BI ... 10
3.4.
Hierarchical Data Format 5 (HDF5) ... 13
4.
Method ... 15
4.1.
Tasks Developed and Schedule Followed ... 15
4.2.
Milestones
... 16
5.
Evaluation Of Suitable Data Management ... 17
6.
Results ... 21
7.
Limitations And Future Works ... 25
8.
Conclusion, Implications And Contributions ... 26
9.
References ... 27
vi
FIGURE INDICE
Figure 2.1 - Monitoring panel from Lighthouse ... 4
Figure 2.2 - Image that illustrates the multiple components of the Lighthouse platform ... 5
Figure 3.1 - Process of creation and use of intelligence (Krizan, 1999). ... 10
Figure 5.1 - Chart of the evolution of the reading performance between PyTables and
MySQLdb. ... 19
Figure 5.2 - Chart of the evolution of the writing performance between PyTables and
MySQLdb. ... 20
Figure 6.1 - Diagram of the example of the organization of groups, datasets and dimensions
that the Lighthouse performance data HDF5 files is built upon. ... 22
Figure 6.2 - Example of the content of a HDF5 file from the performance data system in
Lighthouse using the application HDFView. ... 22
Figure 6.3 - Example of a chart regarding the load of the processor of a machine... 24
vii
TABLES INDICE
Table 4.1 - Chronogram of the tasks and schedule to be done during the period of the
viii
LIST OF ABBREVIATIONS
IT Information Technology
BI Business Intelligence
LH Lighthouse.
HDF5 Hierarchical Data Format 5
REST Representational state transfer
1
1.
INTRODUCTION
Analysing data to predict market trends and to improve the performance of business systems has always been part of running a competitive business (Azvine, Cui, & Nauck, 2005). Based on this view we can state that the proficiency of the use and application of this data analysis defines companies position, more or less competitive, which sets them apart from their peers.
According to H. Chen, Chiang, and Storey (2012) big data and big data analytics have been used to describe the data sets and analytical techniques in applications that are complex, which require advanced and unique data storage, management, analysis, and visualization technologies. These four components: storage, management, analysis and visualization are very important on big data environments.
With Business Intelligence use and information technology to collect information and analyse it, company managers can make good decisions and additional cost savings as also improve performance and increase productivity (Azma & Mostafapour, 2012) also provides support to this claim saying "managers must have the know-how to analyse big data to make effective decisions". Based on the above, emerges the problematic and motivation that this report addresses. The investment on the product Lighthouse, a platform of continuous monitoring as a service, for services and infrastructures developed and commercialized by the company Sysvalue, raises the need for the management of data collected by it. This need arises from two sides: on the side of the users - in order for them to evaluate the performance of their services and infrastructures; and from the
Sysvalue administrators side - to enable a deep understanding of the performance and tendencies of systems.
Sysvalue is a Portuguese company that was created on the year 2003. Its headquarters are located on Av. Eng. Duarte Pacheco, 26 – 7 1070-110 Lisboa Portugal, and has more than 20 employees. “Sysvalue offers Auditing and Appraisal, Consultancy and Integration services in Information Security, in a highly specialized context carried out by technical experts with specific training and an almost exclusive commitment to this field of activity” (SysValue, 2016).
3
2.
INTERNSHIP
2.1.
B
ACKGROUNDBased on a study taken upon the MIT Sloan Management Review in collaboration with the IBM Institute for Business Value, to more than 3000 business executives, managers and analysts, from multiple companies located all over the world, 60% of them state that "they have more information that they can use" (LaValle, Lesser, Shockley, Hopkins, & Kruschwitz, 2011). Based on this study we can extrapolate that "data" has invaded the business industries and are at this moment one of the most important factors of production together with the human-resources and capital.
Inside the company Sysvalue, it is possible to identify data sources with a huge potential value that can be explored. It is here where the internship is inserted: “in order to enable and prepare a better way to explore this data sources collected by the platform Lighthouse”.
Taking into account the student masters and the specialization this internship enabled the use of concepts learned throughout the master program in a traversal way. The internship allowed the student to develop multiple skills in the area of research and data management.
2.2.
C
ONTEXTC
HARACTERIZATIONWith the goal of giving response to complex challenges that emerge in the current global business level, Sysvalue - a Portuguese company - tries to develop solutions and technological services with high safety, reliability and conformity. These are provided in the scope of the protection of information, people and infrastructures, making these solutions and services available directly to the market enabling the support to organizations on all its life cycle.
4 Figure 2.1 - Monitoring panel from Lighthouse
It is designed to adapt to every type of contexts, from the simplest (e.g. a blogger that just wants to know if his blog is unavailable) to the more complex (e.g. multi-geographical organizations with thousands of IT services). Figure 2.1 illustrates an example of a monitoring panel of Lighthouse (LH), where it can be seen multiple charts that represent multiple different states of services, and the performance metrics variation throughout time.
LH was created with the main target to support the monitoring of the availability and performance of IT services. However, it is possible to use it for many other ends such as: Counting (and alarmist) of crowds, Monitoring of information security, and Monitoring of ambient telemetry.
The capabilities of this platform are limitless, being only dependent of the type of information made available from the elements to monitor.
In order to allow any organization to minimize or eliminate the inherent costs of the acquisition, configuration and maintenance of a physical monitoring infrastructure LH is available in a cloud version. This enables the clients to relocate all this infrastructure regarding monitoring to the cloud assuring a viable, reliable and efficient performance at all time.
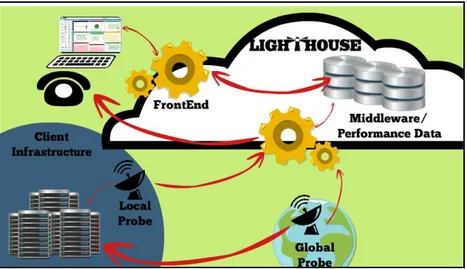
From the inside, Lighthouse platform can be broken into five main components, which description is fundamental in order to understand where the internship task is inserted upon:
5 ● Middleware
● Performance data
● Services and Infrastructures
These components and its interactions are illustrated in figure 2.2 and will be described in detail.
Figure 2.2 - Image that illustrates the multiple components of the Lighthouse platform
Frontend
Every machine built with intention of being controlled by a user has to provide a channel in order for this interaction to happen. Take the buttons on a radio, for example, which are the way a person can choose which frequency to listen to or change the volume, they are merely a user interface (“Frontend”, 2016) allowing the user to create a data communication link towards the processing unit, where all the logic is processed. In the world of Software and more specifically Web Development, this user interface is commonly referred to as the Frontend (Leff & Rayfield, 2001), a digital user interface representing all the interactions the web application or site provides to the user.
6 frontend is also composed by a server-side component which provides a set of REST API Web Services - representational state transfer (Richardson & Ruby, 2008) application programming interface (“Application programming interface”, 2016) that can be “directly mapped to the interaction primitives found in the HTTP standard protocol” (Pautasso, 2009). These web-services were built using the programming language Python, “a widely used high-level, general-purpose, interpreted, dynamic programming language” (“General Python”, 2016) and taking advantage of the Django framework “a free and open-source web framework, written in Python, which follows the model-view-template architectural pattern” (Holovaty & Kaplan-Moss, 2009, p. 3).
Probes
The probes are a concept defined within the Sysvalue development team. They are pieces of software which allow inquiring any system, in order to retrieve metrics regarding the performance of its components or services. There are two types of probes:
● Local probes - that are totally of the responsibility of the client and the normal purpose of them is to inquire the client's system within their infrastructures.
● Global probes - that are managed by Sysvalue in multiple geographical locations in order to test the client's services and infrastructures from an external scope.
Both these types of probes report the metrics to the middleware.
Middleware
Middleware Software serves as a conversion or translation layer (“What is Middleware?”, 2016) allowing other pieces of software to communicate between them. For instance a complex platform generating tons of data and exposes multiple services, some of them not so useful for other applications. By developing simplified services on top of the platform, filtering out unnecessary data and abstracting functions (“Middleware”, 2016) it is possible to expose a much higher level framework for other applications to ingrate with.
7
Performance data
Performance data is one of the main components defined by the LH team and is where the work of the internship resided upon. It is responsible to store and make available the performance data regarding the metrics of the services that are being monitored by the system. This component via web-services enables the possibility of storing and reading the performance metrics, taking advantage of the HDF5 data model. More details and design options are detailed later on in this report.
Services and Infrastructures
Services and Infrastructures are the client assets that he wants to monitor. It can be either servers, web applications, telemetry devices, and so on. The only requirement that it has to have is to be connected to the world-wide-web, or to the private network of the client where there is a local probe that can access the assets and the middleware.
2.3.
O
BJECTIVESIn systems of continuous monitoring like the Lighthouse, the gathering and storage of performance data of the services or infrastructures that are being monitored is an unquestionable requirement. The analysis of the monitored data enables a deep and detailed comprehension of the behaviour of the services or infrastructures and it is a precious help on the diagnostic of potential problems. The performance data contains a big variety of information depending on the type of services or infrastructures that are generating them, and they can be either dimensional (represented by multiple unit systems) or dimensionless (with no unit). Examples of metrics that constitute the performance date can be, for example:
• Available space in a hard disk drive is a storage device - used for storing and retrieving digital data;
8
• How long a Hypertext Transfer Protocol request takes - an application protocol for hypermedia information systems;
• Number of transaction executed by minute on a Database Management System - software for creating and managing databases;
The motivation of this present work was to develop the tasks inherent to the development of the capture, the storage, the provision and the presentation of the performance data that is captured by the services and infrastructures that are being monitored by the system.
9
3.
LITERATURE BACKGROUND
The literature background presented here addresses the theoretical concepts referent to the development of Business Intelligence (BI) initiatives, as well for good practices on the development of them. It was highlighted those studies relevant to this work in a section dedicated to the creation of intelligence describes the process that was followed. The multiple phases of a BI project are described, as well as the best approaches in order to guarantee the success of its implementation, followed by the description and considerations regarding HDF5.
3.1.
D
EVELOPMENT OFBI
P
ROJECTSFirstly, it is important to define what is a project in this work: based on Turner (1993) a project is an effort in which the resources human, financial and material are organized in order to finish a task with determined specifications, with a temporal and financial restrictions, in order to accomplish a benefit change defined by qualitative and quantitative objectives.
Following this and equally important to define is Business Intelligence: based on Turban, Sharda, Aronson, and King (2008), BI is an "umbrella" term that combines architectures, tools, databases, analytical tools, applications and methodologies. BI has for its major goal to enable the iterative access to data, allowing the manipulation of it, in order to give the business managers and analyst the possibility to make analyses. The process of BI is based on the transformation of data into information, that after turns into decisions and finally into actions (Turban et al., 2008).
Clark, Jones, and Armstrong (2007) brings another view on BI stating that it provides decision-makers with data, information, or knowledge to address decisions about problems specific to the individual decision maker’s needs. BI systems are primarily put in to place in order to improve the quality of decisions and provide in time solutions to problems (Clark et al., 2007).
10
3.2.
I
NTELLIGENCEC
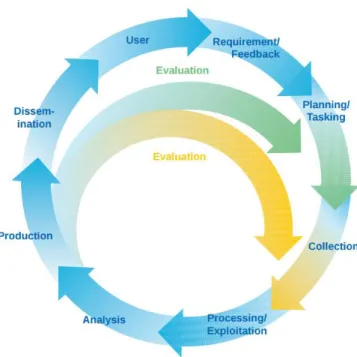
REATIONThe research conducted under this work in order to locate good methodologies in the development of BI projects, identified that in BI initiatives typically follow a process similar to what is used in military intelligence (Turban et al., 2008), more specifically the BI practitioners normally follow the American National Security Model of Krizan (1999) that can be seen in figure 3.1. The process is cyclical with a series of sequential steps.
Figure 3.1 - Process of creation and use of intelligence (Krizan, 1999).
The development of the project, followed a similar approach, but only had one iteration because of time restrictions. The idea is to be able to promote the desire of keep going with multiple cycles within the company after the end of the internship. The listing of the tasks to be done were projected in order to fit into this model logic.
3.3.
I
MPLEMENTATION OFBI
11 Anderson-Lehman, & Reynolds, 2006). According to Visinescu, Jones, and Sidorova (2017) "the positive effect of BI use on perceived information quality is contingent on the high quality of information provided by BI, and that mandating the use of BI that does not deliver high-quality information can actually be detrimental to organizational decision-making". There so the quality of information has to be one of the main focus on a successful BI initiative. Nelson, Todd, and Wixom (2005) identifies the dimension’s accuracy, completeness, currency, and format to be the key elements of information quality.
With the intention of identifying other factors that can influence the implementations of a BI initiative, and in order to be able to foresee what to pay attention in the preparation and execution of the internship a research was made. Asif (2010) identified the main factors that affect the decisions on BI implementations:
1. Analysis and reporting tools
a. Functionalities and characteristics b. Scalability and deployability c. Usability and manageability d. Custom capability
2. Databases
a. Scalability
b. Availability and management c. Security and customization d. Ability of rewriting
3. Extract, Transform, Load Process refers to a process in database usage and especially in data warehousing (Azvine et al., 2005)
a. Capability of reading from any source b. Efficiency and productivity
12 4. Costs
a. Hardware b. Software
c. Internal development d. External development e. Internal training f. Maintenance 5. Benefits
a. Temporal gain and operational efficiency b. Less cost of operations
c. Better service and customer satisfaction
d. Improvement of the decision taken at the strategic and operational level e. Communication and satisfaction improvement of the employees
f. Improvement of the knowledge sharing
These factors were taken into account during the component development.
Moreover, accordingly with Vodapalli (2009) the critical factors for the success of a BI implementations are:
I. Methodological orientated to the business and project management II. Clear vision and planning
III. Sponsorship - committed support from the superior levels of management IV. Management of data and data quality problems
V. Clear mapping of the solution in order to fit the requirements of the user VI. Performance considerations to a BI system
13 These factors had a heavy weight and a big focus on all the options that were made during the project.
3.4.
H
IERARCHICALD
ATAF
ORMAT5
(HDF5)
The problematic addressed by the article "The implementation of a data acquisition and service system based on HDF5" by Y. Chen, Wang, Li, Xiao, and Yang (2016) had many similarities with the
Lighthouse system. The article defines the data acquisition and service system that collects and stores data from a device Keda Torus for eXperiment (KTX) used by scientists primarily to analyse and study magnetic fusion energy.
The modular constitution of the KTX and the multiple sources of data it has is a mimic of the probes and middleware that the Lighthouse is built upon. One particularity of the implementation of this system was the use of the data format HDF5. The article brought to light the advantages inherent to the use of this data format.
HDF5 is the most recent version of the “Hierarchical Data Format” developed originally by the National Center of Supercomputing Applications and has quickly become one of the mechanisms of choice for storing scientific data (HDF, 2016).
The diversity and quantity of users of the HDF5 data format is impressive. For instance, National Aeronautics and Space Administration (NASA, 2016) Earth Observing System has been using HDF (HDF4 and HDF5) for archiving and distributing remote sensing data. Another good example of an implementation of the HDF5 is the Nexus project developed by Könnecke et al. (2015) members of the The NeXus International Advisory Committee. It is an international standard developed by scientists and programmers from multiple continents with the objective of facilitating cooperation in the analysis and visualization of neutron, x-ray and muon data, taking advantage of the HDF5 data format. The list of HDF5 user goes on and is extensive. It and can be consulted on the HDF5 web page of the HDF5 (“HDF5 Users”, 2016).
Collette (2013, p. 4) defines HDF5 as “a mechanism for storing large numerical arrays of homogeneous type, for data models that can be organized hierarchically and benefit from tagging of
14 As data volumes get bigger, managing data becomes imperative, and features like named datasets, hierarchically organized groups and user defined metadata “attributes”, all pillars of HDF5, become precious (Collette, 2013). Below these features will be described in more detail:
● Datasets - are arrays of data that live on the disk. Every dataset has a name (that identifies the dataset), a type (that defines the type on the data to be stored in the dataset) and a shape (that refers to the number of axes / dimensions the dataset will have), and supports random access (in the sense that you can access any part of the dataset you want) (Collette, 2013);
● Groups - The container object that has logic similarities with folders in a file system. They can hold datasets and other groups, that enables a hierarchical structure (Collette, 2013);
● Attributes - are metadata that allows the description of characteristics of the datasets and groups, since they can be linked to them (Collette, 2013).
Other set of characteristics that HDF5 stand out (Folk, Heber, Koziol, Pourmal, & Robinson, 2011) are: ● It gives developers the ability to organize complex collections of data.
● It provides the means for efficient and scalable data storage and access.
● It satisfies a growing need to integrate a wide variety of data types and sources. ● It takes advantage of evolving data technologies but shields users and applications. ● It guarantees the preservation of data.
15
4.
METHOD
This section presents the methodology used in the course of all the phases of the internship.
The first phase was the planning, that enabled the definition of actions that were developed during the whole internship.
The following phase was the identification of requirements. This involved meetings with multiple people on Sysvalue that could help to understand the business needs that exist in terms of data collection and presentation.
Next based on the identification of the requirements the analysis and definition phases were executed, within the development team, with the purpose of formalizing and documenting the actions to be done.
After the analysis, the implementation took place, making sure the test was taking into consideration as well as the documentation, in order to assure a sustainable and safe development.
After all the requirements were met and the tests passed the switch to production was performed. The last phase corresponded to the elaboration of this report. Although it constitutes the end of the internship, the development of it was done in a continuous way, during the entire period of the internship, in order to integrate and document all phases with the best detail possible.
4.1.
T
ASKSD
EVELOPED ANDS
CHEDULEF
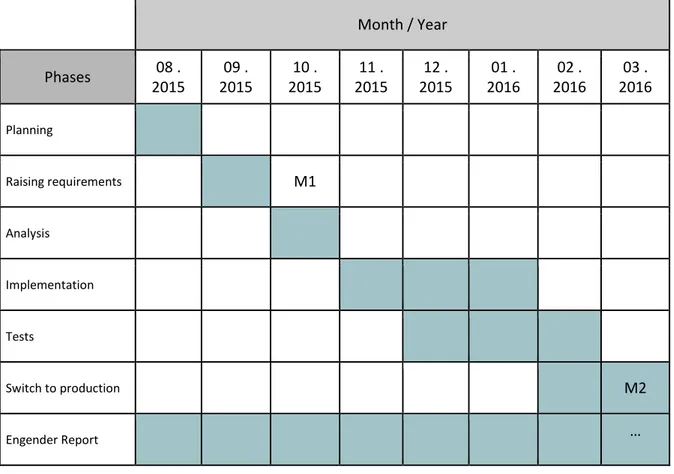
OLLOWED16 Month / Year
Phases 08 .
2015
09 . 2015
10 . 2015
11 . 2015
12 . 2015
01 . 2016
02 . 2016
03 . 2016 Planning
Raising requirements M1
Analysis
Implementation
Tests
Switch to production M2
Engender Report …
Table 4.1 - Chronogram of the tasks and schedule to be done during the period of the internship.
4.2.
M
ILESTONESThe milestones are here exposed as significant events in the development of the internship. The events that where selected where:
• M1 – Milestone 1 -Document plan of implementation done (October 2015)
• M2 – Milestone 2 - Passage to production successfully (March 2016)
17
5.
EVALUATION OF SUITABLE DATA MANAGEMENT
There were multiple challenges to appear during the evaluation of alternatives to data management regarding the performance data collected by Lighthouse. The functional requirements of the problem to be solved, were defined by the development team at Sysvalue, in the following way:
1. Each performance metric corresponds to a unique real number. The same system can generate measurements of multiple metrics, but each metric will be treated separately 2. The set of measurements done throughout time constitute time series, for example
measurements, has always a time-stamp associated to it that corresponds to the time of collection.
3. All measures taken have to be stored, not summarized or grouped in older data.
4. Present the temporal series in a graphical way in predefined intervals of time and with a variable resolution. For example, the number of points to present should be predetermined. If the interval of data contains more measurements than the number of points defined, this measurement should be summarized in some form (e.g. a local average around the positions predefined)
To add the functional requirements stated before, three assumptions that needed to be taken into account were defined:
1. Reduced infrastructure costs
2. Use Open-source solution. Open source software is software developed by and for the user community, that can be freely accessed, used, changed, and shared by anyone (“About the Open Source Initiative”, 2016)
3. Possibility of using Python as the language to access the data (Van Rossum, 2007)
18
Round Robin database
The round robin database (DBRR) is an excellent tool to store long temporal series. The RRDTool (Tobias, 2016), an implementation of this type of data bases, in particular, was almost all what was needed: robust, with a good performance, simple to implement and easy to use. Unfortunately based on one of the defined requirements that state the need to save all the data and not only the statistic of the past data (specialty of DBRRs), this approach was discarded.
Structured Query Language
Structured Query Language (SQL) is a standard language for accessing and manipulating databases (Oracle, 2016). It is a common approach to whom is looking for robustness, performance and simplicity. However, given one of the assumptions made regarding need for reduced infrastructure costs, it seemed that the computation cost and memory requirements necessary to give response to the expected quantity of data would quickly unfold into a problem.
HDF5 and SQL
The HDF5 as discussed on the “Literature Background” section is a powerful format and its hierarchical structure is highly adaptable to any kind of data structure, but mainly used to store scientific data.
In order to select between an SQL approach and a HDF5 an evaluation of the performance of both had to be done. The selected programming language for the test was python and the packages used for enabling the use of the two approaches were:
• MySQLdb for the SQL interaction: it is a python package with the purpose of enabling the interaction of python programs with MySql databases ("MySQLdb User's Guide", 2016);
• PyTables for the HDF5 interaction: by its documentation ("PyTables’ documentation", 2016), is a package for managing hierarchical dataset and designed to efficiently and easily interact with large amounts of data.
19 that for both returned that exact amount of records. After 100 cycles of tests, the results show that PyTables performed the reading operation with an average of 0.201 seconds, and the MySQLdb with an average of 0.916 seconds.
Figure 5.1, shows a chart that holds 100 points, for both MySQLdb (read line) and PyTables (blue line), each point representing the time the corresponding test took. Two more lines are shown that represent the average of all the tests for both cases.
Figure 5.1 - Chart of the evolution of the reading performance between PyTables and MySQLdb.
For a comparison on the performance of PyTables and MySQLdb, on writing a big amount of data it was evaluated the performance of writing 500.000 measurement on an HDF5 file and SQL Table accordingly. After 100 cycles of tests the results show that PyTables performed the writing operation with an average of 0.572 seconds, and MySQLdb with an average of 6.386 seconds.
20 Figure 5.2 - Chart of the evolution of the writing performance between PyTables and MySQLdb.
21
6.
RESULTS
In the case in hands, the performance of the writing is not critical, since it does not affect the user experience, so it will not be evaluated further. As for reading the results, they reveal that the HDF5 option using the PyTables package (“PyTables’ documentation”, 2016) proves itself to be 4.5 times faster reading than the SQL option using the MySQLdb (“MySQLdb User's Guide”, 2016) package. The 4.5 value stated before comes from the resolution of the simple equation (where it is used the average for each known variable):
MySQLdb = k PyTables <=> 0.916 = k * 0.202 <=> k = 0.916 / 0.202 <=> k = 4.535 =>
PyTables ≃ 4.5 MySQLdb
The revealed speed of HDF5 reading proved that it was possible to make available personalized charts of performance data from thousands of points very fast at very low cost.
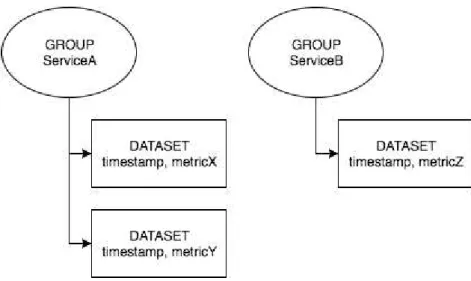
Based on these results it was decided to move on with the implementation of the HDF5 data format. In that sense the following step was to define how the performance data metrics would be organized. Following the HDF5 theoretical concepts it was needed to define groups and datasets. Each group will correspond to a service and in itself multiple datasets, one for each metric that the services will produce. Each dataset will contain two dimensions: a temporal one and another that will correspond to the metric that the dataset is related to. Figure 6.1 illustrates an example of this logic as a diagram, and figure 6.2 is the visualization of a HDF5 file, from the Lighthouse system, using the application HDFView application (“HDFView User's Guide – Introduction”, 2016).
22 Figure 6.1 - Diagram of the example of the organization of groups, datasets and dimensions that the
Lighthouse performance data HDF5 files is built upon.
23 The next challenge was to make a web interface API (“Application programming interface”, 2016) available for the register of measurements and reading the data. That was done by making two web-services available:
● One for storing the performance data - that had to have the metrics data on their payload (timestamp and values) and the identification of the service to which they correspond to. ● Another to read the values for a specific interval. This web-service receives as parameters the
desired metric, the initial and final time (for the window of the desired data) and the service identifier (that identifies which service should the metric be collect from).
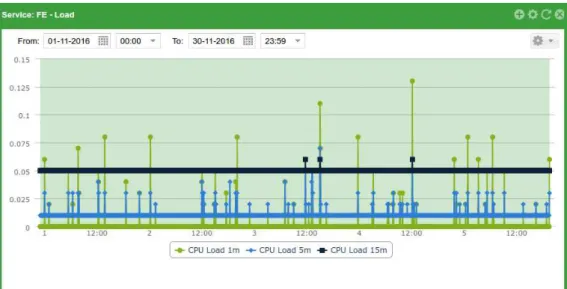
Since no limitations are set for the size of the time windows that a request can ask for, a problem of quantity of data to return emerged (for example if it is asked for all the point regarding a full year of measurements of a given metric, it would be returned more a less 500.000 pairs of real numbers and corresponding time-frame). In order to prevent this escalation of data transfer a maximum resolution of point to return was defined and a mathematical function named convolve (“Numpy.convolve”,
2016) was used in order to mix the two variables time and metric so it was able to get an approximation of the behaviour of the metric within the requested window.
24 Figure 6.3 - Example of a chart regarding the load of the processor of a machine.
The diagram in figure 6.4 illustrates how these components interact with each other in a context where there is a request from the user, in order to plot a chart on the frontend. It also shows the interactions when a probe registers the metrics regarding a service its monitoring.
25
7.
LIMITATIONS AND FUTURE WORKS
26
8.
CONCLUSION, IMPLICATIONS AND CONTRIBUTIONS
HDF5 fitted the needs that the development team at Sysvalue had, regarding the problematic of choosing a suitable data management for the performance data component in the Lighthouse
system. It contributed to Sysvalue clients and administrator users to take advantage of this data to better understand the behaviour of their services and infrastructures. It can be concluded that the potentials of the HDF5 data model are significant because of its observed performance and easy manageability.
Choosing HDF5 resolved the problematic of storing the performance data of the LH system, as for the API (“Application programming interface”, 2016) endpoints developed in Python (“General Python”, 2016) resolved the capture and provision of the performance data in a simple and effective way. Presenting the performance data was achieved using the EXTJS framework (Sencha, 2016) and Highchart chart library (“What Is Highcharts?”, 2016), in the client side. The combination of both provided an effective form of viewing the performance metrics, enabling: zoom’s, metrics comparison, request for specific time frames.
Identifying the factors that influence a BI initiative was very important, because it served as a guide for the development team to be alert of the critical points of interest during the project and also guided the evaluation of main requirements for the development of this component and also the following.
The student’s contribute was great on the development of this component, providing input and support majority at the client-side and server-side of the frontend. The drive of developing this component as a BI initiative helped the company in other projects because the insight obtained in this project served as an example for others.
27
9.
REFERENCES
About the Open Source Initiative. Retrieved from https://opensource.org/about [Accessed 2016] Application programming interface. Retrieved from
https://en.wikipedia.org/wiki/Application_programming_interface [Accessed 2016] Asif, S. (2010). An Overview Of Business Intelligence.
Azma, F., & Mostafapour, M. A. (2012). Business intelligence as a key strategy for development organizations. Procedia Technology, 1, 102-106.
Azvine, B., Cui, Z., & Nauck, D. D. (2005). Towards real-time business intelligence. BT Technology Journal, 23(3), 214-225.
Baars, H., & Kemper, H.-G. (2008). Management support with structured and unstructured data—an integrated business intelligence framework. Information Systems Management, 25(2), 132-148.
Chau, M., & Xu, J. (2012). Business intelligence in blogs: Understanding consumer interactions and communities. MIS quarterly, 36(4), 1189-1216.
Chen, H., Chiang, R. H., & Storey, V. C. (2012). Business Intelligence and Analytics: From Big Data to Big Impact. MIS quarterly, 36(4), 1165-1188.
Chen, Y., Wang, F., Li, S., Xiao, B., & Yang, F. (2016). The implementation of a data acquisition and service system based on HDF5. Fusion Engineering and Design.
Chiang, R. H., Goes, P., & Stohr, E. A. (2012). Business intelligence and analytics education, and program development: A unique opportunity for the information systems discipline. ACM Transactions on Management Information Systems (TMIS), 3(3), 12.
Clark, T. D., Jones, M. C., & Armstrong, C. P. (2007). The dynamic structure of management support systems: theory development, research focus, and direction. MIS quarterly, 31(3), 579-615. Collette, A. (2013). Python and HDF5: " O'Reilly Media, Inc.".
Corte Real, N., Oliveira, T., & Ruivo, P. (2014). Understanding the hidden value of business intelligence and analytics (BI&A).
Folk, M., Heber, G., Koziol, Q., Pourmal, E., & Robinson, D. (2011). An overview of the HDF5
technology suite and its applications. Paper presented at the Proceedings of the EDBT/ICDT 2011 Workshop on Array Databases.
Frontend. Retrieved from http://www.merriam-webster.com [Accessed 2016] GARTNER. (2014). Gartner says worldwide IT spending on pace to reach $3.8 trillion.
Gbosbal, S., & Kim, S. K. (1986). Building effective intelligence systems for competitive advantage.
Sloan Management Review (1986-1998), 28(1), 49.
General Python. Retrieved from https://docs.python.org/2/faq/general.html#what-is-python [Accessed 2016]
Gessner, G. H., & Volonino, L. (2005). Quick response improves returns on business intelligence investments. Information Systems Management, 22(3), 66-74.
HDF5 Users. Retrieved from https://support.hdfgroup.org/HDF5/users5.html [Accessed 2016] HDF. The HDF Group's History. Retrieved from https://www.hdfgroup.org/hdf-group-history/
28 HDFView User's Guide -- Introduction. Retrieved from
https://support.hdfgroup.org/products/java/hdfview/UsersGuide/ug01introduction.html [Accessed 2016]
Hégaret, P. L., Whitmer, R., & Wood, L. (2009). Document Object Model (DOM). Retrieved from https://www.w3.org/DOM/#why [Accessed 2016]
Holovaty, A., & Kaplan-Moss, J. (2009). The definitive guide to Django: Web development done right: Apress.
Işık, Ö., Jones, M. C., & Sidorova, A. (2013). Business intelligence success: The roles of BI capabilities and decision environments. Information & Management, 50(1), 13-23.
Jourdan, Z., Rainer, R. K., & Marshall, T. E. (2008). Business intelligence: An analysis of the literature 1. Information Systems Management, 25(2), 121-131.
Könnecke, M., Akeroyd, F. A., Bernstein, H. J., Brewster, A. S., Campbell, S. I., Clausen, B., . . . Männicke, D. (2015). The NeXus data format. Journal of applied crystallography, 48(1), 301-305.
Krizan, L. (1999). Intelligence essentials for everyone (Joint Military Intelligence College Occasional Paper Number Six). Washington, DC: US Government Printing Office.
Latency - engineering. Retrieved from https://en.wikipedia.org/wiki/Latency_(engineering) [Accessed 2016]
LaValle, S., Lesser, E., Shockley, R., Hopkins, M. S., & Kruschwitz, N. (2011). Big data, analytics and the path from insights to value. MIT sloan management review, 52(2), 21.
Leff, A., & Rayfield, J. T. (2001). Web-application development using the model/view/controller design pattern. Paper presented at the Enterprise Distributed Object Computing Conference, 2001. EDOC'01. Proceedings. Fifth IEEE International.
Luhn, H. P. (1958). A business intelligence system. IBM Journal of Research and Development, 2(4), 314-319.
Malladi, S. (2013). Adoption of Business Intelligence & Analytics in Organizations–An Empirical Study of Antecedents.
Middleware. Retrieved from https://en.wikipedia.org/wiki/Middleware [Accessed 2016] MySQLdb User's Guide. Retrieved from http://mysql-python.sourceforge.net/MySQLdb.html
[Accessed 2016]
NASA. NASA"s Earth Observing System. Retrieved from http://eospso.gsfc.nasa.gov/ [Accessed 2016]
Nelson, R. R., Todd, P. A., & Wixom, B. H. (2005). Antecedents of information and system quality: an empirical examination within the context of data warehousing. Journal of management information systems, 21(4), 199-235.
Numpy.convolve. Retrieved from
https://docs.scipy.org/doc/numpy/reference/generated/numpy.convolve.html [Accessed 2016]
Oracle. (2016). MySql. Retrieved from http://www.mysql.com [Accessed 2016]
Pautasso, C. (2009). RESTful Web service composition with BPEL for REST. Data & Knowledge Engineering, 68(9), 851-866.
Ping - networking utility. Retrieved from https://en.wikipedia.org/wiki/Ping_(networking_utility) [Accessed 2016]
29 Popovič, A., Hackney, R., Coelho, P. S., & Jaklič, J. (2012). Towards business intelligence systems
success: Effects of maturity and culture on analytical decision making. Decision Support Systems, 54(1), 729-739.
PyTables’ documentation. Retrieved from http://www.pytables.org/ [Accessed 2016] Richardson, L., & Ruby, S. (2008). RESTful web services: " O'Reilly Media, Inc.".
Round-trip delay time. Retrieved from https://en.wikipedia.org/wiki/Round-trip_delay_time [Accessed 2016]
Ruivo, P., & Neto, M. (2010). ERP software for Small and Medium-sized Enterprises in Portugal: Exploratory Study of new KPIs. Paper presented at the European Conference on Information Management and Evaluation.
Ruivo, P., & Neto, M. (2011). Sustainable enterprise KPIs and ERP post adoption. Paper presented at the 6th Iberian Conference on Information Systems and Technologies (CISTI 2011).
Sencha. Sencha - Ext JS. Retrieved from https://www.sencha.com/products/extjs/ [Accessed 2016] Solomon, M. D. (2005). Ensuring a successful data warehouse initiative. Information Systems
Management, 22(1), 26-36.
SysValue. SysValue - Who are we. Retrieved from http://www.sysvalue.com/en/who-are-we/ [Accessed 2016]
Tobias, O. The Time Series Database. Retrieved from http://oss.oetiker.ch/rrdtool/ [Accessed 2016] Turban, E., Sharda, R., Aronson, J. E., & King, D. (2008). Business intelligence: A managerial approach:
Pearson Prentice Hall Upper Saddle River, NJ.
Turner, J. R. (1993). The handbook of project-based management: improving the processes for achieving strategic objectives: McGraw-Hill.
Van Rossum, G. (2007). Python Programming Language. Paper presented at the USENIX Annual Technical Conference.
Visinescu, L. L., Jones, M. C., & Sidorova, A. (2017). Improving Decision Quality: The Role of Business Intelligence. Journal of Computer Information Systems, 57(1), 58-66.
Vodapalli, N. K. (2009). Critical success factors of BI implementation. IT University of Copenhagen. W3C. DYNAMIC HTML. Retrieved from https://www.w3.org/Style/#dynamic [Accessed 2016] w3schools. AJAX Introduction. Retrieved from http://www.w3schools.com/xml/ajax_intro.asp
[Accessed 2016]
Watson, H. J., Wixom, B. H., Hoffer, J. A., Anderson-Lehman, R., & Reynolds, A. M. (2006). Real-time business intelligence: Best practices at Continental Airlines. Information Systems
Management, 23(1), 7.
What Is Highcharts? Retrieved from http://www.highcharts.com/products/highcharts [Accessed 2016]
30
10.
ANNEX
This annex explains the technical details of the tests executed between MySQLdb and PyTables. The results in this document were obtained from the execution of the code here presented. It can be executed in any computer that runs a python 2.7 environment and has the python packages: mysqlclient version 1.3.9, numexpr version 2.6.1, numpy version 1.11.2, six version 1.10.0 and tables version 3.3.0. Furthermore, it is necessary to have a localhost mysql engine that contains a database with the name “db” and have a user named “root" with the password “123” (or simple change the settings in the code to match the ones you have defined).
The program logic is the following: for each test, as a start-up, generates 500000 measurements (each measurement has two values: time and a random value), creates an HDF5 file and a SQL table containing the measurements. After that start-up, it writes each one of the 500000 measurement in the HDF5 file, using PyTables, and counts the time it takes to write then all. After it reads the HDF5 file created, also using PyTables, at the start-up and measures the time it takes as well. Following that the same writing and reading test is done but in the MYSQL context using the MySQLdb.
Each test is done by default 100 times - the program accepts as a parameter the number of tests to be done. For each operation (Read/Write MySQLdb/PyTable) the program calculates the average, the minimum and the maximum values the tests took.
Running the code will create 4 files:
● generated_measurements.json - file of the type JSON that contains all measurements that will be used for MySQLdb and for PyTables writing purposes;
● read_file.h5 and write_file.h5 - the HDF5 files resulting of the last test to be executed;
● test_results.txt - file with the results of each test and the average, minimum and maximum values of all the tests.
31 #!/usr/bin/env python
# coding: iso-8859-1
-*-import argparse
import MySQLdb
import os
import random
import sys
import time
import tables
import traceback
DEFAULT_NUMBER_OF_TESTS = 100 # 100
NUMBER_OF_MEASUREMENTS = 500000 # NUMBER_OF_MEASUREMENTS = 500000 HDF5_WRITE_FILE_NAME = "write_file.h5"
HDF5_READ_FILE_NAME = "read_file.h5"
classHdf5Descr(tables.IsDescription): timestamp = tables.Float64Col() testdata = tables.Float64Col()
DB_HOST = "localhost"
DB_USER = "root"
DB_PWD = "123"
DB_NAME = "db"
DB_WRITE_TABLE_NAME = "write_table"
DB_READ_TABLE_NAME = "read_table"
SQL_STARTUP = """ DROP TABLE IF EXISTS %s;
CREATE TABLE %s (
`id` MEDIUMINT NOT NULL AUTO_INCREMENT,
`timestamp` FLOAT NOT NULL,
`testdata` FLOAT NULL,
PRIMARY KEY (`id`));
DROP TABLE IF EXISTS %s;
CREATE TABLE %s (
`id` MEDIUMINT NOT NULL AUTO_INCREMENT,
`timestamp` FLOAT NOT NULL,
`testdata` FLOAT NULL,
PRIMARY KEY (`id`));
""" % (DB_WRITE_TABLE_NAME, DB_WRITE_TABLE_NAME, DB_READ_TABLE_NAME, DB_READ_TABLE_NAME)
YEAR_SECOUNDS = 31556926
# AUX FUNCTIONS
---defcollect_args():
parser = argparse.ArgumentParser(description="BENCHMARK TEST")
parser.add_argument("-nt", "--num_tests", type=int, default=DEFAULT_NUMBER_OF_TESTS, help="The number of tests that will be executed.
Default %d" % DEFAULT_NUMBER_OF_TESTS)
32 return args.num_tests
deflog(msg, with_paragrahp=True):
msg = msg + "\n"if with_paragrahp else msg sys.stdout.write(msg)
deftest_startup():
log("Start - build environment for tests")
for file in [HDF5_WRITE_FILE_NAME, HDF5_READ_FILE_NAME]: try:
os.remove(file) except OSError: pass
hdf5_measurements = [] sql_measurements_one = [] sql_measurements_two = []
for i in range(0, NUMBER_OF_MEASUREMENTS): timestamp = time.time() - YEAR_SECOUNDS testdata = random.uniform(0, 1002.7)
hdf5_measurements.append({'timestamp': timestamp, 'testdata': testdata})
if i < (NUMBER_OF_MEASUREMENTS / 2): # WE DO THIS BECAUSE THE MYSQL DOES NOT ACCEPT QUERIES THAT ARE VERRY BIG sql_measurements_one.append((timestamp, testdata))
else:
sql_measurements_two.append((timestamp, testdata))
hdf5 = HDF5(HDF5_READ_FILE_NAME, "w", Hdf5Descr) hdf5.create()
hdf5.insert(hdf5_measurements) hdf5.close()
db = DB()
db.execute(SQL_STARTUP)
db.execute("INSERT INTO `" + DB_READ_TABLE_NAME + "` (`timestamp`, `testdata`) VALUES %s" % (str(sql_measurements_one)[1:-1],)) db.execute("INSERT INTO `" + DB_READ_TABLE_NAME + "` (`timestamp`, `testdata`) VALUES %s" % (str(sql_measurements_two)[1:-1],)) db.close()
f1 = open("generated_measurements.json", "w") f1.write(str(hdf5_measurements))
f1.close()
# AUX HDF5 FUNCTIONS
---classHDF5(object):
def__init__(self, file_name, open_perm, description_class): self.file_name = file_name
self.open_perm = open_perm
self.description_class = description_class
self.h5f = None
self.open()
33 try:
self.h5f = tables.open_file(self.file_name, self.open_perm) except Exception as e:
self.h5f = None
raise Exception("HDF5.open: Unexpected error creating hdf5 file. (err: %s)" % str(e))
defcreate(self): self.open() try:
self.h5f.create_table("/", "node", self.description_class) except Exception as e:
self.h5f = None
raise Exception("HDF5.create: Unexpected error creating hdf5 file. (err: %s)" % str(e))
return (self.h5f isnotNone)
definsert(self, measurements): try:
tbl = self.h5f.get_node("/", "node") for measurement in measurements: _descr = tbl.row
_descr['timestamp'] = measurement['timestamp'] _descr['testdata'] = measurement['testdata'] _descr.append()
tbl.flush() except Exception as e:
raise Exception("HDF5.insert: Unexpected error inserting new measurements. (err: %s)" % str(e))
defread(self, time): values = [] try:
table = self.h5f.get_node("/", "node")
values = [(x['timestamp'], x['testdata']) for x in table.iterrows() if x['timestamp'] < time]
except Exception as e:
raise Exception("HDF5.read: Unexpected error reading the measurements. (err: %s)" % str(e)) return values
defclose(self): if self.h5f isnotNone: self.h5f.close() self.h5f = None
# AUX MySQL FUNCTIONS
---classDB(object):
def__init__(self):
self._db_host = DB_HOST self._db_user = DB_USER self._db_pwd = DB_PWD self._db_name = DB_NAME
self._db_conn = None
self.open()
34 self._db_conn = MySQLdb.connect(self._db_host, self._db_user, self._db_pwd, self._db_name)
self._db_conn.autocommit(True) except Exception as e:
self._db_conn = None
raise Exception("DB.open: Unexpected error opening database. (err: %s)" % e) return (self._db_conn isnotNone)
defselect(self, sql, params=None): rows = []
try:
cursor = self._db_conn.cursor() cursor.execute(sql, params) rows = cursor.fetchall() cursor.close() except Exception as e: rows = []
raise Exception("DB.select: Unexpected error running query. (err: %s)" % str(e)) return rows
defexecute(self, sql, params=None): try:
cursor = self._db_conn.cursor() cursor.execute(sql, params)
cursor.close()
except Exception as e:
raise Exception("DB.execute: Unexpected error running query. (err: %s)" % str(e))
defclose(self):
if self._db_conn isnotNone: self._db_conn.close() self._db_conn = None
# START MAIN
---if __name__ == "__main__":
sys.stdout = open("tests_result.txt", 'w')
for type_of_test in ["TEST_STARTUP", "HDF5_WRITE", "HDF5_READ", "MYSQL_WRITE", "MYSQL_READ"]: h5f = None
db = None
tests_results = []
try:
number_of_tests = collect_args()
log("TEST: %s - Started - num of tests: %d" % (type_of_test, number_of_tests))
for num_test in range(0, number_of_tests):
if type_of_test == "HDF5_WRITE":
hdf5 = HDF5(HDF5_WRITE_FILE_NAME, "w", Hdf5Descr) hdf5.create()
start_time = time.time() measurements = []
for i in range(0, NUMBER_OF_MEASUREMENTS):
measurements.append({'timestamp': time.time(), 'testdata': i}) hdf5.insert(measurements)
35 elif type_of_test == "HDF5_READ":
hdf5 = HDF5(HDF5_READ_FILE_NAME, "a", Hdf5Descr) start_time = time.time()
hdf5.read(start_time)
tests_results.append(time.time() - start_time) hdf5.close()
elif type_of_test == "MYSQL_WRITE": db = DB()
start_time = time.time() measurements = []
for i in range(0, NUMBER_OF_MEASUREMENTS): measurements.append((time.time(), i))
db.execute("INSERT INTO " + DB_WRITE_TABLE_NAME + " (timestamp, testdata) VALUES %s" % (str(measurements)[1:-1],)) tests_results.append(time.time() - start_time)
db.close()
elif type_of_test == "MYSQL_READ": db = DB()
start_time = time.time()
db.select("SELECT * FROM " + DB_READ_TABLE_NAME + " WHERE timestamp < %s", (start_time,)) tests_results.append(time.time() - start_time)
db.close()
elif type_of_test == "TEST_STARTUP": test_startup()
break
else:
raise"Unknown Type of test."
log("TEST - Ended")
if len(tests_results) > 0:
log("Times: %ss" % str(tests_results))
log("Avg: %ss" % str(sum(tests_results) / len(tests_results))) log("Max: %ss" % str(max(tests_results)))
log("Min: %ss" % str(min(tests_results))) log('---')
log('')