UNIVERSIDADE FEDERAL DO CEARÁ – UFC
FACULDADE DE ECONOMIA, ADMINISTRAÇÃO, ATUÁRIA E CONTABILIDADE – FEAAC
PROGRAMA DE ECONOMIA PROFISSIONAL – PEP
MARX WEBER FERREIRA BARBOSA
BNDES PORTFOLIO OF CORPORATE STAKES AND EQUITY RETURNS: DRIVERS AND IMPACTS
MARX WEBER FERREIRA BARBOSA
BNDES PORTFOLIO OF CORPORATE STAKES AND EQUITY RETURNS: DRIVERS AND IMPACTS
Dissertação submetida à Coordenação do Programa de Economia Profissional – PEP, da Universidade Federal do Ceará - UFC, como requisito parcial para a obtenção do grau de Mestre em Economia. Área de Concentração: Economia do Setor Público.
Orientador: Prof. Dr. Paulo Rogério Faustino Matos
Dados Internacionais de Catalogação na Publicação Universidade Federal do Ceará
Biblioteca Universitária
Gerada automaticamente pelo módulo Catalog, mediante os dados fornecidos pelo(a) autor(a)
B199b Barbosa, Marx Weber Ferreira.
BNDES portfolio of corporate stakes and equity returns: drivers and impacts / Marx Weber Ferreira Barbosa. – 2018.
18 f. : il. color.
Dissertação (mestrado) – Universidade Federal do Ceará, Faculdade de Economia,
Administração, Atuária e Contabilidade, Mestrado Profissional em Economia do Setor Público, Fortaleza, 2018.
Orientação: Prof. Dr. Paulo Rogério Faustino Matos.
1. BNDES. 2. Os retornos das ações aumentam o risco e o desempenho. 3. Conselho Fiscal. I. Título.
MARX WEBER FERREIRA BARBOSA
BNDES PORTFOLIO OF CORPORATE STAKES AND EQUITY RETURNS: DRIVERS AND IMPACTS
Dissertação submetida à Coordenação do Programa de Economia Profissional – PEP, da Universidade Federal do Ceará - UFC, como requisito parcial para a obtenção do grau de Mestre em Economia. Área de Concentração: Economia do Setor Público.
Data de Aprovação: 18 de junho de 2018.
BANCA EXAMINADORA
____________________________________________ Prof. Dr. Paulo Rogério Faustino Matos (Orientador)
Universidade Federal do Ceará - UFC
____________________________________________ Prof. Dr. Márcio Veras Corrêa
Universidade Federal do Ceará - UFC
____________________________________________ Dr. Felipe de Sousa Bastos
RESUMO
Nós acrescentamos à discussão das operações do Banco Nacional de Desenvolvimento Econômico e Social (BNDES) medindo, por meio da estimativa de painel desequilibrado, os direcionadores de sua carteira de participações societárias, cujo volume médio entre 2012 e 2016 foi de US $ 31 bilhões. Também modelamos se o BNDES, como acionista e agente do conselho de administração e do conselho fiscal de empresas, é capaz de impactar seus retornos de ações em termos de medidas de ganho, risco e desempenho. Embora não haja impacto significativo da participação do BNDES ou de sua participação no conselho de administração, sua indicação para o conselho fiscal é relevante tanto para o impacto no Índice de Sharpe quanto para o rebaixamento. Essa constatação é inédita e interessante devido ao momento desse impacto: a nomeação para o conselho fiscal causa, indevidamente, uma redução no índice de Sharpe e um aumento do rebaixamento de ações no primeiro ano; no entanto, encontramos uma reversão no ano seguinte, proporcionando um melhor desempenho e uma redução da perda acumulada de estoques das respectivas empresas.
ABSTRACT
We add to the discussion of National Bank of Economic and Social Development (BNDES) operations by measuring, through the estimation of unbalanced panel, the drivers of its portfolio of corporate stakes, where the average volume between 2012 and 2016 was US$31 billion. We also model whether BNDES, as a shareholder and agent on the board of directors and fiscal council of firms, is able to impact their equities returns in terms of gain, risk and performance measures. Although there is no significant impact from BNDES shareholding or its induction to the board of directors, its appointment to the fiscal council is relevant to both the impact on the Sharpe Index and the drawdown. This finding is unprecedented and interesting due to the timing of this impact: the appointment to the fiscal council undesirably causes a reduction in the Sharpe Index and an increase of the stock drawdown in the first year; however, we find a reversion in the following year, providing a better performance and a reduction of the cumulative loss of stocks of the respective firms.
LISTA DE FIGURAS
LISTA DE TABELAS
SUMÁRIO
1 INTRODUCTION... 8
2 SHAREHOLDING AND RESULT SHARING OF BNDES... 10
3 EMPIRICAL EXERCISE... 12
3.1 Methodology... 12
3.2 Database... 13
3.3 Results on drivers... 13
4 CONCLUSION... 16
1 INTRODUCTION
After a generation of development banks created from the late nineteenth century as an instrument of economic recovery, Brazil took advantage of a second generation – the result of World War II – and in 1952 proposed the creation of its state development bank, the National Bank of Economic and Social Development (BNDES). Its relevance may be measured by its size: in 2014, for example, the BNDES total assets of US $373 billion corresponded to more than 20% of the country's gross domestic product (GDP). In relation to some global financial institutions, the BNDES total assets over the last few years are comparable to those of the Korean Development Bank, the Development Bank of Japan, the Inter-American Development Bank and the World Bank.
BNDES is the largest player in the Brazilian credit market, subsidizing several economic segments not only as a creditor of firms and public governments but as a shareholder of companies; bearer of debentures, investor fund quotas, on-lending for microcredit operators; and supporter of social, cultural, environmental, scientific and technological initiatives. From 2012 to 2016, the average annual disbursement of BNDES was approximately US$60 billion, which was allocated to the above listed initiatives and other types of operations, according to its transparency portal.
Looking at the extensive literature on BNDES, there is a concentration of most of these contributions in the study of its role as a major creditor of firms. According to the comprehensive survey developed by De Souza et al. (2015) based on almost 1000 studies regarding BNDES until 2013, there is a shortage in what specifically refers to the institution's performance as a player in the Brazilian stock market.
The main and specifically related contributors are Inoue et al. (2013), suggesting that policy makers considering minority equity stakes as an industrial policy tool should avoid pyramidal groups with poor governance and target instead stand-alone firms, Lazzarini et al. (2015), contributing to the evolving debate on the role of state-owned development banks and state-led intervention in credit markets, and Matos (2018), who concluded that BNDES decides to become a shareholder, preferably from publicly-traded companies with low liquidity, low investment and low indebtedness, and the same scenario is used for the decision to appoint independent members to the fiscal councils and of the companies contemplated by the equity interest.
We add to this discussion by measuring, through the estimation of unbalanced panel via Logit from 20112 to 2016, the drivers of the BNDES portfolio. We model whether BNDES, as a shareholder and agent on the board of directors and fiscal council of firms, is able to impact their equities returns in terms of gain, risk and performance measures. The differences in relation to the previous contributions are due to i) updating the study period, post-implementation of new accounting standards in Brazil provided by Law 11.638/07 and International Financial Reporting Standards, ii) modeling the causality and impacts of the portfolio in relation to statistical metrics of returns rather than accounting indicators, and iii) analyzing the impact of its interference in board of directors and fiscal council of firms.
2 SHAREHOLDING AND RESULT SHARING OF BNDES
The composition of BNDES annual total assets is mainly given by: a) credit portfolio and on-lending, b) bonds and securities, c) portfolio of corporate stakes, and d) other assets. During the period from 2012 to 2016, the priority associated with the credit portfolio may be evidenced by its total asset share, ranging from 68.8% to 74.8%, while the equity portfolio ranged from US$15.6 billion to US$49.8 billion in this period, with its share of total assets ranging from 5.6% to 13.6%, with a decreasing trend except for the last year, according to Figure 1. The composition of this portfolio is given by shares that the federal government held in BNDES as capital and minority and transitory investments that represent an instrument of support for the process of capitalization and development of national companies as well as strengthening the Brazilian capital market. This allocation includes investments in non-affiliated companies, associates and other investments with a net of provision for impairment.
Figure 1 – BNDES portfolio of corporate stakes
Data source: BNDES Annual Report
Although it is not a priority or majority allocation of total assets, we show the significant and heterogeneous relevance of the composition of the BNDES results in Figure 2.
These results from corporate stakes are due toequity equivalence, revenue from dividends and
from 2012 to 2014. From 2015 onwards, there is an increase of 40% in revenues from financial intermediation and a reduction of corporate income from a level of US$1.2 billion to US$1.6 billion in losses.
According to the BNDES reports, except for the year 2016, there is a succession of falls in this portfolio: 9.3% in 2013, 27.8% in 2014 and 17.3% in 2015, based on the previous year. In 2013, the bank associates with the movement of the capital market itself, while in 2014 and 2015, this decrease is associated with the devaluation of the equity portfolio in non-affiliated companies, notably Petrobras and Vale shares, which are affected by the fall in commodity prices in the markets and adverse capital market scenarios.
Figure 2 – BNDES results composition
Data source: BNDES Annual Report
3 EMPIRICAL EXERCISE
3.1 Methodology
Our first purpose is modeling the drivers of the BNDES portfolio. We aim to determine whether metrics of gain, risk and performance of the returns of the stocks of the companies supported are able to explain the guiding principles of BNDES decisions.
The first step in the empirical exercise is the logit estimation of the causality exerted by the main financial indicators of the stock returns of firms observed in t-1 in i) the decision of BNDES to participate or not as a shareholder of the company t, ii) the decision to interfere or not in the composition of the board of directors and iii) the decision to interfere or not in the composition of the fiscal council in t. Regarding the stock return metrics, the following indicators are used: i) excess return on stock return over Ibovespa, ii) market beta, iii) drawdown and iv) the Sharpe Index.
Once we have identified the drivers of the BNDES decisions, we perform a second empirical exercise aiming to model the channels of impact of this participation in the stock return metrics of gain, risk and performance. In this context, according to Yeyati, Micco and Panizza (2004), the intervention of the state via the national bank is capable to deal with credit restrictions of projects seemly incapable of attracting private investment and whose social return surpasses the private one. On the other hand, it is possible that we do not show such a beneficial effect but rather a negative consequence is associated with the poor allocation of resources, a consequence of a selection bias of companies most in need of bankruptcy or companies selected by political lobby, as Faccio (2006) argues.
3.2 Database
The data sample used here was extracted from two sources: Valor Econômico and BNDES. Initially, for each of the years of the sample, from 2012 to 2016, all data regarding shareholding were extracted from the BNDES Transparency Portal, which reports the percentage of the bank's participation in a particular company and whether it made use of the prerogative to appoint an independent member to the board of directors and to the fiscal council.
All of the accounting data available from the 1,000 largest companies, according to this source, were collected along with Valor Econômico, provided they were publicly held and presented all of the available book values required to estimate the models suggested here in this chapter.
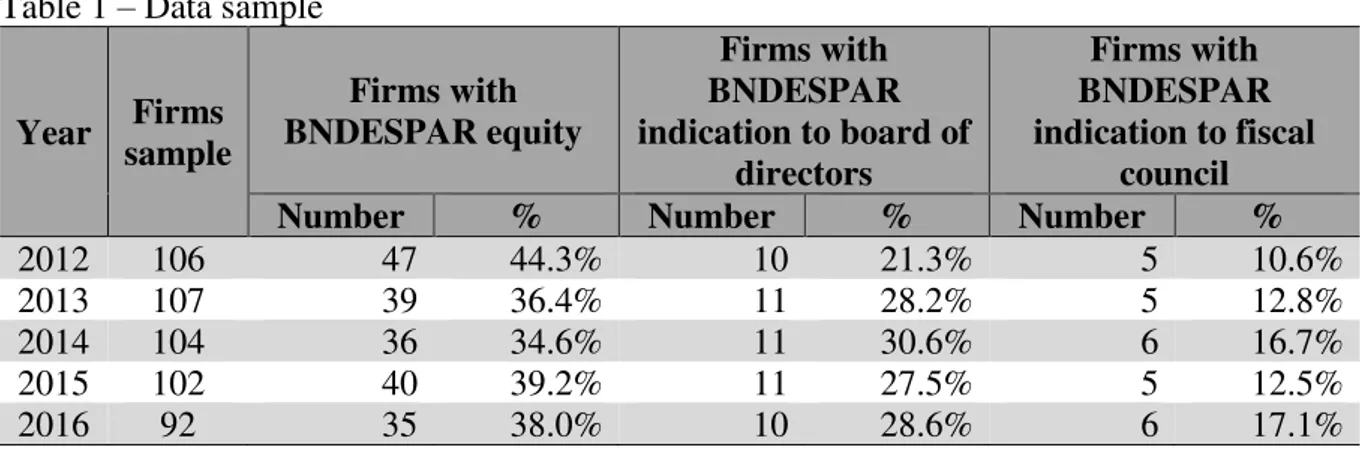
Table 1 reports details about our sample of firms. The total number of firms analyzed was 116, ranging from 92 to 107, depending on the year in question, of which 35% to 45% had BNDES as a shareholder during the analyzed period. BNDES participation through the appointment to the board of directors is more frequent than through appointment to the fiscal council. In the years 2014 and 2016, BNDES interference in the corporate governance of the supported companies reached the highest levels.
Table 1 – Data sample
Year sample Firms BNDESPAR equity Firms with
Firms with BNDESPAR indication to board of
directors
Firms with BNDESPAR indication to fiscal
council
Number % Number % Number %
2012 106 47 44.3% 10 21.3% 5 10.6%
2013 107 39 36.4% 11 28.2% 5 12.8%
2014 104 36 34.6% 11 30.6% 6 16.7%
2015 102 40 39.2% 11 27.5% 5 12.5%
2016 92 35 38.0% 10 28.6% 6 17.1%
Data source: BNDES and Valor Econômico
3.3 Results on drivers
The results reported in Table 2 suggest that the decision of BNDES to participate as a shareholder also takes into account some of the available financial indicators used here in the year prior to the decision. The probability of BNDES to opt for the inclusion of a company depends on the firm’s market beta and its excess return over Ibovespa, while its drawdown – as an absolute risk metric – adversely affects this decision. However, once BNDESPAR decides to support a firm, the decision to interfere via induction to the board of directors and fiscal council takes into account only drawdown; thus, the greater the risk associated with the cumulative loss, the lower the likelihood of induction to both boards. Some of the control variables are significant, such as the size of the firms, regardless of the accounting indicators of investment, performance and liquidity.
Table 2 – Causality drivers of BNDES decisions a, b, c
Variables BNDESPAR equity Indication to BNDESPAR board of directors
BNDESPAR Indication to fiscal
council Financial variables
Excess return t-1 91.0840 * [0.0142] -10.8945 [0.9558] 156.4987 [0.5820] Market beta t-1 63.7186 * [0.0159] 5.1550 [0.8921] 20.6226 [0.7151] Drawdown t-1 -2.3758 * [0.0211] -4.8897 ** [0.0044] -10.1675 ** [0.0001] Sharpe Index t-1 -4.1706 [0.0919] -4.9664 [0.3302] -7.6531 [0.2791]
Control variables Shareholders' Equity
(in log) t-1 0.5089 ** [0.0034] 0.0460 [0.8518] -0.1883 [0.5713] Net revenue (in log) t-1 -0.1104 [0.5257] 0.2596 [0.3000] 0.2711 [0.4385] Control of the firm by
groups t-1 0.0413 [0.8985] -0.3513 [0.4740] -1.5619 [0.1441] ROA t-1 -10.7517 ** [0.0000] -8.1955 * [0.0103] -15.7119 ** [0.0007] Liquidity ratio t-1 -0.8222 ** [0.0000] -0.8605 ** [0.0040] -0.1449 [0.6525] Fixed assets to total
assets t-1 -3.1280 ** [0.0000] -1.1755 [0.2101] -1.1796 [0.3053] Leverage t-1 0.3862 [0.6846] -1.2317 [0.3684] 1.2782 [0.5130] Notes: a Estimates via Logit of an unbalanced panel.b Time period from 2012 to 2016. Data sample: 116 firms and
511 observations. c P-values in brackets. * p < 0.05 ** p <0.01.
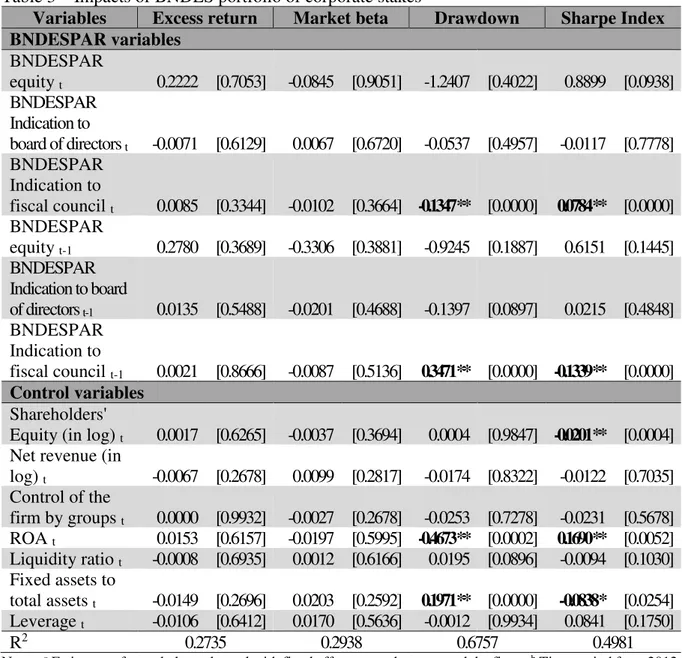
In Table 3, we report the impact of BNDES on the gain, risk and performance of the stock returns of the supported firms. Although there is no significant impact from the BNDES shareholding or from its induction to the board of directors, its appointment to the fiscal council is relevant both in its impact on the Sharpe Index and the drawdown. In the first year, the appointment to the fiscal council undesirably causes a reduction in the Sharpe Index and an increase of the stock drawdown; however, we find a reversion in the following year, providing a better performance and a reduction of the cumulative loss of stocks of the respective firms.
Table 3 – Impacts of BNDES portfolio of corporate stakes a, b, c
Variables Excess return Market beta Drawdown Sharpe Index BNDESPAR variables
BNDESPAR
equity t 0.2222 [0.7053] -0.0845 [0.9051] -1.2407 [0.4022] 0.8899 [0.0938] BNDESPAR
Indication to
board of directors t -0.0071 [0.6129] 0.0067 [0.6720] -0.0537 [0.4957] -0.0117 [0.7778] BNDESPAR
Indication to
fiscal council t 0.0085 [0.3344] -0.0102 [0.3664] -0.1347 ** [0.0000] 0.0784 ** [0.0000] BNDESPAR
equity t-1 0.2780 [0.3689] -0.3306 [0.3881] -0.9245 [0.1887] 0.6151 [0.1445] BNDESPAR
Indication to board
of directors t-1 0.0135 [0.5488] -0.0201 [0.4688] -0.1397 [0.0897] 0.0215 [0.4848] BNDESPAR
Indication to
fiscal council t-1 0.0021 [0.8666] -0.0087 [0.5136] 0.3471 ** [0.0000] -0.1339 ** [0.0000] Control variables
Shareholders'
Equity (in log) t 0.0017 [0.6265] -0.0037 [0.3694] 0.0004 [0.9847] -0.0201 ** [0.0004] Net revenue (in
log) t -0.0067 [0.2678] 0.0099 [0.2817] -0.0174 [0.8322] -0.0122 [0.7035] Control of the
firm by groups t 0.0000 [0.9932] -0.0027 [0.2678] -0.0253 [0.7278] -0.0231 [0.5678] ROA t 0.0153 [0.6157] -0.0197 [0.5995] -0.4673 ** [0.0002] 0.1690 ** [0.0052] Liquidity ratio t -0.0008 [0.6935] 0.0012 [0.6166] 0.0195 [0.0896] -0.0094 [0.1030] Fixed assets to
total assets t -0.0149 [0.2696] 0.0203 [0.2592] 0.1971 ** [0.0000] -0.0838 * [0.0254] Leverage t -0.0106 [0.6412] 0.0170 [0.5636] -0.0012 [0.9934] 0.0841 [0.1750]
R2 0.2735 0.2938 0.6757 0.4981
Notes: a Estimates of an unbalanced panel with fixed effects over the years and the firms.b Time period from 2012
4 CONCLUSION
BNDES annual reports clearly indicate that the priority of variable income operations, in addition to BNDES cash flow, is to promote the strengthening of the capital market and improve the management and governance practices of the companies supported. As a shareholding portfolio with an average volume between 2012 and 2016 of US$31 billion and an average annual disbursement in the same period of US$0.5 billion, a simple comparison with the market figures shows the shareholder's ability to promote the development of the stock market in a broader sense. According to the B3 database, between 2012 and 2016, the total annual average trading volume was close to US$0.7 trillion, with an average daily trading volume higher than US$2.5 billion.
Regarding the justification of having a positive impact on BNDES results, between 2012 and 2014, such an argument made sense, with the portfolio results being responsible for more than 30% of annual results. However, in the years 2015 and 2016, the amount of damage caused by this same portfolio is equivalent to 87% and 54% of the respective annual results, which obviously reached considerably lower levels than those previously recorded.
REFERENCES
DE SOUZA, M; FERREIRA, A.; HANLEY, A.; PIRES, J.; MARCONDES, R.; DE FARIA, R.; SAKURAI, S. A quantitative analysis of the academic economic literature regarding the Brazilian Development Bank (BNDES). EconomiA Anpec, v. 16, p. 157-175, 2015.
FACCIO, M. Politically connected firms. American Economic Review, v. 96, p. 369-386, 2006.
INOUE, C.; LAZZARINI, S.; MUSACCHIO, A. Leviathan as a minority shareholder: Firm-level implications of state equity purchases. Academy of Management Journal, v. 56, p. 1775-1801, 2013.
LAZZARINI, S.; MUSACCHIO, A.; BANDEIRA-DE-MELLO, R.; MARCON, R. What do state-owned development banks do? Evidence from BNDES, 2002-09. World Development, v. 66, p. 237-253, 2015.
MATOS, P. Análise do impacto da carteira de participações acionárias do BNDES. IPEA Press, 2018.
MUSACCHIO, A.; LAZZARINI, S. Reinventing State Capitalism: Leviathan in Business, Brazil and Beyond. Cambridge: Harvard University Press, 2014.


![Table 2 – Causality drivers of BNDES decisions a, b, c Variables BNDESPAR equity BNDESPAR Indication to board of directors BNDESPAR Indication to fiscal council Financial variables Excess return t-1 91.0840 * [0.0142] -10.8945 [0](https://thumb-eu.123doks.com/thumbv2/123dok_br/15651330.620636/16.892.129.809.489.878/causality-decisions-variables-bndespar-bndespar-indication-indication-financial.webp)