Received: 2 April 2010 – Published in Atmos. Chem. Phys. Discuss.: 8 June 2010 Revised: 21 October 2010 – Accepted: 25 October 2010 – Published: 3 November 2010
Abstract. Size-resolved vertical aerosol number fluxes of particles in the diameter range 0.25–2.5 µm were measured with the eddy covariance method from a 53 m high tower over the Amazon rain forest, 60 km NNW of Manaus, Brazil. This study focuses on data measured during the relatively clean wet season, but a shorter measurement period from the more polluted dry season is used as a comparison.
Size-resolved net particle fluxes of the five lowest size bins, representing 0.25–0.45 µm in diameter, were in general dominated by deposition in more or less all wind sectors in the wet season. This is an indication that the source of pri-mary biogenic aerosol particles may be small in this particle size range. Transfer velocities within this particle size range were observed to increase linearly with increasing friction velocity and increasing particle diameter.
In the diameter range 0.5–2.5 µm, vertical particle fluxes were highly dependent on wind direction. In wind sectors where anthropogenic influence was low, net upward fluxes were observed. However, in wind sectors associated with higher anthropogenic influence, deposition fluxes dominated. The net upward fluxes were interpreted as a result of primary biogenic aerosol emission, but deposition of anthropogenic particles seems to have masked this emission in wind sec-tors with higher anthropogenic influence. The net emission fluxes were at maximum in the afternoon when the mixed layer is well developed, and were best correlated with hori-zontal wind speed according to the equation
log10F=0.48·U+2.21
whereFis the net emission number flux of 0.5–2.5 µm parti-cles [m−2s−1] andUis the horizontal wind speed [ms−1] at the top of the tower.
Correspondence to:L. Ahlm ([email protected])
1 Introduction
In the Amazon Basin, organic components typically consti-tute 70 to 90% of the aerosol mass in both the fine and coarse mode (Andreae and Crutzen, 1997; Graham et al., 2003a; Fuzzi et al., 2007). Biomass burning is known to be a large source of organic particles (Reid et al., 2005), thereby ex-plaining the high organic fraction in the dry season. In the wet season, however, the high organic fraction must be at-tributed to biogenic sources (Guyon et al., 2003a, b), but there are still large uncertainties in the relative importance of different sources and production mechanisms of these bio-genic aerosol particles. Measurements of mass concentra-tions of different aerosol compounds and their diurnal vari-ations in the Amazon boundary layer have provided impor-tant knowledge of biogenic aerosol sources in the Amazon Basin (e.g. Artaxo and Maenhaut, 1990; Artaxo and Hans-son, 1995; Graham et al., 2003a, 2003b, Chen et al., 2009). However, diurnal variations in concentration of particularly those compounds that have their source at the surface are to a large extent driven by diurnal variations in boundary layer dynamics. Therefore it is necessary to measure ver-tical fluxes to gain more detailed knowledge of diurnal varia-tions in surface emission and also for quantifying the source strength of individual components.
diameter larger than 10 nm over the Amazon rain forest in the wet season. In that study, it was found that deposition dominated the net particle number flux even in the cleanest prevailing conditions in the wet season. That was an indica-tion that the source of primary biogenic aerosol emission, in terms of number concentrations, may be low when consider-ing the total size range of particles. Also in the dry season, deposition fluxes dominated most of the time (Ahlm et al., 2010). However, upward particle fluxes often appeared in the morning. Rizzo et al. (2010) also observed upward par-ticle number fluxes in the morning simultaneously with in-creasing particle number concentration, during aerosol flux measurements in the dry season at another tower at the same site. These early morning upward fluxes may have been re-lated to primary biogenic aerosol emission of particles that have been stored in the canopy throughout the night, similar to CO2 (Goulden et al., 2006; Ara´ujo et al., 2008; T´ota et al., 2008), and the fact that these upward fluxes were some-times correlated with increasing number concentrations sug-gest that they cannot be explained only as a result of dilution caused by entrainment during mixed layer growth.
In this study, results from measurements of size-resolved fluxes of accumulation mode particles over the Amazon rain forest are presented. The measured particles have diameters between 0.25 and 2.5 µm. Particles larger than 0.25 µm only makes up a minor fraction of the total aerosol number pop-ulation in the Amazon boundary layer, but their size make them efficient as cloud condensation nuclei (CCN). The pri-mary goal of this study is to investigate the number source of primary biogenic aerosol particles in different particle di-ameter intervals. In addition, triggering mechanisms of bio-genic aerosol emission and diurnal variations in both flux and concentration are investigated. Finally, dry deposition is an-alyzed for those particle size ranges that are dominated by deposition fluxes.
Most data to be presented have been measured during the wet season when biogenic sources are expected to domi-nate the aerosol population within the atmospheric bound-ary layer. Additionally, data from measurements during a shorter period in the dry season is used as a comparison to the wet season data. This Brazilian-Swedish project AMAFLUX (Amazonian Biosphere-Atmosphere Aerosol Fluxes in view of their potential control of cloud properties and climate) was carried out as a part of the larger international project LBA (The Large Scale Biosphere Atmosphere Experiment in Amazonia).
2 Method
2.1 Site description
The measurements were carried out at the top of the 53 meter high tower K34 at the rain forest site Reserva Biol´ogica do Cuieiras (2◦ 35.37′S, 60◦ 06.92′W), approximately 60 km
NNW of Manaus, Brazil. The tower K34 is a research fa-cility operated by INPA (The Brazilian National Institute for Research in Amazonia). The canopy height in the Cuieiras Reserve is between 30 and 35 m (Kruijt et al., 2000). South-easterly winds are associated with air transport from Manaus and thereby some anthropogenic influence. The centre of the research station is located approximately 2 km NNW of K34. A diesel generator at the centre of the station provides the research station with electrical power. A more detailed de-scription of the site can be found in Ahlm et al. (2009).
2.2 Eddy covariance measurements
The eddy covariance method was used to measure the mean vertical turbulent aerosol number fluxN′w′, whereN′
and w′ represent fluctuations in aerosol number concentration and vertical wind speed from the temporal means of these parameters, and the cross bar represents a temporal mean of the product of the two fluctuations.N′w′was calculated over periods of 30 minutes. The fluctuationsN′andw′ were sep-arated from the mean by linear de-trending, which also re-moves the influence of low frequency trends. The aerosol data were shifted in relation to the wind data to correct for the time lag in the sampling line (calculated from the maxi-mum correlation).
The eddy covariance method requires stationary condi-tions. In this study, the instationarity test by Foken and Wichura (1996) was applied to the particle fluxes in order to filter out fluxes measured in non-stationary conditions. The averaging period 30 min was divided into sub-periods of 5 min. If the difference between the flux calculated over 30 min and the mean of the covariances calculated over the 5 min intervals was larger than 60% (J¨arvi et al., 2009), the flux was rejected. In total, 22% of the particle fluxes were rejected.
Data collected when the friction velocity (u∗ ) is lower than 0.1 m s−1have been rejected in figures that focus on the sign of the flux, in order to reduce the uncertainty of the flux. However,u∗-filtering may result in an overestimation of the average flux. Therefore,u∗-filtering has not been applied in figures with focus on the magnitude of the flux.
losses of semi-volatile compounds, compared to when the air is heated to dry it. The drying procedure before sam-pling removed 50% of the water vapor in the atmosphere, thereby lowering the relative humidity to 50% of its atmo-spheric value (since the partial pressure of water vapor is di-rectly proportional to the number of moles of water). Rissler et al. (2006) has investigated hygroscopic properties of the aerosol in the Amazon and found no step-like deliquescent behavior of the aerosol in the dry or wet period. The particle growth factor could in that study be described by following relation:
Gf=
1+A·
RH/100 1−RH/100
1/3
(1) where RH represents relative humidity and A is a factor with a value of ∼0.1 for the most hygroscopic particles (Dp>250 nm). At a relative humidity of 90%,Gf is∼1.24,
but at a relative humidity of 50%,Gf is only∼1.03. Since the drying procedure in this study will keep the relative hu-midity below 50%, the maximum hygroscopic growth for the most hygroscopic particles in the most humid conditions will not exceed 3%. In daytime, when the average atmospheric relative humidity was 70–80% in this study, the hygroscopic growth of the most hygroscopic particles will be only 1–2%. The error due to hygroscopic growth (Fairall, 1984; Kowal-ski, 2001; Vong et al., 2004) can be estimated by calculat-ing the saturation ratio flux (Fairall, 1984) and by assumcalculat-ing a particle size distribution in the Junge form (Junge, 1963). This error can be large when the slope of the number distri-bution is steep. However, due to the drying procedure in this study, the error due to hygroscopic growth was estimated to be below 10%. In addition to water vapor, semi-volatile or-ganic and inoror-ganic vapors may result in particle growth and shrinkage, leading to spurious number fluxes for fixed size-bins, as pointed out by Nemitz and Sutton (2004) and Nemitz et al. (2009). Due to the very large uncertainty in particle growth rates in the Amazon Basin (Martin et al., 2010), these potential errors are harder to quantify, though.
whole OPC size range have been calculated.
2.3.2 Additional measurements used during data analysis
Mass concentration of equivalent black carbon (BCe) was
provided by S˜ao Paulo University using a Thermo Scientific Multi-Angle Absorption Photometer (MAAP), model 5012. This measurement derives the concentration of BCefrom the
determination of light absorption at a wavelength of 637 nm. The BCe measurements were performed close to the centre
of the research station, about 2 km from K34.
Additionally, mass concentrations of trace elements were provided by S˜ao Paulo University using particle-induced X-ray emission analysis (PIXE). The sampling for the PIXE trace element analysis was also performed at the centre of the research station.
Meteorological parameters (rain amounts and photosyn-thetic active radiation) were measured at the K34 tower and provided by INPA. These were logged on a Campbell CR-10 (Campbell Scientific UK) data logger with a sampling inter-val of 30 s and stored as either 10 or 30 min averages.
2.4 Flux corrections
2.4.1 Corrections
Particle fluxes measured with the eddy covariance method are underestimated due to the limited time response of the OPC and attenuation of turbulent fluctuations in the sampling line. The time response of a first-order instrument for a step change in concentration fromc1 toc2 can be described as (Doebelin, 1990)
cm(t )=c2+(c1−c2)e−t /τ (2)
wheret represents time,τ is the first-order time constant of the instrument, andcm(t )is the measured particle
τ
τ
τ
τ
Fig. 1. (a)Time response of the Grimm 1.109 for a step decrease in particle concentration (blue) and time response curves for different values onτ(Doebelin, 1990). —bf(b) Cospectral transfer functions for the OPC (Horst et al., 1997) (blue), tube (Lenschow and Rau-pach, 1991) (green) and in total (red) compared with a cospectral transfer function (Horst et al. 1997) forτ=0.6 (cyan).
to zero. The result can be seen in Fig. 1a, where τ=0.3 gives the best fit to the data points. The experiment was re-peated several times, with similar results, so the estimation of τ seems reliable. The total time constant for both OPC and sampling line was estimated using cospectral transfer func-tions (Fig. 1b) for damping of particle fluctuafunc-tions in laminar flow (Lenschow and Raupach, 1991) and in a sensor (Horst et al., 1997). Multiplying these two transfer functions gave a total time constant ofτ=0.6.
The aerosol fluxes in this study have been corrected for these fluctuation attenuations according to Horst at al. (1997). The median increase in flux due to this correc-tion was 5% in the wet season. The 25 and 75 percentiles were 3 and 14%, respectively. The increase in flux in the dry season was also 5%, and the 25 and 75 percentiles were 3 and 22%.
In addition, aerosol fluxes and concentrations were cor-rected for losses in the sampling line. The sampling line was
very close to vertical so losses due to settling were negligi-ble. However, the inlet of the tubing was bent downwards to prevent rainwater entering the sampling line. The sampling line was also slightly bent at two other points. For laminar flow, the inertial deposition of particles due to tube bends is given by the equation (Crane and Evans, 1977)
Bend loss=St k·8
2 (3)
whereStkis Stokes number and8is the bend angle in radi-ans. All size resolved concentrations and fluxes in this study have been corrected according to Eq. (3) for the three bends. The relative losses due to these bends were less than 0.05% for the first OPC channel (0.25< Dp<0.28 µm), gradually
increasing with increasing Dp within the OPC size range,
to reach 1.6% for the last OPC channel (2.0< Dp<2.5 µm).
The reason for the small inertial loss is the laminar flow. Losses due to diffusion were estimated using relations for diffusion in laminar flow in Hinds et al. (1999). The aver-age diffusional loss was 0.4% for the first OPC channel and 0.07% for the last OPC channel. Since these values are small, the impact of diffusional losses within the sampling line has been neglected.
No Webb correction (Webb et al., 1980) has been applied to the fluxes. Temperature fluctuations are dampened in a tubing of several meters (Rannik et al., 1997) and therefore the particle fluxes were not corrected with regard to sensi-ble heat fluxes. Nor were the fluxes corrected with regard to latent heat fluxes, since the sampled air was dried before entering the OPC.
2.4.2 Error treatment
The uncertainty in number concentration due to discrete counting was calculated from the equation (Hinds et al., 1999)
δ(N )=√1
n (4)
whereδ(N )is the relative error in number concentration for half-hourly averaged data andnis the number of counts per half hour. The median relative uncertainty in particle concen-tration of the first OPC channel was 0.14% and 0.07% in the wet and dry season, respectively. The corresponding relative uncertainties for the last OPC channel, where the number of particles is much lower, were 2.3% and 1.8%.
The uncertainty in flux due to discrete counting can be ex-pressed as
δ(N′w′)=pσwN
N Q1t (5)
whereσwis the standard deviation of the vertical wind,Nis
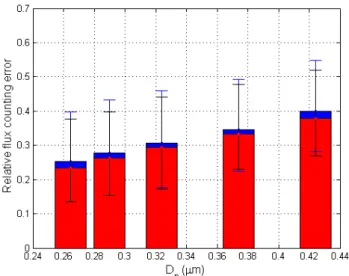
Fig. 2.Median relative counting error (bars) in particle flux for the five first OPC channels during the wet (blue) and dry (red) season. Error bars represent 25 and 75 percentiles of the counting error in the wet (blue) and dry (black) season
the particle counter (Fairall, 1984). Thus, the relative uncer-taintyεin flux due to discrete counting becomes
ε(N′w′)
=√σQ1tw ·p 1 N·vt
(6)
where
vt= −
N′w′
N (7)
is the particle transfer velocity.
This means that the relative flux uncertainty in many cases becomes larger when the aerosol number concentration de-creases. Figure 2 shows the median relative counting un-certainty in flux for the first five OPC channels. The wet season uncertainty (blue bars) are slightly higher than the dry season uncertainty (red bars). The flux uncertainty in-creases with increasing particle size, and thereby decreasing particle numbers, in both seasons. However, the median un-certainty in flux is lower than 50% for all the five size bins. Median counting errors for fluxes calculated over the whole OPC size range, with interquartile ranges within brackets, were 17% (8%, 32%) in the wet season, and 16% (9%, 29%) in the dry season. The flux of 0.5–2.5 µm particles was only calculated for the wet season data and the flux was there as-sociated with a median uncertainty of 41% (23%, 82%) due to discrete counting.
2.5 Turbulence spectra
Turbulence spectra were calculated in order to investigate the performance of the eddy covariance system. The spec-tra were obtained using fast Fourier spec-transform (FFT) for data
2.5 μm (b), and averaged frequency
2.5 μm (d). Variance spectra are
Fig. 3.Averaged frequency weighted variance spectra (S)of parti-cle number concentration within the total OPC size range(a), and within the diameter interval 0.5–2.5 µm(b), and averaged frequency weighted covariance spectra (C) between vertical wind and particle number concentration within the total OPC size range(c)and within the diameter interval 0.5–2.5 µm(d). Variance spectra are normal-ized with the variance of particle concentration, whereas cospec-tra are normalized with the covariance of vertical wind and parti-cle concentration. All spectra are frequency weighted and plotted against dimensionless frequency (f). Data were collected between 12:00 and 12:30 local time on 23 March.
representing time periods of 30 minutes. Variance spectra for horizontal and vertical wind have been presented in Ahlm et al. (2009) for data measured from the same tower during the same measurement campaign. That study also included spec-tra of the covariance between horizontal and vertical wind.
In this section, some examples of turbulence spectra incor-porating measurements using the OPC are presented. Fig-ure 3 shows variance spectra for particle number concentra-tion within the total OPC size range and for the diameter interval 0.5–2.5 µm, and corresponding co-spectra between particle concentrations and vertical wind. The normalized frequency weighted spectra have been averaged over loga-rithmically changing intervals. The data were collected be-tween 12:00 and 12:30 local time on 23 March. This period was characterized by slightly unstable conditions and an av-erage friction velocity of 0.14 m s−1.
Fig. 3b, the co-spectra were not significantly influenced by this noise. This is an indication that that the noise is not cor-related with the vertical wind speed, and therefore not adding any false flux.
3 Results and discussion
The wet season OPC measurements started at 11 March and lasted until 27 May 2008. The shorter dry season OPC mea-surements were performed between 1 and 12 August 2008. During the wet season period, there were two clear episodes of higher concentrations of mineral dust, likely transported from the Sahara as been observed in several other studies in the Amazon (e.g. Talbot et al., 1990; Swap et al., 1992; For-menti et al., 2001). The enhanced amounts of atmospheric mineral dust were observed as significantly higher concen-trations of the trace elements Al, Fe and Mn from the PIXE analysis. However, the OPC measurements were not running during these two episodes due to technical problems. Influ-ence of mineral dust is therefore expected to be low in the results to be shown in the following sections.
All fluxes, concentrations and meteorological parameters have been averaged over 30 min long intervals in the results that will be presented. Where it is stated that a figure rep-resent median values, medians have been calculated of these 30 min-averaged data.
3.1 Aerosol size distributions
Earlier studies of the aerosol number size distribution over the Amazon rain forest have shown that the two dominating modes occur at diameters 60–90 nm and 130–190 nm (Zhou et al., 2002; Rissler et al., 2006; P¨oschl et al., 2010). This means that only a small fraction of the total aerosol num-ber population is analyzed in this study, since the Grimm 1.109 OPC starts at 250 nm. The median aerosol number concentration within the OPC size range in this study was 33 cm−3in the wet season, and 122 cm−3in the dry season. This can be compared with the total aerosol number con-centration measured with a condensational particle counter CPC (Dp>10nm) that was 682 cm−3and 1513 cm−3in the
wet season and dry season, respectively (Ahlm et al., 2010). Hence, the number of particles measured with the Grimm 1.109 in this study represents roughly 5% and 8% of the total number of particles in the wet and dry season, respectively.
Figure 4 shows median size distributions in the wet and dry season of particle number (a), and volume (b) for each of the 15 OPC channels. Figure 4c shows vertical flux of particles in the first five OPC size bins. The rapid decrease in concentration with increasing particle size is obvious in Fig. 4a. In the volume distribution (Fig. 4b), the concentra-tion increased with increasing diameter forDp>1 µm, and
a coarse mode appears. The ratio of the coarse mode vol-ume to the total volvol-ume within the OPC size range is clearly
Fig. 4.Median size distribution in the wet season (blue) and in the dry season (red) of(a)numbers of particles,(b)particle volume, and (c)vertical flux of the first five OPC channels from data collected when the friction velocity is above 0.1 ms−1. The vertical bars are 25 and 75 percentiles.
larger in the wet season than in the dry season. This is consis-tent with observations by for instance Reid and Hobbs (1998) that biomass burning is a large source primarily of accumu-lation mode particles. The median vertical flux of the first five OPC size bins (Fig. 4c) points downward (negative sign) in both seasons. In these flux medians, half hours with fric-tion velocities lower than 0.1 ms−1 have been excluded to reduce the uncertainty in the eddy covariance flux. The flux is clearly larger in magnitude in the dry season than in the wet season. In general, the flux decreases in magnitude with increasing particle diameter and thereby decreasing number of particles.
3.2 Diurnal cycles
3.2.1 Total OPC size range
In this section, diurnal cycles of total concentration and flux of aerosol particles over the whole OPC size range (0.25 µm<Dp<2.5 µm) are investigated. Figure 5 shows
median diurnal cycles of aerosol number concentration (a) and vertical flux (b) in the wet and dry season. The aerosol number concentrations within the OPC size range are rela-tively stable throughout the day, both in the wet and in the dry season (Fig. 5a).
Fig. 5.Median diurnal cycles of aerosol number concentration(a), aerosol number flux(b), transfer velocity(c), and atmospheric sta-bility(d). Blue curves represent wet season data and red curves rep-resent dry season data. (a)–(c) reprep-resents the total OPC size range and dashed lines are 25 and 75 percentiles.
the lowest OPC channels, where number concentrations are highest (Fig. 4a). The net downward flux in the wet season implies that sources of primary biogenic aerosol particle are small in comparison with the total dry deposition sink, when considering the whole OPC size range. However, when sepa-rately investigating the flux of the larger particles in the OPC size range in Sects. 3.3.3 and 3.4, it will be shown that the role of primary aerosol emission is more important for larger particles.
The particle transfer velocity in the total OPC size range (Fig. 5c) has a very clear diurnal trend with maximum val-ues of 4 mm s−1in both seasons in daytime but considerably lower values at nighttime when turbulence is suppressed by the stable stratification. Particularly stable conditions prevail at nighttime during the dry season (Fig. 5d), whereas unsta-ble conditions dominate in daytime in both seasons.
3.2.2 Size-resolved concentrations
Figure 6 shows median diurnal cycles of the aerosol number concentration for each of the 15 OPC size bins. For each size bin, all median concentrations are normalized with the maximum median concentration during the day within the certain size bin. The median particle concentration of each size bin is shown in Table 1.
In the wet season (Fig. 6a), aerosol number concentrations of the five lowest size bins, representing diameters of 0.25– 0.45 µm, are high between 09:00 and 12:00 LT. In contrast, particles with diameters of 0.5–2.0 µm have relatively low concentrations in the morning but maximum concentrations around 15:00 LT. Hence, it seems that particles of different size have different diurnal trends. In the dry season (Fig. 6b),
Fig. 6.Median diurnal cycles of the particle concentration within all the 15 OPC size bins in 30 min time resolution. For each size bin, all median concentrations are normalized with the maximum median concentration during the day within the certain size bin. Therefore, the figure gives no information of absolute particle concentrations but instead the diurnal trends in concentration for each size bin.(a) represents wet season and(b) represents dry season. Every half hour represents a median of at least 41 half hours in the wet season and at least 11.5 h in the dry season.
number concentrations of particles with diameters between 0.25 µm and 0.65 µm are decreasing when the mixed layer grows in the morning. However, in the size bins representing larger particles, concentrations increase at the same time.
For the two largest channels (Dp=1.6−2.5 µm), wet
sea-son concentrations are highest between 23:00 and 02:00 LT at night. It is not likely that this nocturnal concentration max-imum is a result of any anthropogenic activity, because the maximum is not apparent in the lower OPC size bins. Since these particles are large, primary biogenic aerosol emission is the most likely explanation. The particle concentrations for these two size bins start to increase already in the evening to reach maximum at night. Higher night time concentrations of coarse mode particles (2< Dp<10 µm) were observed by
Table 1. Median aerosol number concentration for each of the 15 OPC size bins in the wet and dry season.
Channel Size bin (µm) Median wet Median dry season concentration season concentration (cm−3) (cm−3)
1 0.25–0.28 13.8 52.5
2 0.28–0.30 8.7 33.4
3 0.30–0.35 5.1 19.4
4 0.35–0.40 2.3 8.6
5 0.40–0.45 0.93 3.2
6 0.45–0.50 0.32 0.97
7 0.50–0.58 0.30 0.86
8 0.58–0.65 0.21 0.68
9 0.65-0.70 0.10 0.33
10 0.70–0.80 0.11 0.35
11 0.8–1.0 0.07 0.21
12 1.0–1.3 0.07 0.20
13 1.3–1.6 0.04 0.12
14 1.6–2.0 0.06 0.15
15 2.0–2.5 0.05 0.09
the higher night time concentrations could be directly linked to fungal spores. This is a likely explanation also for the el-evated night time concentrations of 1.6–2.5 µm particles in this study. Fungal spores are typically 2–20 µm in diameter (Elbert et al., 2007).
However, it cannot be stated from this study whether pri-mary aerosol emission of 1.6–2.5 µm particles is actually higher at night or if the elevated night time concentration is only a result of the variation in boundary layer depth be-tween day and night. The nocturnal boundary layer in the Amazon Basin is typically 80-180 m (Garstang et al., 1990), while the well developed mixed layer often reaches a depth of ∼1000 m (Fisch et al., 2004). Therefore, the source of primary aerosol emission would not necessarily have to be stronger at night time just because the concentration maxi-mum occurs at that time. However, as Graham et al. (2003a) pointed out, it is widely believed that the active discharge of several spore types is favored by humid conditions, and the relative humidity frequently reaches 100% at night time over the Amazon rain forest.
3.3 Pristine versus polluted conditions in the wet season
Even though the wet season in the Cuieiras Reserve repre-sents one of the cleanest conditions that can be found on Earth, with aerosol concentrations close to those over remote oceans (Andreae et al., 2009), there is occasionally influence from anthropogenic sources. Figure 7a illustrates how the aerosol number concentration depends on wind direction for each of the 15 size bins in the wet season. The highest par-ticle concentrations are found in the wind sector associated with wind directions between 150 and 180 degrees for all of the 15 size bins. This wind sector represents air trans-port from Manaus. Maximum BCe concentrations at K34
Fig. 7. (a)Wet season median OPC number concentrations as func-tions of wind direction for each size bin of the OPC. Each median concentration has been normalized with the maximum median con-centration of the certain bin. Hence, the colours in the colour bar represent numbers between 0 and 1 where 1 represents the maxi-mum median concentration of the certain size bin. (b)Wet season black carbon concentration medians in constant wind sector inter-vals. Error bars represent 25 and 75 percentiles.
(Fig. 7b) are associated with the same wind sector. Thus, the city Manaus clearly has an impact on the aerosol num-ber population when the wind is blowing from that direction. The lowest concentrations are found in the wind sectors as-sociated with wind directions between 240 and 360 degrees. These sectors include the direction that is associated with air transport from the research station (approximately 340 de-grees). In fact, the minimum concentration is found in the north-westerly wind sector, the specific direction to the diesel generator at the research station. Therefore, it seems that the influence of the research station on aerosol concentration at the top of K34 is negligible for particles within the OPC size range.
Fig. 8. (a)Histogram of particle (Dp=0.25–0.45 µm) flux,(b) Me-dian wet season particle (Dp=0.25–0.45 µm) number flux within constant wind sector intervals with error bars representing 25 and 75 percentiles. (c) Median transfer velocities of particles with
Dp=0.25–0.45 µm. (d) Median wet season size resolved num-ber fluxes within constant wind sector intervals. The color in ev-ery square represents a ratio of the median flux within the certain size bin and wind sector to the absolute value of the largest nega-tive median flux within the same size bin but for any wind sector. Hence, colors below zero in the color bar (blue and green) repre-sent downward fluxes, and colors above zero (red) reprerepre-sent upward fluxes. Particle fluxes obtained when the friction velocity is lower than 0.1 ms−1have been excluded. Every bin represents a median of at least 15.5 h.
and particle transfer velocities will be discussed. All focus will from now on be on the wet season period, since it is hard to find even close to pristine conditions in the dry sea-son, and because the amount of dry season data in this study is too small to reliably represent all wind sectors.
3.3.1 Flux of particles withDp= 0.25–0.45 µm
Figure 8a shows a histogram of particle fluxes with Dp=0.25–0.45 µm. Obviously, there is a very large
domi-nance of deposition fluxes. Figure 8b illustrates how the flux of particles within the same size range depends on wind di-rection. Downward fluxes clearly dominate in all wind sec-tors, indicating that the downward fluxes are not only results of anthropogenic sources. Therefore, it seems that the local source of primary aerosol particles within the particle diam-eter range 0.25–0.45 µm is small. The median transfer ve-locities (Eq. 7) vary between 1.5 and 4 mm s−1 (Fig. 8c). Figure 8d illustrates how the particle flux varies with par-ticle size and wind direction in the same parpar-ticle diameter range. Downward (negative) particle fluxes dominate in all wind sectors for the three lowest OPC channels. For the fourth and fifth channel, upward fluxes are more frequent in the westerly sector but otherwise downward fluxes dominate
Fig. 9. Median values of transfer velocity for particles withDp= 0.25–0.45 µm within intervals of BCeconcentration. The error bars
represent 25 and 75 percentiles. Every median is calculated over at least 38 half hours. Particle fluxes obtained when the friction velocity is lower than 0.1 ms−1have been excluded.
also for these size bins. The fact that the flux medians for all the five lowest OPC channels are somewhat less negative in the westerly sector, a sector that is associated with low an-thropogenic influence (Fig. 7), leads to the question whether deposition of anthropogenic particles may mask a potential primary aerosol source. An efficient way to investigate this is to explore whether the particle transfer velocity changes sign when going from more polluted conditions to extremely clean conditions. Figure 9 shows how the transfer velocity for particles within the diameter size range 0.25–0.45 µm de-pends on mass concentration of BCe. Positive transfer
veloc-ities represent downward fluxes according to Eq. 7. Clearly, the transfer velocities are positive even in the cleanest at-mospheric conditions. This means that downward fluxes of particles with diameter between 0.25 and 0.45 µm dominate even in the absolute cleanest atmospheric conditions, again indicating that the source of primary biogenic aerosol parti-cles in this diameter range is small.
3.3.2 Size-resolved transfer velocities for particles in the size rangeDp= 0.25–0.45 µm
Figure 10 shows median diurnal cycles ofvtfor the five
0.45 μ
Fig. 10. Median diurnal cycles of particle transfer velocity in each of the five size bins in the diameter range 0.25–0.45 µm. The verti-cal bars represent 25 and 75 percentiles.
In daytime,vtfor all the five size bins show maximum
val-ues between 3.5 and 5.5 mm s−1. These peak values are con-siderably higher than the median peak invt at∼1-2 mm s−1
observed for the total particle size range (Dp>10 nm) in
Ahlm et al. (2010). Most studies of aerosol dry deposition show minimum deposition velocities at diameters around 0.1–0.3 µm (Zhang and Vet, 2006), a diameter range where there is no efficient dry deposition mechanism. Brownian diffusion becomes gradually more important with decreas-ing particle size, and interception and impaction become gradually more important for increasing particle sizes (Slinn, 1982; Zhang et al., 2001). This minimum, in which par-ticles tend to be accumulated, is one of the key processes behind the formation of the accumulation mode. The fact that the transfer velocities obtained in this study (for particles withDp>0.25 µm) are considerably larger than the
trans-fer velocities for the total particle size range (Dp>0.01 µm)
in Ahlm et al. (2010) indicates that for conditions observed over the rain forest, the minimum deposition velocity (as a function of particle size) is located at lower diameters than 0.25 µm. The higher transfer velocities in this study can thereby be interpreted as higher efficiency of interception and impaction of particles withDp>0.25 µm compared with
the corresponding average efficiencies of these processes in the total particle size range, which is dominated by particles smaller than 0.25 µm in diameter (Zhou et al., 2002; Rissler et al., 2006). In general,vt increases with increasing
par-ticle size for the five size bins in Fig. 10. This means that the increased efficiency of interception and impaction with increasing particle size can also be observed within the rela-tively small particle diameter range of 0.25–0.45 µm.
Figure 11a shows how the particle transfer velocity, within each of the five size bins, depends on friction velocity. The
Fig. 11. (a)Median particle transfer velocities in different u∗ -intervals. Every median is based on at least 11.5 h.(b)Stars repre-sent median particle transfer velocities in differentu∗-intervals, and the vertical bars are the 25 and 75 percentiles. The linear curves rep-resent deposition velocity as a function ofDpandu∗according to
Eq. (8).
curves are based on median values ofvt in different friction
0.25–0.45 µm. The dry deposition velocity can then be de-scribed as a function of friction velocity and particle size in the form ofvd=(aDp+b)u∗, wherevdis the deposition
ve-locity,u∗is the friction velocity, anda andbare constants. By using the least-square fitting method, the following re-lation was found for particles in the size rangeDp =
0.25-0.45 µm:
vd=(22.12Dp+2.75)u∗ (8)
wherevd is given in [mm s−1],Dp is in [ µm], andu∗is in
[ms−1].
Deposition velocity as a function of particle size and fric-tion velocity, according to Eq. (8) is shown in Fig. 11b, to-gether with the median points from Fig. 11a. It is impor-tant to remember that both half hours representing net down-ward fluxes and half hours of net updown-ward fluxes have been included in the parameterization of the deposition velocity in Eq. (8). The reason for this is that the majority of the net upward fluxes (obtained when the friction velocity is lower than 0.6 ms−1) have been assumed to be caused by random errors, rather than emission. Furthermore, the relative flux error increases with increasing particle size (and thereby de-creasing numbers of particles). If only half hours with a net downward flux are included in the calculation, there is a risk that the calculated deposition velocities would increase with increasing particle size, only as a result of enhanced uncer-tainty in flux. These higher deposition velocities could then be incorrectly interpreted as a result of increased impaction and interception with increasing particle size. Therefore we think it is better to include also half hours with a net upward flux in the parameterization of the deposition velocity, even though there is a risk that a few of the upward fluxes actually could represent real emission also at friction velocities below 0.6 ms−1.
3.3.3 Dependence on wind direction and BCefor
particles withDp= 0.5–2.5 µm
Figure 6a revealed that the OPC size bins representing parti-cles with diameters between 0.5 and 2.5 µm have rather
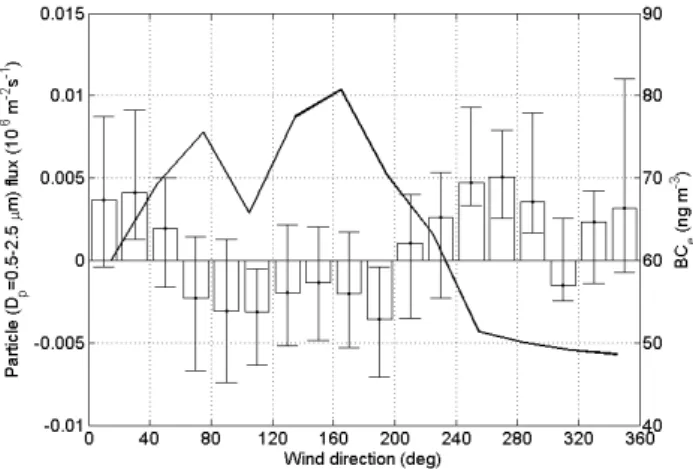
sim-Fig. 12.Median values of vertical flux of particles withDp=0.5– 2.5 µm within constant wind sector intervals. The error bars repre-sent 25 and 75 percentiles. The black curve reprerepre-sents median BCe
concentrations within the same wind sectors. Every bar is a me-dian over at least 16.5 h. Particle fluxes obtained when the friction velocity is lower than 0.1 ms−1have been excluded.
ilar diurnal cycles of particle concentrations in the wet sea-son, with a well defined maximum in concentration during the afternoon (at least for particles withDp<1.5 µm). This
afternoon peak in concentration is not apparent in the diurnal cycles of the smallest particles within the OPC size range.
Since the diurnal cycle of the total OPC size range flux (Fig. 5b) is likely dominated by fluxes of small and thereby numerous particles, it is necessary to investigate the fluxes of the larger particles separately. However, as was stated earlier, it is not possible to calculate size-resolved fluxes of each size bin of the larger particles separately, since the numbers of particles in these bins are too low compared to the resolution of the OPC. Therefore, we have calculated fluxes over one single large diameter interval,Dp=0.5–2.5 µm, to increase
the number of particles to at least an order of magnitude higher than the resolution of the OPC. However, the concen-tration decreases with increasing particle size also within this size interval. Approximately 50% of particles in the diameter range 0.5–2.5 µm are located between 0.5 and 0.65 µm.
Figure 12 shows how the net aerosol number flux of parti-cles within this large size interval varies with wind direction. A black curve showing the BCe dependence on wind
direc-tion (from Fig. 7b) has been added to the figure. Interestingly, downward fluxes dominate in the southerly to north-easterly wind sector where concentrations of BCe are higher, while
upward fluxes dominate in most other wind sectors, where concentrations of BCe are lower. Hence, it seems that in
Fig. 13. (a)Wet season median diurnal cycles of (a) particle con-centration (blue) and flux (red) of 0.5–2.5 µm particles with all wind sectors included,(b)particle concentration (blue) and flux (red) of 0.5–2.5 µm particles with the wind sector 60–200 degrees excluded, and(c)flux of 0.5–2.5 µm particles (solid line) and 0.25–0.45 µm particles (dashed line). Every median is taken over a one hour time interval and represent at least 62 values in (a) and at least 14 values in (b and c).
The fact that local primary aerosol emission seems to be important in the 0.5–2.5 µm interval, in terms of number con-centrations, is not a contradiction to the observations by Chen et al. (2009) who found that the aerosol mass of particles (Dp<1 µm) at the same site during the wet season was
dom-inated by secondary aerosol. The particle diameter interval 0.5–1.0 µm is in a range where the aerosol volume has very low values in the volume distribution in Fig. 4b. Therefore, the aerosol mass in this interval is a very small fraction of the submicron aerosol mass measured by Chen et al. (2009).
3.4 Diurnal cycles of fluxes of particles with diameters of 0.5–2.5 µm
Figure 13a shows the wet season median diurnal cycles of flux and concentration of particles with Dp = 0.5–2.5 µm
when all wind sectors are included. The diurnal cycle of the net flux is somewhat dominated by deposition fluxes even though there is a peak in upward flux around 15:00 LT. How-ever, when the wind sector 60–200 degrees (associated with higher anthropogenic influence in Fig. 12) is excluded, the diurnal cycle is clearly dominated by upward particle fluxes (Fig. 13b). These appear after sunrise at 06:00 LT and in-crease in magnitude throughout most of the day to reach a maximum also here around 15:00 LT. The fact that the largest net upward fluxes appear in the afternoon means that the sign of the flux cannot be a result of entrainment. At 15:00 LT, the mixed layer is well developed (Fisch et al., 2004). The net upward fluxes are instead most likely a result of primary bio-genic aerosol emission, and the fact that they peak during afternoon also suggests that the source here cannot likely be
related to the potential emission observed as upward particle fluxes during early morning in Ahlm et al. (2010). However, that study focused on the total aerosol number population (Dp>10 nm) whereas the fluxes discussed here only include
particles in the diameter range 0.5–2.5 µm. The contribution in number concentration from this interval makes a negligi-ble contribution to the total number concentration studied in Ahlm et al. (2010). Therefore, there is no contradiction be-tween the observed net emission fluxes here, peaking in the afternoon, and the early morning net upward fluxes observed in Ahlm et al. (2010). An implication, however, is that the observed early morning upward fluxes in Ahlm et al. (2010) must be associated with smaller particles than 0.25 µm, since no peak in upward flux is observed in the morning for parti-cles within the OPC size range in this study.
At the same time as the maximum net upward flux ap-pears, the particle concentration is at its maximum (Fig. 13b). Throughout the later part of the afternoon and early evening, the net emission flux decreases in parallel with decreas-ing particle concentrations. Thus, an interestdecreas-ing question is whether emission can explain the increase in aerosol number concentration during the day and the peak in concentration at 15:00 LT. By using values of the median net emission flux in Fig. 13b, it is possible to make a rough estimation of the ex-pected increase in mixed layer particle concentration result-ing from the flux. A net source of∼4000 particles m−2s−1 would need roughly seven hours to increase the particle num-ber concentration by∼0.1 cm−3in an assumed 1000 m thick mixed layer. Here it has been assumed that the emitted par-ticles are evenly distributed in this 1000 m deep layer. In reality, a particle source at the surface will build up a particle gradient that is largest close to the source but decrease with height within the surface layer. This means that an emission from the surface will have a somewhat higher influence on the particle concentration at the top of K34 than higher up in the mixed layer. However, even when considering this, the increase in particle number concentration with ∼0.5 cm−3 between 08:00 and 15:00 LT seems too high to be explained only by the observed net emission flux. Hence, even though emission contribute to the median number concentration in-crease during the day, it seems that some additional source mechanisms are necessary to explain the diurnal cycle of the particle number concentration within the 0.5–2.5 µm diame-ter range. One of these additional mechanisms could be in-cloud processing by Aitken or smaller accumulation mode particles (Zhou et al., 2002).
Figure 13c shows a comparison between the median diur-nal cycle of the net vertical flux of particles withDp=0.5–
2.5 µm (from Fig. 13b) and the corresponding diurnal cycle for particles withDp=0.25–0.45 µm. In both these median
and friction velocity (dashed line). Data collected when wind direc-tions between 60 and 200 degrees prevail have been excluded.
Fig. 15. (a)Wet season median vertical flux of 0.5–2.5 µm parti-cles within constant wind speed intervals. The wind sector 60–200 degrees have been excluded.(b)Stars represent the median values from (a) and the curve is a log-linear fit to the median values. Every bar represents a median over at least 16.5 h.
fluxes of the 0.5–2.5 µm population and net downward fluxes of the 0.25–0.45 µm population appear. We will now look a bit closer at the net emission flux of the 0.5–2.5 µm particles in next section.
3.5 Source mechanism of primary biogenic particles with diameter 0.5–2.5 µm
The median diurnal cycles of horizontal wind speed and fric-tion velocity in the wet season (when the anthropogenic wind sector is excluded) can be seen in Fig. 14. When comparing the diurnal cycles of these two parameters with the corre-sponding diurnal cycle of the net flux of the 0.5–2.5 µm par-ticles (Fig. 13b–c), it appears as the net emission flux might be more related to wind speed than friction velocity. Ac-tually, both peaks in flux (at 11:00 and 15:00 LT) appear at exactly the same time as the peaks in wind speed, indicating that the net emission flux is correlated with horizontal wind speed. Linking the net emission flux to wind speed instead of friction velocity is also preferable since wind speed is eas-ier to measure and is a parameter that is more often available than friction velocity.
mated by using a dry deposition model as e.g. Slinn (1982) or Zhang et al. (2001). The reason why no attempt has been made to correct Eq. (9) for deposition by using a model is that dry deposition models are very sensitive to parameters as e.g. roughness length, displacement height, drag coefficients and collector properties. All these parameters are associated with very large uncertainties for this site, why an attempt to correct for deposition would likely result in further increased uncertainty. Another important point associated with Eq. (9) is that it cannot be stated whether the wind is only responsi-ble for transporting particles out of the canopy layer, or if the wind (and the turbulence it creates) has any direct impact on the actual emission from the specific source.
Fig. 16. (a)Mean diurnal cycle of rain amounts (blue) and median diurnal cycle of latent heat flux (red) during the wet season. (b) Median diurnal cycles of relative humidity (blue) and PAR (red) in the wet season.
Another potential mechanism for generating particle emis-sion is transpiration from plants. Several biogenic related elements (e.g. K, P, S, Zn) in plants are present in the flu-ids circulating in plants and can be released from the plant during transpiration (Nemeruyk, 1970). The latent heat flux is at maximum at 12:00 LT and is much lower at 15:00 LT (Fig. 16a) when the net emission flux is at maximum, indi-cating that the net emission flux is not well correlated with the latent heat flux. However, the latent heat flux includes both evaporation and transpiration. Therefore, the possibil-ity that transpiration contributes to the emission cannot be ruled out.
Gabey et al. (2009) observed that the aerosol number con-centration of particles in the size range 0.8<Dp<20 µm
below the canopy at a rain forest site in Borneo, Malaysia, on average peaked at 15:00 LT. The concentration above the canopy, however, did not show the same behavior. The peak in concentration below the canopy in that study was thought to be a result of fungal spore release triggered by raised rela-tive humidity during the afternoon. It cannot be excluded that a similar source mechanism contributes also to the observed net emission of 0.5–2.5 µm particles in this study in the Ama-zon rain forest. The relative humidity during the wet season was observed to be at minimum around noon followed by in-creasing relative humidity in the afternoon (Fig. 16b) when the net emission flux is at maximum. However, since net up-ward fluxes of 0.5–2.5 µm particles are observed also before noon (Fig. 13b), when the relative humidity decreases (Ahlm et al., 2010), increasing relative humidity is at least not the only source mechanism present in this study.
Thus, the observed fluxes of particles in the diameter range 0.5–2.5 µm indicate a source of biogenic particles in the rain forest, but a more specific source mechanism cannot be de-fined from this study. However, the fact that the net emis-sion flux is correlated with horizontal wind speed makes it possible to describe the emission in models. Even though number concentrations in this diameter range are low, typi-cally 1 particle cm−3, these particles could potentially play an important role as giant nuclei in warm clouds. Primary biogenic aerosol emission has also been observed to be an important source of ice nuclei in the Amazon Basin (Prenni et al., 2009).
To further investigate the actual emission process, par-ticle number fluxes should be measured simultaneously in and above the canopy, similar to the study by Gr¨onholm et al. (2009). This type of measurements could reveal whether the wind actually triggers the emission, or if the correlation between net upward particle fluxes and wind speed results from storage and ventilation processes. Additional aerosol chemistry measurements inside the canopy would increase the possibility to determine what types of particles that are emitted and what sources are responsible for the emission.
4 Summary and conclusions
Size resolved aerosol number fluxes within the particle size range 0.25–2.5 µm diameter were measured with the eddy co-variance method from the top of a 53 m high tower over the Amazon rain forest in the Cuieiras Reserve, Brazil. The mea-surements included a longer period in the relatively clean wet season and a shorter period in the more polluted dry season.
The median aerosol number concentration within the OPC size range (0.25–2.5 µm diameter) in this study was 33 cm−3 in the wet season and 122 cm−3in the dry season, which rep-resents roughly 5% and 8% of the total number of particles in the wet and dry season, respectively. Aerosol number con-centration within the two largest size bins, representing par-ticle diameters between 1.6 and 2.5 µm, were at maximum at night in the wet season. This night time maximum was likely as a result of primary biogenic aerosol emission and may be related to fungal spores as has been observed in pre-vious studies in the Amazon Basin.
The vertical aerosol number flux of the total OPC size range on average pointed downward in both the wet season and dry season. The net deposition flux, however, was con-siderably larger in the dry season, probably to a large extent due to the much higher number of particles in the dry season. The investigation of the size resolved fluxes within the OPC size range showed that the sign of the vertical particle flux may differ for different particle sizes. For the five low-est OPC channels, representing particle diameters of 0.25-0.45 µm, downward fluxes dominated in more or less all wind sectors. This is an indication that the source of primary bio-genic aerosol particles is low in this particle size interval. Transfer velocities in this particle size range were observed to increase with increasing friction velocity and particle di-ameter.
team for all help and support during this campaign. Paulo Artaxo acknowledges financial support from the CNPq/MCT Millennium Institute Program and FAPESP. We thank Paulo Henrique Oliveira (in memoriam) for support during the whole sampling campaign.
Swedish participation was provided by Swedish International Development Cooperation Agency (Sida/SAREC), the Swedish Research Council (VR) and from the 50th birthday of King Carl XVI Gustav Foundation for Science Technology and Environment. We also acknowledge Leif B¨acklin and Kai Rosman for technical assistance, and FORMAS and the Bert Bolin centre for Climate Research for financial support. Finally, we would like to thank
¨
Ullar Rannik for good advices.
Edited by: I. Trebs
References
Ahlm, L., Nilsson, E. D., Krejci, R., M˚artensson, E. M., Vogt, M., and Artaxo, P.: Aerosol Number Fluxes over the Amazon Rain Forest during the Wet Season, Atmos. Chem. Phys., 9, 17335– 17383, doi:10.5194/acp-9-17335-2009, 2009.
Ahlm, L., Nilsson, E. D., Krejci, R., M˚artensson, E. M., Vogt, M., and Artaxo, P.: A Comparison of Dry and Wet Season Aerosol Number Fluxes over the Amazon Rain Forest, Atmos. Chem. Phys., 10, 3063–3079, doi:10.5194/acp-10-3063-2010, 2010. Andreae, M. O. and Crutzen, P. J.: Atmospheric aerosols:
Bio-geochemical sources and role in atmospheric chemistry, Science, 276, 1052–1058, 1997.
Andreae, M. O.: Correlation between cloud condensation nu-clei concentration and aerosol optical thickness in remote and polluted regions, Atmos. Chem. Phys., 9, 543–556, doi:10.5194/acp-9-543-2009, 2009.
Ara´ujo, A. C., Kruijt, B., Nobre, A. D., Dolman, A. J., Maarten, J. W., Moors, E.J., and Souza, J. S.: Nocturnal accumulation of CO2underneath a tropical forest canopy along a topographical gradient, Ecological Applications, 18(??), 1406-1419, 2008. Artaxo, P. and Maenhaut, W.: Trace element concentrations and size
distribution of biogenic aerosols from the Amazon Basin dur-ing the wet season, Nucl. Instr. Meth. Phys. Res., B49, 366–371, 1990.
Artaxo, P. and Hansson H. C., Size distribution of biogenic aerosol-particles from the Amazon Basin, Atmos. Environ., 29, 393–402, 1995.
Elbert, W., Taylor, P. E., Andreae, M. O., and P¨oschl, U.: Contribu-tion of fungi to primary biogenic aerosols in the atmosphere: wet and dry discharged spores, carbohydrates, and inorganic ions, At-mos. Chem. Phys., 7, 4569–4588, doi:10.5194/acp-7-4569-2007, 2007.
Fairall, C. W.: Interpretation of eddy-correlation measurements of particulate deposition and aerosol flux, Atmos. Environ., 18, 1329–1337, 1984.
Fisch, G., Tota, J., Machado, L. A. T., Dias, M., Lyra, R. F. D., Nobre, C. A., Dolman, A. J., and Gash, J. H. C.: The convective boundary layer over pasture and forest in Amazonia, Theo. Appl. Clim., 78, 47–59, 2004.
Foken, T. and Wichura, B.: Tools for quality assessment of surface-based flux measurements, Agr. Forest Meteorol., 78, 83–105, 1996.
Formenti, P., Andreae, M. O., Lange, L., Roberts, G., Cafmeyer, J., Rajta, I., Maenhaut, W., Holben, B. N., Artaxo, P., and Lelieveld, J.: Saharan dust in Brazil and Suriname during the Large-Scale Biosphere-Atmosphere Experiment in Amazo-nia (LBA)-Cooperative LBA Regional Experiment (CLAIRE) in March 1998, J. Geophys. Res., 106, 14919–14934, doi:10.1029/2000JD900827, 2001.
Fuzzi, S., Decesari, S., Facchini, M. C., Cavalli, F., Emblico, L., Mircea, M., Andreae, M. O., Trebs, I., Hoffer, A., Guyon, P., Ar-taxo, P., Rizzo, L. V., Lara, L. L., Pauliquevis, T., Maenhaut, W., Raes, N., Chi, X. G., Mayol-Bracero, O. L., Soto-Garcia, L. L., Claeys, M., Kourtchev, I., Rissler, J., Swietlicki, E., Tagliavini, E., Schkolnik, G., Falkovich, A. H., Rudich, Y., Fisch, G., and Gatti, L. V.: Overview of the inorganic and organic composition of size segregated aerosol in Rondˆonia, Brazil, from the biomass-burning period to the onset of the wet season, J. Geophys. Res., 112, D01201, doi:10.1029/2005JD006741, 2007.
Gabey, A. M., Gallagher, M. W., Whitehead, J., and Dorsey, J., Kaye P. H., and Stanley, W. R.: Measurements and compari-son of primary biological aerosol above and below a tropical forest canopy using a dual channel fluorescence spectrometer, Atmos. Chem. Phys., 10, 4453–4466, doi:10.5194/acp-10-4453-2010, 2010.
Goulden, M. L., Miller, S. D., and da Rocha, H. R.: Nocturnal cold air drainage and pooling in a tropical rain forest, J. Geophys. Res., 111, D08S04, doi:10.1029/2005JD006037, 2006. Graham, B., Guyon, P., Maenhaut, W., Taylor, P. E., Ebert, M.,
Matthias-Maser, S., Mayol-Bracero, O. L., Godoi, R., Artaxo, P., Meixner, F. X., Moura, M. A., Rocha, C. H., Grieken, R. V., Glovsky, M., Flagan, R., and Andreae, M. O.: Composition and diurnal variability of the natural Amazonian aerosol., J. Geophys. Res., 108(D24), 4765, doi: 10.1029/2003JD004049, 2003a. Graham, B., Guyon, P., Taylor, P. E., Artaxo, P., Maenhaut, W.,
Glovsky, M. M., Flagan, R. C., and Andreae, M. O.: Organic compounds present in the natural Amazonian aerosol: Character-ization by gas chromatography-mass spectrometry, J. Geophys. Res., 108(D24), 4766, doi:10.1029/2003JD003990, 2003b. Gr¨onholm, T., Launiainen, S., Ahlm, L., M˚artensson, E. M.,
Kul-mala, M., Vesala, T., and Nilsson, E. D.: Aerosol particle dry de-position to canopy and forest floor measured by two-layer eddy covariance system, 114, D04202, doi:10.1029/2008JD010663, 2009.
Guyon, P., Graham, B., Beck, J., Boucher, O., Gerasopoulos., E., Mayol-Bracero, O. L., Roberts, G. C., Artaxo, P. and Andreae, M. O.: Physical properties and concentration of aerosol par-ticles over the Amazon tropical forest during background and biomass burning conditions, Atmos. Chem. Phys., 3, 951–967, doi:10.5194/acp-3-951-2003, 2003a.
Guyon, P., Graham, B., Roberts, G. C., Mayol-Bracero, O. L., Maenhaut, W., Artaxo, P., and Andreae, M. O.: In-canopy gra-dients, composition, sources, and optical properties of aerosol over the Amazon forest, J. Geophys. Res., 108(D18), 4591, doi:10.1029/2003JD003465, 2003b.
Hinds, W. C.: Aerosol Technology. Properties, Behavior, and Mea-surement of Airborne Particles, 2nd edition, John Wiley & Sons Inc., 1999.
Horst, T. W.: A simple formula for attenuation of eddy fluxes mea-sured with first-order response calculations, Bound. Layer Me-terorol., 82, 219–233, 1997.
Junge, C. E.: Air chemistry and Radioactivity, Academic Press, New York, USA, 4, 114–123, 1963.
J¨arvi, L., Rannik, ¨U., Mammarella, I., Sogachev, A., Aalto, P. P., Keronen, P., Siivola, E., Kulmala, M., and Vesala, T.: Annual particle flux observations over a heterogeneous urban area, At-mos. Chem. Phys., 9, 7847–7856, doi:10.5194/acp-9-7847-2009, 2009.
Kaimal, J. C., Wyngaard, J. C., Izumi, Y., and Cot ´e, O. R.: Spectral characteristics of surface-layer turbulence, Q. J. Roy. Meteorol. Soc., 98, 563–589, 1972.
Karl, T., Guenther, A., Yokelson, R. J., Greenberg, J., Poto-snak, M., Blake, D. R., and Artaxo, P.: The tropical for-est and fire emissions experiment: Emission, chemistry, and transport of biogenic volatile organic compounds in the lower atmosphere over Amazonia, J. Geophys. Res., 112, D18302, doi:10.1029/2007JD008539, 2007.
Kowalski, A. S.: Deliquescence induces eddy covariance and es-timable dry deposition errors, Atmos. Environ., 35, 4843–4851, 2001.
Kruijt, B., Malhi, Y., Lloyd, J., Nobre, A. D., Miranda, A. C., Pereira, M. G. P., Culf, A., and Grace, J.: Turbulence above and within two Amazon rainforest canopies, Bound. Lay. Meteorol., 94, 297–311, 2000.
Kuhn, U., Andreae, M. O., Ammann, C., Ara´ujo, A. C., Branca-leoni, E., Ciccioli, P., Dindorf, T., Frattoni, M., Gatti, L. V., Ganzeveld, L., Kruijt, B., Lelieveld, J., Lloyd, J., Meixner, F. X., Nobre, A. D., P¨oschl, U., Spirig, C., Stefani, P., Thielmann, A., Valentini, R., and Kesselmeier, J.: Isoprene and monoterpene fluxes from Central Amazonian rainforest inferred from tower-based and airborne measurements, and implications on the at-mospheric chemistry and the local carbon budget, Atmos. Chem. Phys., 7, 2855–2879, doi:10.5194/acp-7-2855-2007, 2007. Lenshow, D. H. and Raupach, M. R.: The attenuation of
fluctua-tions in scalar concentrafluctua-tions through sampling tubes, J. Geo-phys. Res., 96, 5259–5268, 1991.
Martin S. T., Andreae, M. O., Artaxo, P., Baumgardner, D., Chen, Q., Goldstein, A. H., Guenther, A., Heald, C. L., Mayol-Bracero, O. L., McMurry, P. H., Pauliquevis, T., P¨oschl, U., Prather, K. A., Roberts, G. C., Saleska, S. R., Silva Dias, M. A., Spracklen, D. V., Swietlicki, E., and Trebs, I.: Sources and properties of Amazonian aerosol particles, Rev. Geophys., 48, 1–42, 2010. Nemeruyk G. E.: Migration of salts into the atmosphere during
tran-spiration, Soviet Plant Physiol. 17, 560–566, 1970.
Nemitz, E. and Sutton, M. A.: Gas-particle interactions above a Dutch heathland: III. Modelling the influence of the NH3 -HNO3-NH4NO3equilibrium on size-segregated particle fluxes, Atmos. Chem. Phys., 4, 1025–1045, doi:10.5194/acp-4-1025-2004, 2004.
Nemitz, E., Dorsey, J. R., Flynn, M. J., Gallagher, M. W., Hensen, A., Erisman, J.-W., Owen, S. M., D¨ammgen, U., and Sutton M. A.: Aerosol fluxes and particle growth above managed grass-land, Biogeosciences, 6, 1627–1645, doi:10.5194/bg-6-1627-2009, 2009.
Prenni, A. J., Petters, M. D., Kreidenweis, S. M., Heald, C. L., Martin, S. T., Artaxo, P., Garland, R. M., Wollny, A. G., and P¨oschl, U.: Relative roles of biogenic emissions and Saharan dust as ice nuclei in the Amazon basin, Nature Geosci., 2, 402– 405, doi:10.1038/ngeo517, 2009.
Pryor, S., Barthelemie, R. J., Sørensen, L. L., Larsen, S. E., Sempre-viva, A. M., Gr¨onholm, T., Rannik, ¨U., Kulmala, M., and Vesala, T.: Upward fluxes of particles over forests: When, where, why?, Tellus B, 60, 372–380, 2008.
P¨oschl, U., Martin, S. T., Sinha, B., Chen, Q., Gunthe, S. S., Huffman, J. A., Borrmann, S., Farmer, D. K., Garland, R. M., Helas, G., Jimenez, J. L., King, S. M., Manzi, A., Mikhailov, E., Pauliquevis, T., Petters, M. D., Prenni, A. J., Roldin, P., Rose, D., Schneider, J., Su, H., Zorn, S. R., Artaxo, P., and Andreae, M. O.: Rainforest Aerosols as Biogenic Nuclei of Clouds and Precipitation in the Amazon, Science, 329, 1513–1516, 2010. Rannik, ¨U., Vesala, T., and Keskinen, R.: On the damping of
temperature fluctuations in a circular tube relevant to eddy co-variance measurement technique, J. Geophys. Res. 102(D11), 12789–12794, 1997.
Rannik, ¨U ., Aalto, P., Keronen, P., Vesala, T., and Kulmala, M.: Interpretation of aerosol particle fluxes over a pine forest: dry deposition and random errors, J. Geophys. Res, 108, 4544, doi:10.1029/2003JD003542, 2003.
Reid, J. S. and Hobbs, P. V.: Physical and optical properties of young smoke from individual biomass fires in Brazil, J. Geo-phys. Res., 103(D24), 32013–32030, 1998.
Garstang, M., Hatriss, R. C., Beether, K. M., and Li, S. M.: Aerosol chemistry during the wet season in central Amazo-nia: The influence of Long-Range transport, J. Geophys. Res., 95(D10), 16955–16969, 1990.
T´ota, J., Fitzjarrald, D. R., Staebler, R. M., Sakai, R. K., Moraes, O. M. M., Acevedo, O. C., Wofsy, S. C., and Manzi, A. O.: Amazon rain forest subcanopy flow and the carbon bud-get: Santar´em LBA-ECO site, J. Geophys. Res., 113, G00B02, doi:10.1029/2007JG000597, 2008.