www.atmos-chem-phys.net/14/6111/2014/ doi:10.5194/acp-14-6111-2014
© Author(s) 2014. CC Attribution 3.0 License.
The Pagami Creek smoke plume after long-range transport to the
upper troposphere over Europe – aerosol properties and black
carbon mixing state
F. Dahlkötter1, M. Gysel2, D. Sauer1,3, A. Minikin1, R. Baumann1, P. Seifert4, A. Ansmann4, M. Fromm5, C. Voigt1,6, and B. Weinzierl1,3
1Deutsches Zentrum für Luft- und Raumfahrt (DLR), Institut für Physik der Atmosphäre, Oberpfaffenhofen, Germany 2Paul Scherrer Institute, Laboratory of Atmospheric Chemistry, Villigen PSI, Switzerland
3Ludwig-Maximilians-Universität München, Meteorologisches Institut, München, Germany 4Leibniz-Institut für Troposphärenforschung, Leipzig, Germany
5Naval Research Laboratory, Washington, D.C., USA
6Johannes Gutenberg-Universität Mainz, Institut für Physik der Atmosphäre, Mainz, Germany
Correspondence to:B. Weinzierl ([email protected])
Received: 23 August 2013 – Published in Atmos. Chem. Phys. Discuss.: 5 November 2013 Revised: 5 March 2014 – Accepted: 14 March 2014 – Published: 20 June 2014
Abstract.During the CONCERT 2011 field experiment with the DLR research aircraft Falcon, an enhanced aerosol layer with particle linear depolarization ratios of 6–8 % at 532 nm was observed at altitudes above 10 km over northeast Ger-many on 16 September 2011. Dispersion simulations with HYSPILT suggest that the elevated aerosol layer originated from the Pagami Creek forest fire in Minnesota, USA, which caused pyro-convective uplift of particles and gases. The 3– 4 day-old smoke plume had high total refractory black car-bon (rBC) mass concentrations of 0.03–0.35 µg m−3at stan-dard temperature and pressure (STP) with rBC mass equiv-alent diameter predominantly smaller than 130 nm. Assum-ing a core-shell particle structure, the BC cores exhibit very thick (median: 105–136 nm) BC-free coatings. A large frac-tion of the containing particles disintegrated into a BC-free fragment and a BC fragment while passing through the laser beam of the Single Particle Soot Photometer (SP2). In this study, the disintegration is a result of very thick coat-ings around the BC cores. This is in contrast to a previous study in a forest-fire plume, where it was hypothesized to be a result of BC cores being attached to a BC-free parti-cle. For the high-altitude forest-fire aerosol layer observed in this study, increased mass specific light-absorption cross sections of BC can be expected due to the very thick coat-ings around the BC cores, while this would not be the case
for the attached-type morphology. We estimate the BC mass import from the Pagami Creek forest fire into the upper tro-posphere/lower stratosphere (UTLS) region (best estimate: 25 Mg rBC). A comparison to black carbon emission rates from aviation underlines the importance of pyro-convection on the BC load in the UTLS region. Our study provides de-tailed information on the microphysics and the mixing state of BC in the forest-fire aerosol layer in the upper troposphere that can be used to better understand and investigate the ra-diative impact of such upper tropospheric aerosol layers.
1 Introduction
use the term “BC” exclusively for the most refractory and light-absorbing component of carbonaceous combustion par-ticles, which is essentially pure carbon, not including organic carbon, brown carbon or inorganic aerosol components. The term “BC-containing” particle is used for referring to com-bustion particles with some BC content. A particle is classi-fied as a “BC-free” particle, if the Single Particle Soot Pho-tometer (SP2) does not detect any BC in the particle, which does not exclude the presence of a small amount of BC be-low the be-lower detection limit of the SP2 (∼0.5 fg BC in a particle). Furthermore, we use the more specific term refrac-tory black carbon (rBC; see Petzold et al., 2013), whenever we refer to quantitative measurements of the rBC mass (or quantities inferred from rBC mass measurements) with the SP2 (Schwarz et al., 2006).
Besides BC, other light-absorbing materials such as brown carbon, a light-absorbing organic carbon (OC), can con-tribute significantly to light absorption (e.g. Andreae and Ge-lencser, 2006; Moosmüller et al., 2009). The largest source of primary carbonaceous fine particles in the global troposphere is anthropogenically- and naturally-occurring biomass burn-ing defined as the sum of all open natural and anthro-pogenic combustion processes using non-fossilized vege-tative or organic fuels (e.g. Akagi et al., 2011). Biomass burning has a major impact on the radiation budget of the atmosphere (Knorr et al., 2012). Diehl et al. (2012) esti-mate the global BC emissions from biomass burning as 1.8– 7.0 Tg per year, while OC emissions range from 14–57 Tg per year. Biomass-burning emissions can be transported to the free troposphere and even into the stratosphere by, for example, pyro-convection, as it was observed for a North American forest fire by, for example, Jost et al. (2004)1. There elevated aerosol layers may form. Biomass-burning aerosol layers are often transported over long distances on hemispheric scales (e.g., Damoah et al., 2004; Mattis et al., 2008; Ramanathan and Feng, 2009; Petzold et al., 2007). In this study we define an elevated aerosol layer as a verti-cally extended layer situated above the planetary boundary layer, containing aerosol particles. Such long-range trans-port of biomass-burning emissions was previously measured and reported by, for example, Fiebig et al. (2003), Petzold et al. (2007), Real et al. (2007), Tesche et al. (2009), Quen-nehen et al. (2011), Weinzierl et al. (2011) and QuenQuen-nehen et al. (2012). Barnaba et al. (2011) estimate for the 6 year period, 2002–2007, that up to 35 % (maxima in April and in summer) of the aerosol optical thickness of the European fine particle fraction (Dopt< 1 µm) is attributable to wildfire emis-sions, including long-range transport from North America. Based on ten years of ground-based multi-wavelength Ra-man lidar (light detection and ranging) observations, Mattis et al. (2008) observed free-tropospheric aerosol layers above
1In this study, the general term “biomass-burning aerosol” is used if utilized in referenced studies while “forest-fire aerosol” is used for the case treated in this study.
the continental boundary layer of central Europe in 43 % of their measurements, with a maximum from June to August. In 19 % of their measurements, they found forest-fire smoke advected from Canada and anthropogenic pollution advected from urban areas of the USA and Canada.
During transport, the biomass-burning plumes can mix with other aerosols (e.g., Ramanathan and Carmichael, 2008; Tesche et al., 2009; Petzold et al., 2011; Weinzierl et al., 2011). Depending on the composition and altitude, and albedo of the underlying surface, these layers can impact the radiative budget and may have cooling or warming ef-fects on different parts of the atmosphere. In particular, BC in elevated aerosol layers absorbs incoming solar radiation effectively and transforms it into thermal radiation (Moos-müller et al., 2009). In this context, the mixing state of BC-containing particles is important because coatings of light-scattering material can enhance the absorption of the BC core due to the so-called “lensing effect” and can thus amplify the heating potential of BC-containing aerosol particles on the surrounding air (Bauer et al., 2010; Shiraiwa et al., 2010). Enhancements of the absorption by at least 30 % (Schwarz et al., 2008b) up to 100 % have been calculated for thickly coated particles with an optical particle diameter to core di-ameter (Dopt/DrBC)ratio of 2 (Shiraiwa et al., 2010). How-ever, Cappa et al. (2012) report a significant difference in the coatings’ absorption enhancement in ambient observations versus laboratory measurements and model results. Thus, the understanding of the absorption enhancement and the radia-tive forcing by mixed atmospheric BC is still incomplete and needs further investigation. Aside from this idealized inter-nal shell-core mixture of particles, more complex structures of BC particles and BC-free materials exist in nature (e.g., Sedlacek et al., 2012). Semi-external mixtures such as par-ticles attached to each other or near-surface BC cores can be observed in the atmosphere as well (Mishchenko et al., 2004; Liu and Mishchenko, 2007). More information about particle mixing is given in Buseck and Posfai (1999), Posfai et al. (2003), and Posfai et al. (2004).
Although complicated mixing structures are observed in nature, most modeling studies assume homogeneously mixed or idealized core-shell morphologies as a basis for radia-tive transfer calculations. Only some recent model develop-ments implement the particle mixing state (e.g., Aquila et al., 2011). In addition to a changed impact on the radiative aerosol properties, the structure of mixed particles, for ex-ample, internal mixing of a BC core with organic or inor-ganic aerosol components, might have an influence on the activation of BC particles to form cloud droplets in warmer regimes, possibly leading to an increased BC wet deposition and a related decrease in BC residence times. Furthermore, the ice-nucleation efficiency of the particle and thus the as-sociated indirect climate effect of these aerosols may be im-pacted (Hoose and Möhler, 2012).
troposphere (e.g., McMeeking et al., 2010; Schwarz et al., 2010), so far, processes concerning light-absorbing aerosol layers and their impact on the radiation budget are only insufficiently quantified and characterized. One reason for this deficiency is the sparseness of airborne in situ measure-ments in elevated aerosol layers. In this study, we present airborne in situ data of elevated aerosol layers observed with the Deutsches Zentrum für Luft- und Raumfahrt (DLR) re-search aircraft Falcon-20E in the framework of Contrail and Cirrus Experiment 2011 (CONCERT 2011) over central Eu-rope in September 2011 (Voigt et al., 2014). In particular, we focus on the investigation of an elevated forest-fire aerosol layer observed on 16 September 2011 over northeast Ger-many, originating from the Pagami Creek forest-fire in North America.
The present study is organized as follows: in Sect. 2, we give an overview of the CONCERT research flights and de-scribe the instrument calibration and data analysis proce-dures with focus on the SP2. In Sect. 3, we show the results of our measurements in the Pagami Creek forest fire includ-ing a detailed analysis of microphysical and optical aerosol properties, vertical and horizontal extension of the Pagami Creek plume and use dispersion simulations with HYSPLIT for source attribution. In Sect. 4, we compare the observa-tions made on 16 September 2011 with other measurements in elevated aerosol layers during CONCERT 2011 and with the literature. Furthermore, we discuss the morphology and potential disintegration of the observed rBC particles on the basis of our SP2 measurements. Finally, we present an esti-mate on the black carbon mass import into the UTLS by the Pagami Creek fire and compare it with the BC import into the UTLS by aviation.
2 Material and methods
2.1 Research flights and instrumentation
The main focus of the CONCERT 2011 mission, the follow-up mission of CONCERT 2008 (Voigt et al., 2010), was the measurement of microphysical and optical properties of contrail cirrus (Voigt et al., 2011; Schumann et al., 2011a) and natural cirrus in order to investigate their climate im-pact (Kübbeler et al., 2011; Schumann et al., 2013; Jeßberger et al., 2013). Here we focus on the serendipitous obser-vation of an enhanced aerosol layer in the upper tropo-sphere/lower stratosphere (UTLS) region, originating from the Pagami Creek forest fire in Minnesota, USA. During CONCERT 2011, the DLR Falcon research aircraft was based in Oberpfaffenhofen, Germany, and performed 11 re-search flights between 7 September and 30 September 2011. Most of the flights were conducted over Germany, with additional landings in Norway and Italy. Instruments from DLR and the Universities of Mainz and Clermont-Ferrand were operated onboard the DLR Falcon. The following
ba-sic aerosol parameters were measured: particle size distri-bution, rBC mass concentration, rBC core size distridistri-bution, mixing state of rBC-free and rBC-containing particles, light scattering coefficient and light absorption coefficient. In ad-dition, instruments for trace gases were deployed on the Fal-con. Most of them are described in Voigt et al. (2010) and the references therein. In the following, we only describe the instruments used in this study.
In the past decades BC measurements in the atmosphere were conducted predominantly with filter-based instruments. In this study, the more recently introduced Single Parti-cle Soot Photometer (SP2; Stephens et al., 2003) was ap-plied to obtain information about the rBC mass concentration as well as the mixing state and coating thickness of rBC-containing particles. The SP2 determines the optical size and the rBC mass of single rBC-containing particles, using light-scattering and laser-induced incandescence methods, respec-tively (Schwarz et al., 2006). More details about the func-tional principles, calibration and data analysis approaches of the SP2 will be summarized in Sect. 2.2.
To obtain information on the entire aerosol size distribu-tion, measurements from five condensation particle counters (two modified TSI Condensation Particle Counters (CPC; models 3010 and 3760A) and three Condensation Parti-cle Size Analyzers (CPSA; built by DLR) set to different lower cut-off diameters (4 nm, 10 nm, 14 nm)) are combined with optical sizing measurements from the SP2 and a wing-mounted Forward Scattering Spectrometer Probe (FSSP-300). One of the CPCs was operated on 16 September behind a thermal denuder, heating the aerosol to 255◦C to measure
non-volatile particles. Table 1 summarizes the aerosol pa-rameters and the size ranges covered by the different aerosol in situ instruments used in this study.
2.2 Instrument calibration and data analysis
In the SP2, a concentric-nozzle jet system is used to direct the aerosol sample flow through a high-intensity continuous-wave intra-cavity laser beam (λ=1064 nm) and four dif-ferent detectors are used to characterize individual particles with 100 % detection efficiency within the respective tion limits (see Table 1). The response curves of four detec-tors for each particle are recorded for 44 µs with a temporal resolution of 0.2 µs.
Table 1.Size ranges of the aerosol instrumentation onboard the Falcon aircraft considered in this study during the flights on 16 September 2011. The first column displays the name of the instrument, the second column the measured property, and the third column the respective size range. CPC, Condensation Particle Counter; CPSA, Condensation Particle Size Analyzer; SP2, Single Particle Soot Photometer; LSD, light scattering detector; BID, broadband incandescence detector; NID, narrowband incandescence detector; PSD, position sensitive detector; FSSP 300, Forward Scattering Spectrometer Probe.
Instrument Property Size/mass range
CPC/CPSA integral number concentration1of ultrafine particles 0.004 µm< Dopt< Dcutoff
SP2 LSD
single particle optical diameter of rBC-free particles 0.14 µm < Dopt<0.29 µm
ambient number size distribution of rBC-free particles 0.14 µm < Dopt<0.29 µm
BID, NID
single particle rBC mass 0.5 fg< mrBC<80.3 fg
ambient rBC mass size distribution 0.08 µm < DrBC<0.44 µm
LSD, BID, NID, PSD
Leading-edge-only (LEO) fit: single particle optical diameter of rBC-free and rBC-containing particles
∼0.15 µm < Dopt<∼0.55 µm
(cut-offs dependent on rBC fraction) coating thickness of rBC-containing particles
FSSP-300 ambient size distribution2 nominal size range 0.3 µm < Dopt<30 µm
Falcon standard instrumentation
T,p, RH, 3-D-wind velocity
1Aerosol in situ instruments operated inside the cabin of the Falcon behind an isokinetic inlet. The inlet system has an upper cut-off diameterD
cutoffwhere 50 % of the particles are
carried into the isokinetic inlet, depending on air speed and outside pressure. For typical Falcon speed, the cut-off decreases from roughly 2.5 µm at ground level to roughly 1.5 µm at 10 km altitude (Fiebig, 2001; Wendisch et al., 2004).
2Aerosol in situ instruments sampling at wing stations.
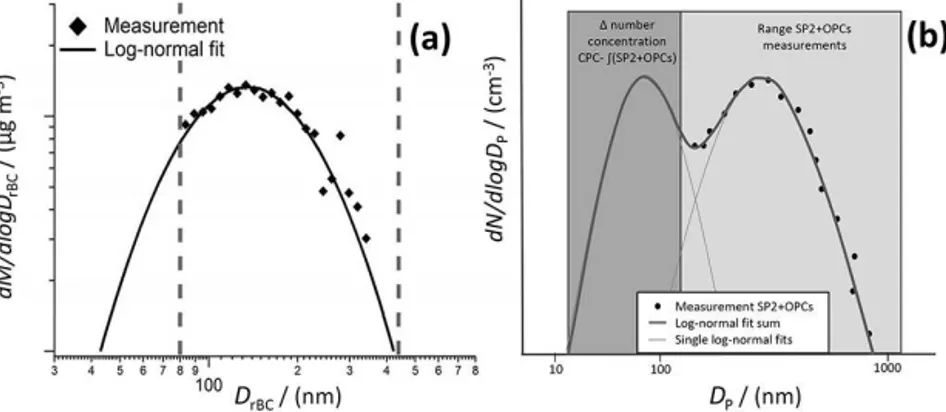
in a particle, independent of particle morphology or coat-ings with non-refractory aerosols components (Schwarz et al., 2006; Moteki and Kondo, 2007, 2010). The BID and NID are empirically calibrated using the fullerene soot batch from Alfa Aesar (stock #40971, lot #FS12S011), which has been shown to provide equal incandescence detector response per mass as atmospheric rBC (Moteki and Kondo, 2010; Laborde et al., 2012a), and which is recommended as the most suit-able SP2 calibration material for atmospheric rBC applica-tions (Baumgardner et al., 2012). The mass equivalent di-ameter of the rBC cores,DrBC, is calculated from the mea-sured rBC mass, assuming void-free spherical rBC cores and an rBC material density of 1800 kg m−3. The applied de-sign of the SP2 and the gain settings used for the CON-CERT 2011 field experiment limit rBC core measurements and the rBC mass size distribution to a range of approx-imately 80 <DrBC< 440 nm (0.5 <mrBC< 80.3 fg; see also Table 1). The contribution of rBC cores outside the detection range of the SP2 to the integral total rBC mass concentra-tion was accounted for by extrapolating the measured rBC mass size distribution with a log-normal fit (see schematic in Fig. 1a). For the CONCERT 2011 data set, the log-normal distribution was fitted to the measured rBC core mass size distribution in the range 80–250 nm (the size range between 250 nm and the upper detection limit was not considered for fitting in order to avoid fitting biases from insufficient count-ing statistics in this size range). This approach provides
re-liable results as the mass size distributions (which are gen-erally of log-normal shape) peak in the measured size range, i.e., the mass median diameter (MMD) falls into the mea-sured size range. In our case, this extrapolation accounts for 20 % of the total rBC mass.
A light scattering detector (LSD) detects elastically scat-tered light at 1064 nm wavelength. The LSD signal is used for the optical sizing of the particles. Assuming rBC as the main light-absorbing component, rBC-free particles, i.e., non-absorbing particles, cross the laser-beam unaltered and the peak amplitude of the LSD signal is proportional to the scattering cross-section of the particle. Certified polystyrene latex (PSL; refractive index=1.59) size standards are used to calibrate the scattering cross-section measurement of the LSD detector as described in Laborde et al. (2012b). The optical size of rBC-free particles is inferred from the mea-sured scattering cross-section, using Mie theory for a homo-geneous sphere and assuming a refractive index of 1.59 (see below). For the SP2 settings used here, the LSD covers a size range of the optical diameters of roughly 140–290 nm (Ta-ble 1).
Figure 1. (a)Scheme illustrating the determination of rBC mass size distributions from SP2 measurements (diamonds) within the SP2 measurement range (between the grey dashed lines) and a log-normal fit (black line). Based on the fit, the total rBC mass concentration can be derived. For details see Sect. 2.2.dM/dlogDrBC: rBC mass size distribution. dN/dlogDp: particle number size distribution.(b)Scheme of the total particle size distributions measured: Dots represent the combined measurements of SP2 and FSSP-300 (accumulation mode; light grey box). The integral number concentration of particles smaller 0.14 µm (Aitken mode; grey box) is derived from the difference of the CPC number concentration to integral number concentration of SP2 and FSSP 300 in the accumulation mode. Log-normal fits are applied to the measured size distribution and extrapolated toward smaller sizes. For details see Sect. 2.2.
sensitive detector (PSD), a modified multi-element LSD, which makes it possible to determine the scattering cross-section of rBC-free- as well as rBC-containing particles at any time (or position) in the laser beam. The approach for the time-resolved scattering cross-section analysis applied here is largely based on Gao’s method, described in detail in Laborde et al. (2012a). The scattering cross-section of the unperturbed particle is obtained from the LSD signal in the leading edge of the laser beam (up to 3 % of maximal laser in-tensity) before the onset of coating evaporation. This is com-monly referred to as the leading-edge-only (LEO) fit method (Gao et al., 2007). The LEO-fit extends the upper detection limit for the optical sizing of rBC-free particles to larger di-ameters, in our case up to around 550 nm (Table 1). Simi-lar to the standard optical sizing (see above), the optical di-ameter of rBC-free particles is inferred from the scattering cross-section measured with the LEO-fit approach assuming a homogeneous sphere and a refractive index of 1.59+0.00i (see below). The uncertainty of the optical sizing associ-ated with uncertainties of the assumed refractive index is about 5 % (± ∼10 nm) for a 200 nm particle and about 8 % (± ∼50 nm) for a 600 nm particle when varying the refrac-tive index from 1.59+0.00i to 1.50+0.00i or 1.70+0.00i. Inferring the optical size of rBC-containing particles from their scattering cross-section is not straightforward as the particles are inhomogeneous and typically not spherical. We use the approach described in Schwarz et al. (2008b) and Laborde et al. (2012b). Briefly, a concentric-spheres core-shell morphology is assumed for the Mie calculations. The core size is constrained by the rBC core mass equivalent di-ameter,DrBC, from the incandescence measurement. To ob-tain the total optical diameter,Dopt, of the unperturbed parti-cle, including core and shell, the diameter of the total particle is varied until the calculated scattering cross-section matches
the measured scattering cross-section. The coating thickness (1Rcoat)of a BC-containing particle is defined as the dif-ference between the radii of the unperturbed particle and the BC core, i.e.,1Rcoat=0.5 (Dopt–DrBC). This provides infor-mation about the mixing state of individual BC-containing particles. In this study, refractive indices of 2.26+1.26i and 1.59+0.00i are used for the rBC core and the coating, re-spectively, in the Mie calculations. The particular value for the refractive index of the BC core was measured by Moteki et al. (2010) for thermally denuded ambient BC particles us-ing an APM (Aerosol Particle Mass Analyzer) and an SP2.
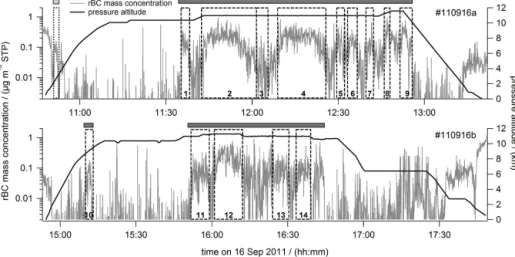
Figure 2.Time series of the rBC mass concentration (STP) in the SP2 size range (grey lines) for flight #110916a (up) and flight #110916b (bottom). The flight altitude is shown in black lines. The grey bars represent the sequences of continuous forest-fire aerosol layer sampling, i.e., the flight time in the area where the Pagami Creek fire aerosol layer was situated. The dashed boxes represent sequences, which are used for detailed analysis. These 14 sequences were chosen to represent parts of the aerosol layer with high and low loads, without interference of other aerosol sources such as aircraft emissions. The region between segment 12 and 13 was excluded because here the mixture of aircraft exhausts and contrails with the Pagami Creek fire plume was sampled.
The aerosol inlet system on the DLR Falcon research air-craft has been extensively tested and successfully used for years. For example, Fiebig (2001) investigated the inlet sys-tem on the Falcon and Schumann et al. (2011b) show the cut-off of the Falcon aircraft inlet and the effect on the derived particle size distribution.
To obtain particle number size distributions in the size range of ∼0.15–30 µm, measurements from the SP2 and the FSSP-300 are combined. To ensure a correct signal-to-diameter assignment for the optical particle counters such as the FSSP-300 (λ=633 nm), an appropriate refractive in-dex has to be applied for the bulk aerosol. Problems with this procedure are explained in more detail in Weinzierl et al. (2009), for example. Real parts of the refractive index at visible wavelengths of several types of organic aerosols and biomass-burning organic aerosol are reported to be be-tween 1.50 and 1.63 and bebe-tween 1.56 and 1.64, respec-tively (Kondo et al., 2011a, and references therein). How-ever, the FSSP-300 cannot distinguish between BC-free and BC-containing particles. Thus, the particles in the consid-ered FSSP-300 size range are assumed to be non-absorbing (the imaginary part of the refractive index is zero), with real parts of the bulk refractive index ranging between 1.59 and 1.60. That increases the uncertainty of the FSSP-300 data compared to the SP2 size distribution, which distin-guishes between BC-containing and BC-free particles. How-ever, due to a low fraction of BC-containing particles in the data set presented later (8–13 %) we expect only minor ef-fects of the refractive index assumption on the inferred par-ticle size distribution. The combination of the FSSP-300 and the SP2 data allows us to derive the particle number size distribution in the size range between about 0.14 µm and
30 µm (Table 1). To obtain information on the size distri-bution in the Aitken mode (Dopt< 0.14 µm) data from the CPC/CPSA is added. The number concentration of Aitken mode particles in the size range between 0.01 µm (lower CPC cut-off) and 0.14 µm (lower SP2 cut-off) is determined as the differential of particles in the accumulation mode, i.e., measured with the SP2 and the FSSP-300 and the integral number concentration determined by the CPC/CPSA. This method is only valid if nucleation mode particles can be excluded. This is ensured by the measurement of particles in the size range 10–14 nm, showing low particle number concentrations (< 260 cm−3). The shape of the particle num-ber size distribution in the Aitken mode range is approxi-mated by applying a log-normal fit, assuming that a single log-normal mode represents all particles in the Aitken mode (Weinzierl et al., 2011) with the particular minimum between Aitken and accumulation mode being operationally defined as 0.14 µm. Figure 1b sketches the procedure for fitting the number size distributions. The parameters for a log-normal fit of modej are the mode number concentration (Nj), the
geometric standard deviation (GSDj), and the count median
FSSP-300. Because no considerable number fraction of par-ticles was measured in the coarse mode, no separate coarse mode fit was applied.
Unless stated otherwise, the data presented in this study refer to standard temperature and pressure (STP; 273.15 K, 1013.25 hPa), corresponding to mixing ratios. STP concen-tration data can be converted to ambient conditions by ap-plying a factorfSTPindicated in Table 2.
To determine the origin and the dispersion of the investi-gated aerosol, we use the Hybrid Single Particle Lagrangian Integrated Trajectory Model HYSPLIT (Draxler and Hess, 1997, 1998). Input for dispersion calculations is the location of the forest fire and the altitude range of the emission. For the HYSPLIT dispersion runs the following assumptions are made: the dispersion is calculated for 0.5◦grid cells for 3 h
time steps. All particles are set to a diameter of 1 µm and a particle density of 1 g cm−3. The particle deposition velocity is assumed to be 0.1 mm s−1for all particles. Wet deposition is not considered for this qualitative approach. HYSPLIT is initialized with meteorological data from the European Cen-tre for Medium-Range Weather Forecasts (ECMWF) and the Global Forecast System (GFS). In this study only the results for the ECMWF data are presented because no relevant dif-ferences are observed for the different meteorological data sets.
3 Results from the measurements in the Pagami Creek forest-fire plume
On 16 September 2011, two flights were performed with the DLR Falcon. For the first flight (#110916a, 10:48–13:20 UTC), the Falcon flew from Oberpfaf-fenhofen (EDMO; 48◦05′N, 11◦16′E, 593 m a.s.l.) to Neubrandenburg-Trollenhagen (ETNU; 53◦36′N, 13◦18′E, 69 m a.s.l.), both in Germany. The second flight (#110916b, 14:54–17:48 UTC) was from Neubrandenburg-Trollenhagen back to Oberpfaffenhofen. The scope of these two flights was to sample contrails from commercial aircraft. To achieve this, the aircraft climbed to more than 10 km altitude and stayed between 10.0 km and 11.8 km for roughly 105 min and 95 min during flights #110916a and #110916b, re-spectively. Figure 2 shows the time series of rBC mass concentration for both flights with elevated rBC mass con-centrations at high altitudes (> 10 km a.s.l.) starting at about 11:45 UTC. Averaged 10 s rBC mass concentrations were observed as high as 0.67 µg m−3 (STP). For comparison, maximum rBC mass concentrations in the polluted boundary layer over Munich, averaged for 10 s, showed similar values with roughly 0.70 µg m−3 (STP) on that day. The observed aerosol layer was visible by eye as distinct broad greyish-brownish aerosol layer (Fig. 3) and covered a large area over northeastern Germany. Figure 4 gives an overview of the horizontal distribution of the aerosol layer during the two flights on 16 September 2011 by means of color-coded rBC
Figure 3.Photograph of the Pagami Creek fire plume taken from DLR Falcon research aircraft over Germany (16 September 2011, 12:11 UTC; 11.1 km a.s.l.).
mass concentrations (size range: 80–440 nm) along the flight track. To emphasize upper tropospheric BC, we show only values for rBC mass concentrations above 9 km a.s.l. In the following we explicitly investigate the chemical, microphys-ical and optmicrophys-ical properties of this vast aerosol layer and we will show that this layer originated from the Pagami Creek fire in North America. In this study we therefore refer to the aerosol layer observed over Germany on 16 September 2011 as Pagami Creek fire aerosol layer or Pagami Creek fire plume. We are aware that the observed layer does not contain the entire emissions of the Pagami Creek fire and smaller layers and plumes might have been transported along other trajectories at other altitudes, which we did not observe and which are consequently not presented in this study.
3.1 Microphysical properties of the observed aerosol layer
To derive particle number size distributions and BC mass dis-tributions and to infer BC particle mixing state, we subdi-vide the measurements in the Pagami Creek fire aerosol layer into sequences with rather homogeneous rBC mass concen-trations. Altogether, 14 time sequences are chosen, as shown in Fig. 2, including sequences with maximum concentrations as well as less concentrated sequences within this heteroge-neous aerosol layer. Aircraft exhaust and contrail sequences, which are characterized by short and distinct increases of par-ticle and trace gas concentrations, are excluded, using NOy and SO2as aircraft plume markers.
3.1.1 rBC mass size distributions
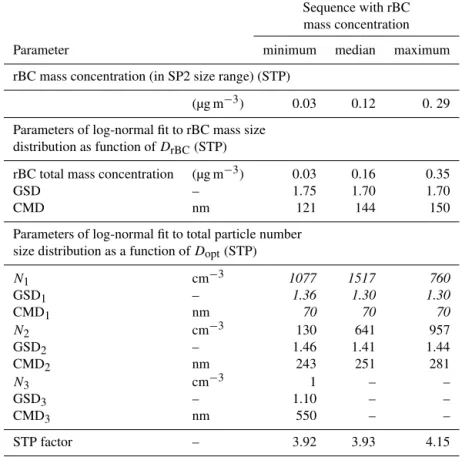
Table 2.rBC characteristics and characteristics of the total particle number size distributions in the Pagami Creek fire plume. Shown are the minimum, median, and maximum values of rBC mass concentrations, the parameters of the log-normal fit to the rBC mass size distribution, the parameters of the log-normal fit to the total number size distribution, and STP-ambient conversion factors of 14 sequences during the forest-fire aerosol layer measurements. Values in italics are extrapolated from total number concentration values. In comparison to the rBC mass concentration in the Pagami Creek fire within the SP2 size range (0.03–0.29 µg m−3) the free tropospheric background sequence has a mean rBC mass concentration of < 0.004 µg m−3. GSD is the geometric standard deviation and CMD, the count median diameter.
Sequence with rBC mass concentration
Parameter minimum median maximum
rBC mass concentration (in SP2 size range) (STP)
(µg m−3) 0.03 0.12 0. 29
Parameters of log-normal fit to rBC mass size distribution as function ofDrBC(STP)
rBC total mass concentration (µg m−3) 0.03 0.16 0.35
GSD – 1.75 1.70 1.70
CMD nm 121 144 150
Parameters of log-normal fit to total particle number size distribution as a function ofDopt(STP)
N1 cm−3 1077 1517 760
GSD1 – 1.36 1.30 1.30
CMD1 nm 70 70 70
N2 cm−3 130 641 957
GSD2 – 1.46 1.41 1.44
CMD2 nm 243 251 281
N3 cm−3 1 – –
GSD3 – 1.10 – –
CMD3 nm 550 – –
STP factor – 3.92 3.93 4.15
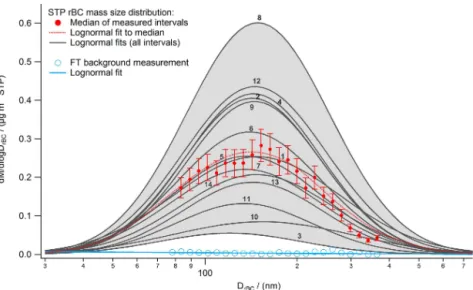
sequences. Error bars represent 15 % uncertainty. The total rBC mass concentration was estimated with adding the ex-trapolated tails (log-normal fit to the measurements) of the rBC mass size distribution to the rBC measurement of the SP2 integrated over the whole detection range (see Sect. 2.2 for details). The tails of the size distribution consistently con-tributed∼20 % to the total estimated rBC mass for each of the 14 plume sequences. Due to a higher fraction of fresh and small rBC-particles and possibly even an extra mode of small rBC particles not captured by the log-normal fit-ting, the determined rBC mass fraction might be lower in the boundary layer, implying a potential systematic uncer-tainty for the comparison of the determined total rBC mass of the Pagami Creek fire plume and the boundary layer. How-ever, with increasing age the mode of small rBC particles shifts to larger sizes, therefore we expect the log-normal fit to capture the total mass fairly well. The mass median di-ameter (MMD), which is equal to the modal didi-ameter for a log-normal size distribution, of all mass size distributions of the Pagami Creek fire plume is in the size range of 120 to 160 nm. The total rBC mass concentrations for the 14
se-quences (0.03–0.35 µg m3; STP) reveal a variability factor of approximately 10. A UTLS background sequence at the same altitude as the Pagami Creek fire plume shows rBC average total mass concentrations < 0.01 µg m−3(STP), implying the Pagami Creek fire plume contains a factor of 3–34 higher rBC mass concentrations than the background air. Parame-ters of the log-normal fit to the rBC mass size distribution (STP) and the total rBC mass concentrations derived from the log-normal fit (STP) are shown in Table 2.
3.1.2 Total particle number size distributions
Figure 4.Flight tracks for flight #110916a (left) and #110916b (right) on 16 September 2011 with averaged (10 s) rBC mass concentrations (STP) color-coded along the flight track. For clarity, only data for altitudes above 9 km a.s.l. and rBC mass concentrations > 0.01 µg m−3are shown.
concentration (N1) is directly inferred from the measure-ments (see Sect. 2.2), while CMD1has to be assumed and GSD1 is iteratively approximated. The minimum and the maximum values ofN1for all 14 sequences are 760 cm−3 and 2228 cm−3, respectively. The total number concentra-tions in the measured size range (accumulation mode) vary roughly by a factor of 7 within the 14 sequences as an in-dication of a heterogeneous distribution within the vertical column. In the accumulation mode the total number concen-trations are factors of 14–100 times higher compared to the UTLS background sequence.
3.1.3 Coating thickness
Besides the size distribution information of aerosol layers, the mixing state of individual particles plays an important role in atmospheric processes. As described in Sect. 2.2, the coating thickness of individual particles inferred from the SP2 measurements delivers information about the mix-ing state of individual particles. Figure 7a shows normal-ized histograms of the observed coating thickness of all BC-containing particles with BC cores in two size ranges (DrBC=140–160 nm,DrBC=180–220 nm) for the 14 dif-ferent sequences in the Pagami Creek fire plume. These two size ranges are chosen as examples to test if the coating thickness (1Rcoat)varies with changing BC core size. The coating thickness of individual aerosol particles from the Pagami Creek fire aerosol layer ranges from1Rcoat=20 nm up to the upper detection limit of∼180 nm, in both BC core
size ranges shown, with a flat maximum between∼80 nm and 160 nm (saturated signals originating from particles with coatings thicker than 180 nm were also frequently observed). The small number of BC cores with coatings below 20 nm observed within the Pagami Creek fire plume is likely from UTLS background particles and/or aircraft emissions. The observed coating thickness distributions are very similar for all 14 sequences, indicating very homogeneous BC particle properties across the different plume areas.
For comparison, the BC particles observed in the bound-ary layer in the regions of Neubrandenburg and Munich are thinly coated and show median coating thicknesses of < 20 nm with the majority (75 %) showing coating thick-nesses of < 65 nm. Thus the particles in the observed Pagami Creek fire aerosol layer exhibit much larger coating thick-nesses than younger aerosol particle populations such as the planetary boundary layer (PBL) aerosol. The negative coat-ing thickness values measured for some particles (Fig. 7a) are caused by random noise and potential systematic biases resulting from the assumptions made about the refractive in-dices and particle shape. The systematic uncertainty for the coating thickness is assessed to be <±20 nm.
Figure 5.Median rBC mass size distribution (red dots) out of the 14 measurement sequences (see Fig. 2) in the Pagami Creek fire plume. Log-normal fits (solid lines) are shown for all sequences for the measured size range of 80–250 nm. The grey shaded area represents the range between maximum and minimum log-normal fit. The mean total rBC mass concentration (accounting for the data outside the SP2 range) is 0.03–0.35 µg m−3(STP) for the 14 sequences in the forest-fire layer, indicated by the numbering. Error bars represent 15 % uncertainty (see Sect. 2.2). For comparison the rBC mass of a free tropospheric (FT) background sequence (blue) is shown.
Figure 6.Number size distributions (STP) for background aerosol (blue markers), minimum (orange markers), median (red markers), maximum (dark red markers), and range (light grey area) of mea-surements in the Pagami Creek fire plume. Number size distribu-tions are extrapolated by log-normal fits for the minimum, median, maximum, and background measurements (orange, red, dark red, and blue solid lines), and compared to forest-fire plumes (dashed lines) from LACE 98 (purple) as ambient values, ICARTT ITOP (International Consortium for Atmospheric Research on Trans-port and Transformation, Intercontinental TransTrans-port of Pollution; light green), SAMUM-2 (Saharan Mineral Dust Experiment; dark green), and SAFARI 2000 (Southern African Regional Science Ini-tiative; black). Normalized values from SAFARI 2000, showing only the accumulation mode due to a lack of measurements for par-ticle sizes < 100 nm, are scaled to similar magnitudes.
thickness values up to the detection limit, which are as high as 1Rcoat≈240 nm for core sizes DrBC≤100 nm, are ob-served for all core sizes. The distribution of coating thickness values is similarly broad for all BC core sizes, but particles
with thin coatings (1Rcoat≤40 nm) are always a negligi-ble fraction. The median coating thickness is1Rcoat≈105– 136 nm for the 14 flight sequences independent of BC core size (note, the median coating thickness values for BC core sizesDrBC< 90 nm and > 170 nm are likely biased by detec-tion limit effects). This translates to median shell / core diam-eter ratios ofDopt/DrBC=3.7, 2.8 and 2.4 atDrBC=90 nm, 130 nm and 170 nm, respectively, while the highest observed values are as high asDopt/DrBC=7.4 atDrBC80 nm.
3.2 Estimates on the dimension and classification of the observed aerosol layer
Figure 7. (a)Histograms of the coating thickness for 14 sequences (see Fig. 2) inside the Pagami Creek fire aerosol layer (red) and for fresh boundary layer aerosols in Oberpfaffenhofen, near Munich, and Neubrandenburg in black and blue, respectively, for rBC cores sizes of 140–160 nm (intense color) and 180–220 nm (light color).(b)The relationship between rBC core diameter and coating thickness for all 14 sequences in the forest-fire aerosol layer is shown as color-coded 2-D histogram including the median coating thickness (black line). The methodological boundaries are indicated by grey lines (a: rBC core below BID lower detection limit; b: scattering signal below LSD lower detection limit; c: scattering signal above LSD higher detection limit).
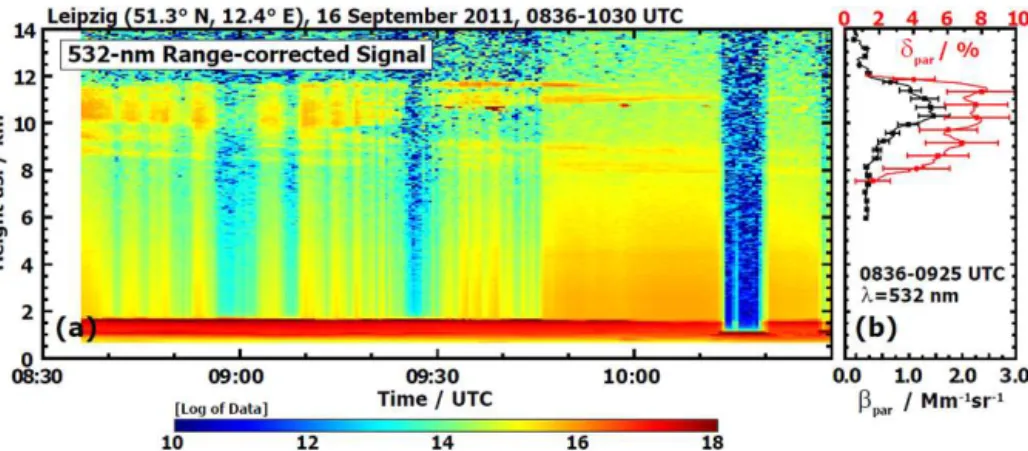
12 km a.s.l. A humid layer was present below 1.5 km alti-tude, which causes the vertically striped pattern in the signal of the forest-fire plume in the UTLS due to partial attenua-tion of the laser light by thin clouds or haze. The base of the heterogeneously-layered Pagami Creek fire plume slowly de-scended with time. In the course of the late morning around 10:30 UTC the layer diminished above Leipzig. The time-resolved lidar profiles strongly confirm our observations, showing the maximum of the plume between 10.0 km and 11.5 km a.s.l. and an upper limit at roughly 12 km. At the time of the Falcon flyover (15:43 UTC) in Leipzig, neither the DLR Falcon nor the lidar observed signatures of the plume. In agreement with the lidar and in situ observations, the spaceborne lidar CALIPSO (not shown2) observed the Pagami Creek fire plume on 16 September 2011 at about 10– 12 km altitude over Europe.
The vertical profiles of particle backscatter coefficientβpar and particle linear depolarization ratioδparare presented in Fig. 9b based on the averaged 532 nm elastic backscatter sig-nal of the time period from 08:36–09:25 UTC. Sequences strongly affected by the low-level clouds are removed from the analysis to increase the signal-to-noise ratio. Because no Raman-scattering information is available, the lidar data analysis is performed using the Klett–Fernald method (Klett, 1981; Fernald, 1984). This requires the assumption of the extinction-to-backscatter ratio (lidar ratio). Because earlier studies (Tesche et al., 2011; Groß et al., 2013) show that a lidar ratio of 70 sr is reasonable for biomass-burning aerosol, we use this value for the analysis of the lidar data. Uncer-tainties in the retrieved optical properties are due to noise and the assumption of the lidar ratio (Rocadenbosch et al., 2010). Particle linear depolarization ratios of around 6–8 % at 532 nm are observed throughout the Pagami Creek fire
2See http://www-calipso.larc.nasa.gov/products/lidar/browse_ images/show_date.php?s=production&v=V3-01&browse_date= 2011-09-16.
Figure 8.Vertical profiles (STP) of flight #110916a (left) and #110916b (right) on 16 September 2011 for rBC mass concentration measured with the SP2 as median (black lines), 25th/75th percentile (dark grey shading), and 10th/90th percentile (light grey shading) for 100 m vertical intervals. Below 2000 m the data set is split into the PBL of Oberpfaffenhofen (593 m a.s.l.; dashed line) and Neubrandenburg (69 m a.s.l.; dotted line). Values are representative for the approximate size range of 80–440 nm for the rBC particles.
Figure 9. (a) Time-height cross-section of the 532 nm range-corrected backscatter signal of the lidar system in Leipzig and(b)vertical profiles of particle backscatter coefficientβpar(black curve) and particle depolarization ratioδparwith error bars (red curve) for the time interval 08:36–09:25 UTC. The optical thickness (at 532 nm) of the observed aerosol layer is derived to be 0.15–0.20.
the range of previous findings for biomass-burning aerosol layers, but higher than the median, of Weinzierl et al. (2011).
3.3 Identification of the Pagami Creek forest fire as the source of the observed aerosol layer
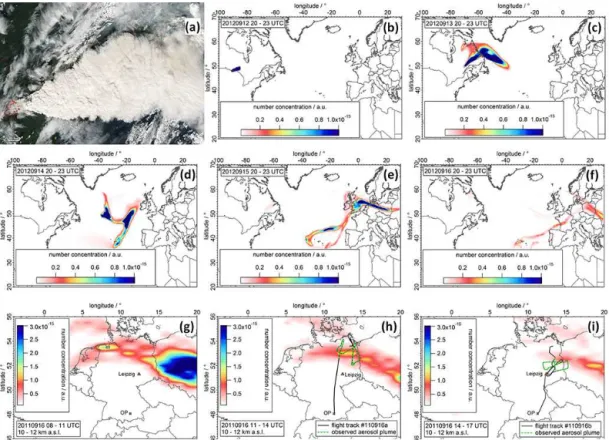
Figure 10a shows a true-color image of the Pagami Creek fire located in Minnesota, USA (approximate location 47◦52′N, 91◦30′W; US Forest Service), taken by the Moderate
Reso-lution Imaging Spectroradiometer (MODIS) on 12 Septem-ber 2011 at 18:50 UTC. This fire was caused by lightning on 18 August 2011. Before 12 September the fire did not evolve significantly and thus caused only minor pollution ac-cording to the MODIS images. On 12 September 2011 the fire grew rapidly exhibiting a thick plume, which is trans-ported eastwards (Fig. 10a). The Pagami Creek fire burned a total area of roughly 375 km2. A cloud-top 11.0 µm bright-ness temperature of roughly −60◦C, corresponding to alti-tudes > 11 km, was observed with MODIS, which is
To show that the aerosol plumes observed by the Fal-con over Germany on 16 September originated from the Pagami Creek fire, we conduct HYSPLIT dispersion calcula-tions starting at the location of the Pagami Creek fire. Based on the described observations, we assume that the Pagami Creek fire released emissions for 12 h between 17:00 UTC on 12 September 2011 and 05:00 UTC on 13 September 2011 as a maximum estimate. The release location is re-trieved from satellite images and the release altitude is set from ground to 11 km a.g.l., assuming pyro-convention (e.g., Fromm et al., 2005; Damoah et al., 2006) and a homoge-neous vertical distribution. Results are presented in Fig. 10b– f, which show the column-integrated (6–14 km a.s.l.) particle number concentration (arbitrary units; a.u.) in the time from 20:00–23:00 UTC between 12 September and 16 Septem-ber 2011. The calculations underline that the Pagami Creek fire plume was transported through the area and at the al-titude where the aerosol layer has been measured by the Falcon and the lidar in Leipzig. According to those simula-tions the Pagami Creek fire plume should have reached Ger-many on 15 September 2011 (Fig. 10e). A detailed analysis of the simulation results suggests that the smoke layer was north of Leipzig on 15 September, explaining why the lidar in Leipzig did not detect the Pagami Creek fire plume on that day. Figure 10g–h show zoomed-in dispersion calcula-tions of column-integrated (10–12 km a.s.l.) particle number concentrations on 16 September 2011 for central Europe for the time between 08:00–11:00 UTC (g), 11:00–14:00 UTC (h) and 14:00–17:00 UTC (i). Figure 10h and i addition-ally include the Falcon flight tracks of flight #110916a (10:48–13:20 UTC) and #110916b (14:54–17:48 UTC), re-spectively. Comparing the location of the measured plume and the plume location simulated by the dispersion calcu-lations strongly suggest that the Pagami Creek fire is most likely the source of the observed aerosol layer. This is also supported by observations of CO, a tracer for biomass burn-ing, by the Infrared Atmospheric Sounding Interferometer (IASI) and by data of the GOME-2 Absorbing Aerosol In-dex (not shown; http://www.temis.nl) (de Graaf et al., 2005), both showing the same transportation pattern of the plume as the dispersion calculations. According to the simulations shown in Fig. 10g–i, it seems that the measurements with the Falcon aircraft captured the tail of the plume when the max-imum had already passed Germany, although for the plume position an uncertainty of 5–20 % must be assumed. This un-certainty is also in agreement with the lidar measurements, which show that the Pagami Creek fire aerosol layer was ob-served until 10:30 UTC (Fig. 9), while the dispersion calcu-lations suggest that in the time from 08:00–11:00 UTC the aerosol layer had already passed Leipzig (Fig. 10g).
4 Discussion
4.1 Comparison of the measurements in the Pagami Creek fire plume with other measurements during CONCERT 2011
Although the localization and observation of elevated aerosol layers was not a scientific objective of the CONCERT 2011 field experiment, in 9 of the 11 flights elevated aerosol lay-ers, including the Pagami Creek fire plume, were observed. From about 32.3 h total flight time we flew by chance roughly 3.2 h (∼10 % of the flight time) within elevated aerosol lay-ers (volcanic ash laylay-ers, which we intentionally measured, are not counted here). Table 3 gives an overview of all CON-CERT 2011 flights, including the altitude of the detected aerosol layers. As can be seen from Table 3, most of the aerosol layers were found between 2 km and 5 km altitude with rBC mass concentrations of 2–425 ng m−3(size range: 80 <DrBC< 440 nm). Figure 11 shows the median vertical profile of the rBC mass concentration and the rBC mass mixing ratio for the entire CONCERT 2011 field experi-ment, i.e., for all 11 research flights, with a 500 m vertical resolution and a temporal resolution of 10 s. This tempo-ral resolution is used with consideration of the trade-off be-tween reducing the noise from insufficient integration time and retaining sufficient horizontal resolution of about 2 km. The rBC mass mixing ratio (MMR) is calculated from the mass concentrationmat standard conditions and the density of dry air at standard conditions (ρ0=1.29 kg m−3): MMR [ng kg−1]=mSTP[ng m−3] /ρ0[kg m−3]. The median verti-cal distribution can be used as an approximation of the typ-ical verttyp-ical profile of BC above central Europe during au-tumn 2011. Below roughly 2 km altitude the vertical profile is dominated by the influence of the boundary layer: we see the highest MMR, a small spread between 10th/90th percentiles and a decreasing rBC MMR with increasing altitude. Above 2 km the signal is dominated by the wide spread of the per-centile values, showing high variability in rBC mixing ratios above the boundary layer. This variability can be attributed to the presence of aerosol layers as a source of heterogeneous aerosol loadings in the free troposphere. The highest vari-ability is found above 10 km altitude (Figs. 8 and 11). The greatly increased 75th and 90th percentile values at this alti-tude are related to the high loadings detected in the Pagami Creek fire plume.
4.2 Comparison with previous studies from literature 4.2.1 rBC mass concentrations and rBC size
distributions
Figure 10.Evolution and dispersion of the Pagami Creek fire plume calculated with HYSPLIT.(a)MODIS picture of Pagami Creek fire in Minnesota, USA on 12 September 2011, 18:50 UTC (NASA images courtesy Jeff Schmaltz, MODIS Rapid Response Team at NASA GSFC. Caption by Michon Scott.);(b–f)Daily evolution of the plume vertically integrated from 6–14 km from 12 September 2011 through to 16
September 2011 for time period 20–23 UTC on each day;(g–i)dispersion of the plume over Germany vertically integrated from 10–12 km
for the 16 September 2011,(g): 08:00–11:00 UTC,(h): 11:00–14:00 UTC and(i): 14:00–17:00 UTC and locations of Oberpfaffenhofen (OP; star) and Leipzig (triangle). Green dashed lines in(h)and(i)represent the sequences where the Pagami Creek fire plume was measured.
comparable with the STP rBC mass concentration in the PBL over Neubrandenburg-Trollenhagen (0.11 µg m−3 and 0.05 µg m−3; STP) and Oberpfaffenhofen (0.38 µg m−3and 0.96 µg m−3; STP) on that day but far larger than the back-ground concentration (< 0.01 µg m−3; STP) at the same al-titude as the plume. Oberpfaffenhofen is located near the metropolitan area of Munich. Therefore these values are rep-resentative of a polluted PBL. To put the results of the ob-served Pagami Creek fire plumes in context to the litera-ture and to other typically expected BC-containing aerosol types, several papers are chosen: biomass-burning plumes from Wyoming (Pratt et al., 2011), biomass burning from North America and Asia (Kondo et al., 2011a), biomass-burning and anthropogenic emissions from California (Sahu et al., 2012), biomass-burning and urban emissions from Texas (Schwarz et al., 2008a) and urban emissions from Cali-fornia (Metcalf et al., 2012). In 12–24 h-old biomass-burning plumes at altitudes from ground to roughly 5 km Kondo et al. (2011a) measured the highest rBC mass concentration in smoldering burning events (0.27 µg m−3–1.24 µg m−3; STP). Sahu et al. (2012) observed rBC mass concentrations of 0.50±0.17 µg m−3(STP), while Pratt et al. (2011) reported
Table 3.List of research flights during CONCERT 2011. The lower and upper boundary∗of the detected aerosol layers is given for each flight. The Pagami Creek fire plume is written in bold type. OP, Oberpfaffenhofen; NB, Neubrandenburg-Trollenhagen; TRA, Temporary Restricted Area.
Flight ID Route Take-off Landing Presence of elevated layers Average rBC mass time/UTC time/UTC concentration in the
Lower Upper measured SP2 size range boundary/km boundary/km between 80 <DrBC< 440 nm
hh:mm hh:mm (STP)/ng m−3
#110907a OP – Leipzig – OP 06:21 07:53
2.6 3.0 2.3
3.7 5.3 3.1
3.4 3.9 2.7
2.0 3.2 2.0
10.1 10.7 107.6
#110916a OP – Mecklenburg – NB 10:48 13:20
1.8 2.0 17.3
2.2 3.4 89.6
3.4 4.5 32.4
10.1 11.6 27.6–294.2
#110916b NB – Leipzig – OP 14:54 17:48
2.0 3.3 74.3
8.7 9.5 42.1
10.9 11.3 64.1–214.9
#110917a OP – Hamburg – Brandenburg – OP 11:05 13:54
2.2 3.0 75.8
3.0 4.3 54.6
4.6 5.7 5.9
2.1 3.6 105.3
#110922a OP – Frankfurt – Bergen 07:03 09:18
4.7 5.4 424.8
#110922b Bergen – OP 10:20 13:20
6.5 6.9 155.4
#110924a OP – TRA Weser – OP 09:44 13:12
1.7 2.7 94.3
3.1 4.6 11.0
1.8 4.9 6.7
#110927a OP – TRA Weser – OP 06:57 10:27
1.5 2.7 131.4
2.7 4.6 12.3
#110929a OP – Catania 08:52 12:19
3.3 3.3 17.3
#110930a Catania – Stromboli – Etna – Catania 06:34 09:34
0.4 2.2 231.3
0.9 0.9 267.2
3.5 3.5 4.1
3.0 3.0 4.8
#110930b Catania – OP 10:55 14:45
2.0 3.3 9.7
Figure 11. Vertical profile (STP) of the rBC mass mixing ratio (MMR) and rBC mass concentration (M) for all flights during CON-CERT 2011 measured with the SP2 as median (black), 25th/75th percentile (dark grey), and 10th/90th percentile (light grey) for 500 m vertical intervals and a temporal resolution of 10 s. Values are valid for the approximate size range of 80–440 nm. The mass
mixing ratio MMR was calculated from the mass concentrationm
(MMR [ng kg−1]=m [ng m−3]/1.29 [kg m−3]).
biomass-burning plumes (age < 1 day, origin: North Amer-ica) and between 176 nm and 238 nm in aged biomass-burning plumes (age: 2–3 days, origin: Asia). MMDs in biomass-burning plumes observed at altitudes between 0 km and 3.5 km a.g.l. in California by Sahu et al. (2012) are 193±16 nm. Schwarz et al. (2008a) observed MMDs of roughly 160–180 nm for urban emissions and roughly 200–220 nm for biomass-burning aerosol, while Metcalf et al. (2012) observed modes of roughly 120–140 nm for boundary layer aerosol and roughly 160 nm for free-tropospheric aerosol during airborne measurements in the Los Angeles Basin. Moteki et al. (2012) and Oshima et al. (2012) describe the wet removal of rBC during transport. A size-dependent wet removal (Moteki et al., 2012) can shift the MMD of aged BC layers towards smaller particle sizes and might cause differences in observed MMDs for BC par-ticle populations with varying exposure to wet removal con-ditions during the transport as potential reason for the ob-served differences. They obob-served, for instance, a decrease from 127 nm to 97 nm with decreasing transport efficiency for the count median diameter.
Pratt et al. (2011) observed with their SP2 average BC mass fractions of 0.3–34 % in fresh biomass-burning plumes with the largest part of the mass (60–90 %) being non-refractory organic material. Comparably high mass fractions of organic material are also reported by Kondo et al. (2011a) who find an organic fraction of 56–92 % and a BC mass
frac-tion of 1.7–4.9 %. The values from Kondo et al. (2011a) are comparable to findings from Sahu et al. (2012) presenting < 5 % BC mass fractions. The higher amount of OC com-pared to BC can be explained by emission factors, which are 0.2 g BC and 7.8 g OC per kg burned mass for boreal conif-erous forests (McMeeking, 2008; Wiedinmyer et al., 2011). In our study, the volume fraction for rBC-containing parti-cles derived from the SP2 for the 14 considered sequences is 2.5–3.9 % in the described size range. No measurements of organic material were performed but we have to assume that in our case OC is also a major constituent in terms of mass fraction.
4.2.2 Total particle number size distributions
Figure 12.SP2 raw signals for selective particles with LSD signal (black) and BID signal (blue) and the scattering cross-section (red) for (a)– an rBC-free particle,(b)– a coated rBC particle and(c)– a disintegrating rBC particle. Schematics for the particle–laser interaction for each raw signal plot are shown on the left. For the disintegrating rBC particle in(c)several initial structures are possible: a very thickly coated rBC particle (top); a thickly coated particle with an eccentrically located rBC core (middle); an rBC particle located at the surface of an rBC-free particle (bottom). For depiction purposes the size of the schematically-shown particles (left) is enlarged compared to the laser diameter. The scattering cross-section was obtained by dividing the scattering signal by the laser intensity profile. The incandescence is indicated by yellow stars.
Results from SAFARI 2000 show only the accumulation mode since no measurements or extrapolations for particles < 100 nm were performed. Furthermore, the SAFARI 2000 size distribution was scaled to quantities found in our and other studies, since in Haywood et al. (2003) the size distri-bution is given as a normalized distridistri-bution. In summary, our observations are similar to biomass-burning number size dis-tributions observed previously, especially for ICARTT-ITOP and LACE 98, indicating similar origins, source material, en-vironmental and burning conditions or transportation. The aerosol layers often show similar modes in the accumulation mode size range. Thus, a dominant accumulation mode and a relatively large modal diameter (∼200–400 nm) seem to be common features of forest-fire aerosols.
4.2.3 Coating thickness
the BC particles from forest fires in all three studies dis-cussed here are substantial. This is in contrast to BC particles emitted from diesel engines and wood burning for residential heating, which emit particles with very little and moderate coatings, respectively, and also the median coating thickness observed in aged aerosols typically remains clearly below 100 nm (Laborde et al., 2013, and references therein).
4.3 Morphology and disintegration of black carbon particles
The interaction of BC-containing particles with solar radi-ation depends on their morphology and mixing state with light-scattering aerosol components (Kahnert et al., 2012). The coating thickness values reported in the previous sec-tion were inferred assuming a concentric-spheres, core-shell morphology for the BC core and a purely scattering coating. However, the BC cores of combustion particles are fractal-like or compact aggregates and the BC can be mixed with light-scattering material in different ways, including, e.g., surface contact of the BC with the scattering components, full immersion of the BC in the scattering component or im-mersion of the scattering components in the BC aggregate (Scarnato et al., 2013). Previous laboratory and field exper-iments have shown that the SP2 signals of BC-containing particles can sometimes give indirect evidence of how the BC core is mixed with the scattering components beyond just quantifying the coating thickness (Sedlacek et al., 2012; Moteki and Kondo, 2007).
Figure 12 schematically shows the particle–laser interac-tion of different particle types and the corresponding SP2 sig-nals including the time-resolved scattering cross-section as inferred from the raw LSD signal, according to the method described in Laborde et al. (2012a). For BC-free particles (Fig. 12a) the LSD signal usually follows an almost Gaussian shape. The LSD signal is directly proportional to the laser intensity profile along the flight path of the particle through the laser beam, because the size and thus also the scattering cross-section of a non-absorbing particle remains unchanged during laser transition. The maximum of the LSD signal from BC-free particles occurs at the center of the laser beam (here at time 26 µs; Fig. 12a).
In contrast, the size of a BC-containing particle is re-duced during laser transition, first through evaporation of non-refractory coating material followed by evaporation of BC, which has a higher boiling point. Figure 12b shows typ-ical SP2 signals of BC-containing particles with a medium-thick coating. The LSD responds with an increasing signal when the particle enters the laser beam and scatters the laser light with a constant scattering cross-section. Traveling fur-ther into the laser beam, the BC core absorbs the laser radia-tion and heats up. As a consequence, the coating evaporates and causes a decrease in the scattering cross-section. This of-ten results in a first local maximum of the LSD signal (here at time 21 µs; Fig. 12b). After complete evaporation of the
coat-ing, the scattering cross-section of the particle stabilizes for a short time and the LSD signal raises again, because the laser intensity increases still (time range 22–23 µs; Fig. 12b). The BC core heats up further, until it reaches the boiling point of BC. The thermal radiation, emitted by the particle and de-tected by the incandescence detectors, now reaches its max-imum (here at time 24 µs; Fig. 12b), and the BC core evapo-rates, resulting in a fast decrease of the BC mass and thus also the scattering cross-section of the residual particle, which is reflected in a fast decrease of the BID and LSD signals, re-spectively. Consequently, the LSD signal can have a second local maximum around the peak of the BID signal (here at time 23 µs; Fig. 12b). This second local maximum is typi-cally higher than the first local maximum of the LSD signal for BC particles with a thin or medium coating, such that the global maximum of the LSD signal occurs at about the same time as the peak of the BID signal. For thickly coated BC par-ticles, the first local maximum of the LSD signal is typically higher than the second local maximum, such that the global maximum occurs before the peak of the BID signal. Moteki and Kondo (2007) have shown that the time lag between the peaks of the LSD and the BID signals gives crude informa-tion about the mixing state of BC-containing particles, where values >∼2 µs are associated with thick coatings, while val-ues <∼2 µs are associated with thin to medium coatings.
becomes negative as the peak of the BID signal normally oc-curs before the center of the laser beam.
Sedlacek et al. (2012) have reported, for the first time, the identification of disintegrating particles through negative lag times. However, in our study, only a minor fraction of all disintegrating particles could be identified via a negative lag time because most of the disintegrating particles either exhib-ited a positive lag time or because the peak of the LSD signal, and with that, also the lag time, were not defined due to LSD detector saturation. Therefore, the time-dependent (position-dependent) scattering cross-section, as inferred from the raw LSD signal, according to the method described in Laborde et al. (2012a), was used here to identify disintegrating par-ticles. Specifically, the scattering cross-section measured in the trailing edge of the laser beam (at the position with 3 % of the maximum laser power) was used to determine for all BC-containing particles whether a detectable BC-free frag-ment (producing an LSD signal above background noise) re-mained left in the trailing edge of the laser beam. The scat-tering cross-section measured in the leading edge of the laser beam (at the position with 3 % of the maximum laser power) was used to determine the size of the undisturbed particles, in order to further investigate the influence of particle size on disintegration. The relation of the scattering cross-section at the leading edge and at the trailing edge of the laser beam for BC-containing particles is shown Fig. 13a for a sequence measured in the Pagami Creek fire plume (11:36–11:46 UTC, 16 September 2011). The trailing edge LSD signal indicates that about 50 % of the BC-containing particles in the plume with particle size of aboutDopt=300 nm disintegrated in the laser beam, leaving a detectable BC-free fragment. The frac-tion of disintegrating particles increased with increasing par-ticle size, so that > 90 % of the BC parpar-ticles disintegrated at large sizes (Dopt>∼480 nm). Conversely, the majority of the smaller particles (Dopt<∼300 nm) showed no disintegration characteristics. However it cannot be distinguished if they actually evaporated completely or if potential BC-free frag-ments just remained below the detection limit of the LSD. Overall ∼40–50 % of all detected BC-containing particles were identified as disintegrating particles with the trailing edge LSD-signal method. Data points shown in Fig. 13a re-maining on or above the 1:1 line are attributable to the co-incidence of a BC-free and a BC-containing particle, marked by the grey pattern. However, coincidence accounts for only a very low fraction of the data points.
Only 3.5–6.8 % (median: 4.6 %) of all BC particles, cor-responding to roughly 5–20 % of all identified disintegrating BC particles, exhibited a negative lag time in this study. This shows that the lag-time method only provides a lower limit for the total fraction of disintegrating particles. The success rate of the lag-time method for the identification of disinte-grating particles depends on particle and instrument proper-ties such as, e.g., the particle size and the saturation level of the LSD.
Figure 13. (a)Relation of the scattering cross-section at the leading edge and at the trailing edge of the laser beam for BC-containing particles (dots; color-coded forDopt determined by the LEO-fit approach) with median (solid black line), 25th/75th percentiles (dashed black lines) and 10th/90th percentiles (dotted black lines) shown for a sequence measured in the Pagami Creek fire plume (11:36–11:46 UTC, 16 September 2011). The grey bar represents the detection limit of the LSD while the grey pattern indicates the range where the data points are attributable to coincidence of BC-free and BC-containing particles in the laser beam (black line: 1: 1-line). Particles with scattering cross-section at the trailing edge of the laser beam remaining above the detection limit of the LSD in-dicate the disintegration of BC-containing particles.(b)Fraction of disintegrating particles to all rBC-containing particles as function of their coating thickness for the same sequence as in(a).
Sedlacek et al. (2012) observed disintegrating particles during a ground-based field campaign in summer 2011. More than 60 % of BC-containing particles in the forest-fire aerosol plume from several wildfires east of Lake Winnipeg and into western Ontario on 30 July were disintegrating BC particles, exhibiting negative lag times in the SP2. Our observations show for the first time the occurrence of disintegrating BC particles in high-altitude BC layers (40–50 % of all detected BC-containing particles, according to the trailing-edge LSD signal method).
where the BC is located near or at the surface of the BC-containing particles. Moteki and Kondo (2007) also reported the occurrence of disintegrating particles in laboratory ex-periments with graphitic cores that were coated with glyc-erol or oleic acid. The number fraction of disintegrating par-ticles was mainly a function of overall particle diameter. No disintegration was observed for small sizes, while almost all larger particles disintegrated. The threshold particle diameter for the occurrence of disintegration was 450–600 nm depend-ing on the coatdepend-ing type. Moteki and Kondo (2007) speculated that disintegration might be associated with eccentrically po-sitioned BC cores in their case, while near-surface BC mor-phology was not expected based on the process applied to coat the BC cores.
The specific BC particle morphology, i.e., core-shell ver-sus near-surface BC, is relevant because the light-absorption efficiency enhancement effect by light-scattering coatings internally mixed with BC depends on the coating vol-ume fraction as well as the particle morphology. Coat-ings with Dopt/DrBC-ratios of 2 can already enhance the light-absorption by the BC cores by 100 % (Schwarz et al., 2008b; Shiraiwa et al., 2010), while the relation between the coating thickness and the enhancement factor is not linear and saturation occurs above a certain threshold. The high
Dopt/DrBCratios observed in the Pagami Creek fire plume imply that substantial light-absorption enhancement effects are expected, though large uncertainties of this effect re-main (e.g., Cappa et al., 2012). Sketches of three conceivable morphologies of disintegrating BC-containing particles are shown on the left side of Fig. 12c: a concentric core-shell, an eccentric core-shell or a near-surface BC/attached BC mor-phology. Light-scattering matter simply attached to a BC core causes very little enhancement of the light-absorption efficiency (Liu and Mishchenko, 2007; Scarnato et al., 2013). In contrast, a substantial light-absorption efficiency enhance-ment can be expected for coated BC-containing particles with a concentrically or eccentrically positioned core.
We note here that disintegrating particles might also com-plicate the interpretation of the Soot-Particle Aerosol Mass Spectrometer (SP-AMS; Onasch et al., 2012) measurements because the BC-free fragment would not be evaporated by the laser. This should be further investigated with specific laboratory experiments involving biomass-burning aerosol and the SP-AMS.
A process that can produce near-surface BC morphologies is coagulation of almost bare BC aggregates with BC-free particles. Condensation of secondary organic or inorganic aerosol components on BC particles can either result in parti-cles with core-shell morphology (concentric or eccentric) or with near-surface BC morphology. Adachi et al. (2010) pro-posed a mechanism producing near-surface BC particles via condensation processes, which involves condensation of or-ganic material onto nascent BC that effectively preserves the aggregate of primary BC particles in an un-collapsed form, followed by further mass acquisition via condensation,
pref-erentially onto the more organic portion of the particle. Based on our observations in the aged Pagami Creek fire plume, disintegration was associated with large BC-containing parti-cles (overall optical diameter >∼300 nm; see above). These large particles generally had a very low rBC mass fraction since the majority of the rBC cores were < 130 nm in diame-ter. They can be the result of extensive condensation of sec-ondary aerosol components onto the nascent BC aggregates or of coagulation of BC-particles with large BC-free particles during transport. Indeed, the initial plume was highly con-centrated such that both processes are likely to occur during aging of the BC particles in the plume. Thus, it is in prin-ciple possible that both BC particle types with near-surface BC or core-shell morphology are present in the aged plume. However, the observed number fraction of disintegrating par-ticles is for the most part a function of overall particle size, indicating that disintegration was possibly just the result of very thick coatings, as reported in the laboratory study by Moteki and Kondo (2007). Figure 13b shows the fraction of disintegrating particles to all rBC-containing particles as function of their coating thickness for the same sequence as shown in Fig. 13a (11:36–11:46 UTC, 16 September 2011). The increasing fraction of disintegrating particles with re-spect to all rBC-containing particles as a function of increas-ing coatincreas-ing thickness supports the assumption that thick coat-ings trigger the disintegration. At a coating thickness of about 120 nm 50 % of the rBC-containing particles produce an LSD signal above background noise in the trailing edge of the laser beam. For particles with coating thicknesses > 200 nm, more than 90 % of the rBC-containing particles disintegrate. Moteki et al. (2014) showed with controlled laboratory ex-periments that attached-type rBC particles can be identified by insignificant evaporation before incandescence onset. The dominant fraction of the disintegrating rBC-containing par-ticles observed in the Pagami Creek fire plume exhibited substantial coating evaporation, such as the example particle shown in Fig. 12c, which is clear evidence that those rBC-containing particles had a coated-type morphology.