ACPD
15, 21803–21835, 2015Seasonality of ultrafine and sub-micron aerosols
H. C. Cheung et al.
Title Page
Abstract Introduction
Conclusions References
Tables Figures
◭ ◮
◭ ◮
Back Close
Full Screen / Esc
Printer-friendly Version Interactive Discussion
Discussion
P
a
per
|
Discussion
P
a
per
|
Discussion
P
a
per
|
Discussion
P
a
per
|
Atmos. Chem. Phys. Discuss., 15, 21803–21835, 2015 www.atmos-chem-phys-discuss.net/15/21803/2015/ doi:10.5194/acpd-15-21803-2015
© Author(s) 2015. CC Attribution 3.0 License.
This discussion paper is/has been under review for the journal Atmospheric Chemistry and Physics (ACP). Please refer to the corresponding final paper in ACP if available.
Seasonality of ultrafine and sub-micron
aerosols and the inferences on particle
formation processes
H. C. Cheung1, C. C.-K. Chou1, M.-J. Chen1, W.-R. Huang1, S.-H. Huang1, C.-Y. Tsai1, and C. S.-L. Lee2
1
Research Center for Environmental Changes, Academia Sinica, Taipei 11529, Taiwan
2
Institute of Occupational Medicine and Industrial Hygiene, College of Public Health, National Taiwan University, Taipei, Taiwan
Received: 24 June 2015 – Accepted: 22 July 2015 – Published: 12 August 2015
Correspondence to: C. C.-K. Chou (ckchou@rcec.sinica.edu.tw)
ACPD
15, 21803–21835, 2015Seasonality of ultrafine and sub-micron aerosols
H. C. Cheung et al.
Title Page
Abstract Introduction
Conclusions References
Tables Figures
◭ ◮
◭ ◮
Back Close
Full Screen / Esc
Printer-friendly Version Interactive Discussion
Discussion
P
a
per
|
Discussion
P
a
per
|
Discussion
P
a
per
|
Discussion
P
a
per
|
Abstract
The aim of this study is to investigate the seasonal variations in the physicochem-ical properties of atmospheric ultrafine particles (UFPs, d≤100 nm) and submicron particles (PM1,d≤1 µm) in an East-Asian urban area, which are hypothesized to be
affected by the interchange of summer and winter monsoons. An observation
exper-5
iment was conducted at the TARO, an urban aerosol station in Taipei, Taiwan, from October 2012 to August 2013. The measurements included the mass concentration and chemical composition of UFPs and PM1, as well as the particle number
concentra-tion (PNC) and size distribuconcentra-tion (PSD) with size range of 4–736 nm. The results indicate that the mass concentration of PM1was elevated during cold seasons with peak level
10
of 18.5 µg m−3 in spring, whereas the highest UFPs concentration was measured in summertime with a seasonal mean of 1.62 µg m−3. Moreover, chemical analysis re-vealed that the UFPs and PM1were characterized by distinct composition; UFPs were
composed mostly of organics, whereas ammonium and sulfate were the major con-stituents in PM1. The seasonal median of total PNCs ranged from 13.9×10
3
cm−3 in
15
autumn to 19.4×103cm−3 in spring. The PSD information retrieved from the corre-sponding PNC measurements indicates that the nucleation mode PNC (N4−25) peaked
at 11.6×103cm−3 in winter, whereas the Aitken mode (N25−100) and accumulation
mode (N100−736) exhibited summer maxima at 6.0×10 3
and 3.1×103cm−3,
respec-tively. The shift in PSD during summertime is attributed to the enhancement in the
20
photochemical production of condensable organic matter that, in turn, contributes to the growth of aerosol particles in the atmosphere. In addition, remarkable photochem-ical production of particles was observed in spring and summer seasons, which was characterized with averaged particle growth and formation rates of 4.3±0.8 nm h−1and 1.6±0.8 cm−3s−1, respectively. The prevalence of new particle formation (NPF) in
sum-25
mer is suggested as a result of seasonally enhanced photochemical oxidation of SO2, which contributes to the production of H2SO4, and low level of PM10 (d≤10 µm) that
ACPD
15, 21803–21835, 2015Seasonality of ultrafine and sub-micron aerosols
H. C. Cheung et al.
Title Page
Abstract Introduction
Conclusions References
Tables Figures
◭ ◮
◭ ◮
Back Close
Full Screen / Esc
Printer-friendly Version Interactive Discussion
Discussion
P
a
per
|
Discussion
P
a
per
|
Discussion
P
a
per
|
Discussion
P
a
per
|
tion analysis upon the PNCs against NOxrevealed that the local vehicular exhaust was the dominant contributor of the UFPs throughout a year. On the contrary, the Asian pol-lution outbreaks can have significant influence in the PNC of accumulation mode par-ticles during the seasons of winter monsoons. The results of this study underline the significance of secondary organic aerosols in the seasonal variations of UFPs and the
5
influences of continental pollution outbreaks in the downwind areas of Asian outflows.
1 Introduction
Due to the significant impact of particulate matter on human health and climate change, it is vital to understand the formation process of atmospheric particles (Charlson et al., 1992; Donaldson et al., 1998). A number of mechanisms have been proposed by which
10
atmospheric particles are formed, including binary nucleation, ternary nucleation and ion-induced nucleation for charged particles, under different environment conditions (Kulmala, 2003; Kulmala et al., 2004). Numerous studies have been conducted in dif-ferent locations to elucidate particle formation processes under various environmental settings in the free troposphere, boreal forest and coastal areas, where new particles
15
formation processes are observed frequently (Lee et al., 2008; O’Dowd et al., 1999; Weber et al., 2001; Vehkamäki 2004). Recently, investigations were also carried out on new particle formation within urban boundary layer (e.g., Cheung et al., 2013 and references therein), where particle formation was suggested to be mainly influenced by the photo-oxidation of SO2. Furthermore, formation of particulate matter by
hetero-20
geneous reactions of gases on dust particles was reported (Hsu et al., 2014; Nie et al., 2012). Previous investigations have indicated that the air pollutants, both in gaseous and particulate form, associated with the continental outflows of air masses could have affected a wide region in East Asia and caused severe regional air pollution (e.g., Lin et al., 2004; Wang et al., 2003). However, the formation processes of ultrafine particles
25
(UFPs,d≤100 nm) and sub-micron particles (PM1,d≤1 µm) under the influences of
ACPD
15, 21803–21835, 2015Seasonality of ultrafine and sub-micron aerosols
H. C. Cheung et al.
Title Page
Abstract Introduction
Conclusions References
Tables Figures
◭ ◮
◭ ◮
Back Close
Full Screen / Esc
Printer-friendly Version Interactive Discussion
Discussion
P
a
per
|
Discussion
P
a
per
|
Discussion
P
a
per
|
Discussion
P
a
per
|
In urban environment, major contributing sources of aerosol particles include the ve-hicular exhausts (e.g., Pey et al., 2008; Pérez et al., 2010), industrial emissions (Gao et al., 2009) and new particle formation by photochemical reactions (e.g., Pey et al., 2009). Approximately 55–69 % of the total particle number concentrations (PNCs) were attributed to secondary aerosols during midday in several European cities (Reche et al.,
5
2011). In a subtropical urban area, Cheung et al. (2013) observed that there have been a ten-fold increase in nucleation mode PNCs (N9−25, with size 9< d <25 nm)
com-pared to that contributed by the vehicle emission in Taipei, Taiwan. Besides the local sources, air quality of the East Asian countries is also strongly affected by the transport of air pollutants from mainland China during periods of winter monsoons (Cheung et al.,
10
2005; Lin et al., 2004; Matsumoto et al., 2003). Lin et al. (2004) reported that the mass concentration of particulate matter (PM10) due to the long-range transport associated
with winter monsoons was 85 µg m−3, about 79 % higher than that due to local pollu-tion (∼47.4 µg m−3) in urban Taipei. Chemical composition of fine and coarse particles was measured during a winter monsoon period at Rishiri Island, near the northern tip
15
of Japan, to study the transport of continental aerosols (Matsumoto et al., 2003). The results showed that higher levels of particle mass concentrations were associated with the outbreaks of continental polluted air masses. In addition, Cheung et al. (2005) found deterioration in visibility around the southern China during wintertime as indicated by a two-fold increase in aerosol light scattering coefficient under the influences of winter
20
monsoons. All these studies were limited to measurements in terms of PM10 or PM2.5
for a particular period, and the seasonality of particles in either ultrafine or sub-micron range has not been well illustrated yet.
To attain a better understanding of the seasonal variations of ultrafine and sub-micron particles and the factors affecting particle formation, particularly under the
influ-25
ences of Asian monsoon circulations, we conducted a 1 year aerosol characterization experiment in Taipei, Taiwan, a typical subtropical urban area in East Asia. In this study, we analyzed number concentration and size distribution of aerosol particles, together with the mass concentration and chemical composition of UFPs and PM1 measured
ACPD
15, 21803–21835, 2015Seasonality of ultrafine and sub-micron aerosols
H. C. Cheung et al.
Title Page
Abstract Introduction
Conclusions References
Tables Figures
◭ ◮
◭ ◮
Back Close
Full Screen / Esc
Printer-friendly Version Interactive Discussion
Discussion
P
a
per
|
Discussion
P
a
per
|
Discussion
P
a
per
|
Discussion
P
a
per
|
during four seasonal campaigns (i.e. 24 October–15 November 2012, 4–24 January, 17 March–11 April, and 1–14 August 2013). The results of this study will contribute to the management strategies of the severe air pollution over the East Asia region.
2 Methodology
2.1 Observation site and instrumentation
5
The measurements were conducted at the Taipei Aerosol and Radiation Observatory (TARO, 25.02◦N, 121.53◦E), which locates in the downtown area of Taipei, Taiwan, dur-ing October 2012 to August 2013. The measurements were carried out for 2–3 weeks in each season (see Table 1 for measurement details). The aerosol observatory is on the top floor of the Building-B of the Department of Atmospheric Sciences, National
10
Taiwan University (ASNTU), which is∼20 m a.g.l. (Cheung et al., 2013).
Particle size distribution (PSD) in the range of 4–736 nm was measured by two scan-ning mobility particle sizer (SMPS) systems. One was equipped with a long-differential mobility analyzer (long-DMA, Model: TSI 3081, TSI Inc.) and a condensation particle counter (CPC) (Model: TSI 3022A, TSI Inc.) to measure the particles from 10–736 nm,
15
which was named long-SMPS. Another one was equipped with a nano-DMA (Model: TSI 3085, TSI Inc.) and an ultrafine water-based CPC (UWCPC, Model: TSI 3786, TSI Inc.) for measuring the particles from 4–110 nm, which was named nano-SMPS. The poly-disperse particles were classified into selected mono-disperse particles ac-cording to their electrostatic mobility by the DMAs. The number concentration of the
20
mono-disperse particles was then counted by the CPCs. Ambient air was drawn into the SMPS systems from outside the building through a 0.635 cm (inner diameter) con-ductive tube, and a sampling duration of 5 min was adopted for each PSD measure-ment. The SMPS systems’ flow rates were checked weekly during the sampling period and the accuracy of the particle sizing of the DMAs was checked using polystyrene
ACPD
15, 21803–21835, 2015Seasonality of ultrafine and sub-micron aerosols
H. C. Cheung et al.
Title Page
Abstract Introduction
Conclusions References
Tables Figures
◭ ◮
◭ ◮
Back Close
Full Screen / Esc
Printer-friendly Version Interactive Discussion
Discussion
P
a
per
|
Discussion
P
a
per
|
Discussion
P
a
per
|
Discussion
P
a
per
|
latex spheres (PSLs) before the campaigns. Operation details are referred to Cheung et al. (2013).
Size segregated aerosol samples were collected by a pair of Micro-Orifice Uniform Deposition Impactors (MOUDI, Model: 110, MSP Corp.). Taking the advantage that the cut diameter of the 10th MOUDI impaction stage is exactly 100 nm, the 11th
im-5
paction stage (cut diameter=56 nm) of each MOUDI was removed to allow the after filter function as a collector of UFPs. Besides, a pair of PM1 samplers, each consisted of a standard aerosol sampler (PQ-200, BGI Inc.) and a PM1sharp cut cyclone, were
deployed to collect PM1samples. For both UFPs and PM1sampling arrangements, one
of the paired samplers was equipped with Teflon filters, whereas another was equipped
10
with quartz fiber filters. The Teflon filter samples were used for gravimetric measure-ment. The quartz filter samples were deployed for analysis of soluble ions (Na+, NH+4, K+, Ca2+, Mg2+, PO43−, Cl−, NO−3, SO24−) using ion chromatograph (IC), and carbona-ceous components (i.e. OC and EC) in the aerosols using a DRI-2001A carbonacarbona-ceous aerosol analyzer with IMPROVE-A protocol. Details of the in-lab analysis are as
de-15
scribed previously (Salvador and Chou, 2014). Both the PM1and UFPs were collected
with double-layered quartz filters (i.e. QBQ setup) and the artifacts due to adsorption of gaseous components were corrected as suggested by Subramanian et al. (2004). The sampling duration of each sample set was from 14:00–12:00 LT (22 h), and a total of 69/75 sets of UFPs/PM1 samples were collected during the entire investigation period
20
(Autumn 20/21 sets, Winter 15/16 sets, Spring 25/25 sets and Summer 9/13 sets). Moreover, to assist the data interpretation, the hourly averaged mass concentration of PM10, the mixing ratio of trace gases (i.e. NOx, SO2 and O3) and the meteorology parameters (i.e. wind direction/speed and UVB) from the Guting air quality station of Taiwan Environmental Protection Agency, which is about 1 km from the TARO, were
25
analyzed in this study.
ACPD
15, 21803–21835, 2015Seasonality of ultrafine and sub-micron aerosols
H. C. Cheung et al.
Title Page
Abstract Introduction
Conclusions References
Tables Figures
◭ ◮
◭ ◮
Back Close
Full Screen / Esc
Printer-friendly Version Interactive Discussion
Discussion
P
a
per
|
Discussion
P
a
per
|
Discussion
P
a
per
|
Discussion
P
a
per
|
2.2 Data processing and analysis
The PSD of 4–736 nm presented in this study was combined from two sets of SMPS data, where the nano-SMPS corresponded to the size range of 4–49.6 nm, and the long-SMPS corresponded to the size>49.6 nm. The diffusion loss of the particles dur-ing the sample transport in the tubdur-ing was corrected accorddur-ing to the algorithm
pro-5
posed by Holman (1972). Particle number concentrations for different size ranges were then calculated from the SMPS measurements.
The 5 min PSD data were synchronized into hourly averages, and fitted by the DO-FIT model developed by Hussein et al. (2005) according to the multiple log-normal distribution algorithms. Based on the fitted PSD data, the PNCs were
classi-10
fied into 4≤d ≤25 nm (N4−25), 25≤d <100 nm (N25−100), 4≤d≤100 nm (N4−100),
100≤d <736 nm (N100−736) and 4≤d≤736 nm (N4−736), for nucleation mode, Aitken
mode, ultrafine, accumulation mode and total particles, respectively. Pearson correla-tion coefficient,r, was calculated by PASW Statistics ver. 18 (SPSS Inc.) to determine the correlation between the respective parameters.
15
2.3 Back-trajectory analysis
Backward trajectories were calculated using the HYSPLIT model (Hybrid Single Par-ticle Lagrangian Integrated Trajectory, Version 4.9) of NOAA (National Oceanic and Atmospheric Administration) (Draxler, 1999) for TARO during the sampling period, in order to trace the origins of the air masses. Note that the grid resolution of the
mete-20
orological data used for back-trajectories calculation is 1◦×1◦, which is not enough to trace the detailed air mass passage over the scale of the study region and, therefore, the trajectories only provide an indication of the region from which the air mass was originated.
As mentioned above, the air quality of urban Taipei is significantly affected by both
25
condi-ACPD
15, 21803–21835, 2015Seasonality of ultrafine and sub-micron aerosols
H. C. Cheung et al.
Title Page
Abstract Introduction
Conclusions References
Tables Figures
◭ ◮
◭ ◮
Back Close
Full Screen / Esc
Printer-friendly Version Interactive Discussion
Discussion
P
a
per
|
Discussion
P
a
per
|
Discussion
P
a
per
|
Discussion
P
a
per
|
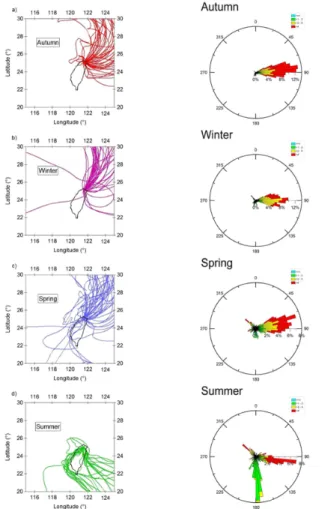
tions, particularly the wind patterns, is important and thus presented here. The back-trajectories of the air masses for the TARO are illustrated in Fig. 1 (left panel). The re-sults showed that northeasterly winds were dominating in autumn and winter seasons, passing through the Asian continent before reaching Taiwan, whereas southerly winds were prevailing in summer that passed through the Taiwan Island. The air masses
5
observed in spring period were found to be mainly associated with Asian continen-tal outflows and occasionally with the southerly flows. This observation agreed with the surface wind direction measured in urban Taipei area (see Fig. 1, right panel), where northeasterly winds were dominating during the period from November 2012 to May 2013, and southerly winds were prevailing from May 2013 to August 2013.
10
3 Results and discussions
3.1 PNCs and PSDs in respective seasons
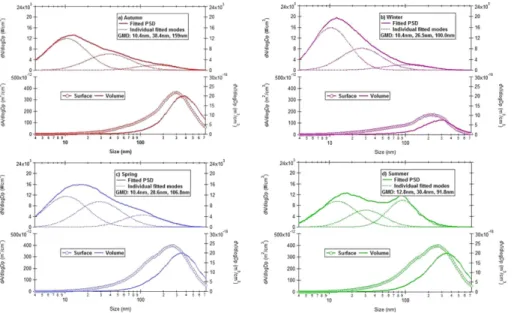
The PNCs of various size ranges during each season are summarized in Table 1. Rel-atively higherN4−736 were observed in spring and winter with median concentrations
of 17.4×10³and 19.4×103cm−3, respectively, followed by summer (16.6×103cm−3)
15
and minimized in autumn (13.9×103cm−3). This result is comparable to the previ-ous measurements conducted in urban Taipei where the seasonal means of PNCs (10
< d <560 nm) ranged from 11×103 to 17×103cm−3 (Cheng et al., 2014). Figure 2
illustrates the number, surface and volume size distributions of the aerosol particles. The geometric mean diameter (GMD) of each PSD mode was retrieved from the data
20
of number concentrations. It was found that the GMDs of the nucleation, Aitken and accumulation modes were 10.4–12.8 nm, 26.5–38.4 nm, and 91.8–159.0 nm, respec-tively.
It was revealed that the nucleation mode particles were predominant in the PNCs during autumn, winter and spring in this study area, whereas a distinct size
distri-25
ACPD
15, 21803–21835, 2015Seasonality of ultrafine and sub-micron aerosols
H. C. Cheung et al.
Title Page
Abstract Introduction
Conclusions References
Tables Figures
◭ ◮
◭ ◮
Back Close
Full Screen / Esc
Printer-friendly Version Interactive Discussion
Discussion
P
a
per
|
Discussion
P
a
per
|
Discussion
P
a
per
|
Discussion
P
a
per
|
(N4−25/N4−736) decreased to 0.44 and the Aitken mode PNCs increased to be
com-parable to that of the nucleation mode in summer. Observation from another aspect is that the PNC of nucleation mode (N4−25) peaked in winter and minimized in
sum-mer, whereas the PNCs of Aitken mode (N25−100) and accumulation mode (N100−736)
reached their respective maxima in summertime. Apparently, a large number of
nu-5
cleation mode particles could have been shifted into the Aitken and/or accumulation modes in summer. The changes in the size distribution in summer season are most likely due to the seasonally enhanced photochemical production of condensable vapors that, in turn, will contribute to the growth of aerosol particles in the atmosphere. This seasonality agrees with our previous findings that the growth rate of newly formed
par-10
ticles was dominated by the photolysis of ozone, an indicator of photochemical activity (Cheung et al., 2013). The causes responsible for the observed seasonal variations in PNCs will be discussed in more details in following sections.
3.2 Mass concentration and chemical composition
Figure 3a and b illustrates the averaged chemical composition and mass concentration
15
of UFPs and PM1, respectively, for each season. Details of the mass concentration and
chemical composition of UFPs and PM1are listed in Table S1 in the Supplement. The seasonal means of UFPs range from 0.73 to 1.62 µg m−3, with an annual av-erage of 1.01 µg m−3. The measured UFPs mass concentration of the present study is comparable to that in urban area of Los Angeles, United States which was 0.80–
20
1.58 µg m−3 (Hughes et al., 1998), and relatively higher than that in urban Helsinki, Finland (average: 0.49 µg m−3, Pakkanen et al., 2001). For the chemical composition, organic carbon (OC) was found to be the major mass contributor, which accounted for 29.8 % (seasonal means ranging from 26.9 to 33.4 % for various seasons) of aver-aged mass concentration of UFPs, and elemental carbon (EC) was the second major
25
ACPD
15, 21803–21835, 2015Seasonality of ultrafine and sub-micron aerosols
H. C. Cheung et al.
Title Page
Abstract Introduction
Conclusions References
Tables Figures
◭ ◮
◭ ◮
Back Close
Full Screen / Esc
Printer-friendly Version Interactive Discussion
Discussion
P
a
per
|
Discussion
P
a
per
|
Discussion
P
a
per
|
Discussion
P
a
per
|
fraction of mass was contributed by the group of “others”, which consisted of mineral (K+, Ca2+, PO43− and Mg2+), sea-salt (Na+ and Cl−), and unidentified species. The re-sults showed that, in average, mineral and sea salt components attributed only 3.5 % (ranging from 2.0–6.0 %) to UFPs mass concentration. Thus a substantial amount of UFPs remained unidentified, which was most likely relevant to the hydrogen and
oxy-5
gen associated with organic carbon (OC). The conversion factors used to estimate the average molecular weight per carbon in particulate organic matter varied depend-ing on the characteristic of aerosols. A lower factor value, 1.2, was usually suggested for saturated organic molecules, while higher value, 1.6, was adopted for water-soluble compounds which consist of multifunctional oxygenated groups, and even higher factor
10
value was used for aged aerosols which contain higher portion of low and semi-volatile products of photochemical reactions (Turpin and Lim et al., 2001). The high fraction of the “others” group found in UFPs suggested that the photochemical production of sec-ondary organic aerosols was a significant process responsible for the elevated UFPs levels observed in this study.
15
As shown in Fig. 3b, annual average of PM1was estimated to be 14.7 µg m
−3
(11.6– 18.5 µg m−3), which is similar to the results of a previous study in urban Taipei (average: 14.0 µg m−3, Li et al., 2010). The measured PM1 level was relatively higher than that
of the urban areas of Phoenix, United States (5.9 µg m−3, Lundgren et al., 1996) and Helsinki, Finland (6.1 µg m−3, Vallius et al., 2000). For chemical composition, sulfate
20
was the major mass contributor of PM1(average: 39.0 %, ranging from 33.8 to 46.8 %), followed by ammonium (average: 12.7 %, 12.0–13.2 %) and OC (average: 11.5 %, rang-ing from 9.2 to 14.3 %).
The results presented above indicate that UPFs exhibited distinct seasonality and composition from PM1 in the study area. The highest UFPs concentration was
ob-25
served in summer (1.62 µg m−3) and the lowest in winter (0.73 µg m−3). This result may be attributed to the stronger photochemical activities in summer which could have en-hanced the formation of secondary organic aerosols. Consequently, the mass concen-tration of OC increased from 0.20 µg m−3 in winter to 0.47 µg m−3 in summertime. It
ACPD
15, 21803–21835, 2015Seasonality of ultrafine and sub-micron aerosols
H. C. Cheung et al.
Title Page
Abstract Introduction
Conclusions References
Tables Figures
◭ ◮
◭ ◮
Back Close
Full Screen / Esc
Printer-friendly Version Interactive Discussion
Discussion
P
a
per
|
Discussion
P
a
per
|
Discussion
P
a
per
|
Discussion
P
a
per
|
was noteworthy that the mass concentration of sulfate in UFPs also peaked in summer (64 ng m−3), suggesting enhancement in photo-oxidation of SO2. Cheung et al. (2013)
found that photo-oxidation of SO2was the major mechanism for the formation of new
particles in Taipei, Taiwan and the production of condensable vapors was also dom-inated by photo-oxidation. The co-variations in sulfate and OC revealed in this study
5
further suggest that secondary organic compounds are the major condensable matter contributing to the growth of newly formed particles.
While the organics predominated in the mass concentration of UFPs, which included nucleation mode and Aitken mode particles, the measurements of PM1 in this study
suggest that sulfate was the major constituent of accumulation mode aerosols. In
con-10
trast to the seasonality of UFPs, the mass concentration of PM1 reached the maximal at 18.5 µg m−3in spring and exhibited the minimal at 11.6 µg m−3 in summer. The PM1
differences between spring and summer were mostly due to declined ambient levels of sulfate, nitrate, and ammonium ions. As a result, the mass contribution of the three inorganic ions in PM1 reduced from 55.7 to 46.2 % and, on the contrary, the mass
15
fraction of OC increased from 10.2 to 14.3 %. The seasonal characteristics of PM1
concentration and composition are attributed mostly to the changes in the origin areas of background air mass, which shifts from the Asia Continent to the western Pacific Ocean during summertime. Our previous studies reported that the fine particulate mat-ter (PM2.5) transported on the Asian outflows to northern Taiwan maximized in
spring-20
time and were enriched in sulfate, nitrate, and ammonium (Chou et al., 2008, 2010). The seasonality of PM1found in this study is consistent with the previous observations
for PM2.5 and thereby suggests the significance of Asian outflow aerosols to the PM1 budget in the downwind areas of the Asia Continent.
3.3 Seasonal characteristics of photochemical production
25
ACPD
15, 21803–21835, 2015Seasonality of ultrafine and sub-micron aerosols
H. C. Cheung et al.
Title Page
Abstract Introduction
Conclusions References
Tables Figures
◭ ◮
◭ ◮
Back Close
Full Screen / Esc
Printer-friendly Version Interactive Discussion
Discussion
P
a
per
|
Discussion
P
a
per
|
Discussion
P
a
per
|
Discussion
P
a
per
|
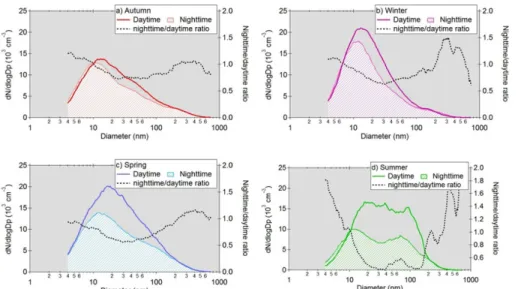
emitted from the vehicular exhausts and the elevated PNCs in daytime are due to both the primary and secondary sources of the particles in the study area (Cheung et al., 2013), a larger difference between the PNCs observed in daytime and nighttime indicates stronger influence of photochemical production on the PNCs. The most strik-ing seasonal features shown in Fig. 4 is the large difference between daytime against
5
nighttime PSDs in summer as indicated by the lowN4−736(nighttime)/N4−736 (daytime)
ratios, whereas higher ratios were observed in other seasons. This result is as ex-pected because the photochemical production of nucleation mode particles was more intense during warm season in subtropical areas (Cheung et al., 2011). Moreover, as discussed in previous section, the photochemical reactions could produce condensable
10
organics that allows the newly formed nucleation mode particles to grow into the Aitken mode. The relatively smaller differences between the daytime and nighttimeN4−736 in
autumn and winter show that the photochemical contribution in PNCs was declined as compared to that in summertime.
3.4 Influences of local emission on PNCs
15
Vehicle emission is known as the major source of the particulate matter in urban en-vironment, particularly during the nighttime. In order to investigate the relationship be-tween the vehicular exhausts and PNCs, the scatter plots of NOx (as an indicator of vehicle emission) againstN4−25,N25−100andN100−736during the nighttime were
exam-ined for winter and summer periods (see Fig. 5). The values of the Pearson correlation
20
coefficient (r) and the slope of linear regression between NOx and PNCs are summa-rized in Table 2.
The highestr values were found in both the plots of NOx againstN25−100 for winter
(r=0.88) and summer (r =0.87). This result suggests that a strong linear correlation between the vehicle emission and theN25−100, coincided with the results from
previ-25
ous studies (e.g., Morawska et al., 2008). During wintertime, stronger correlation was found between NOx againstN4−25 (r=0.84) andN25−100(r=0.88) compared to that
between NOx and N100−736 (r=0.38). In contrast, high r values were obtained
ACPD
15, 21803–21835, 2015Seasonality of ultrafine and sub-micron aerosols
H. C. Cheung et al.
Title Page
Abstract Introduction
Conclusions References
Tables Figures
◭ ◮
◭ ◮
Back Close
Full Screen / Esc
Printer-friendly Version Interactive Discussion
Discussion
P
a
per
|
Discussion
P
a
per
|
Discussion
P
a
per
|
Discussion
P
a
per
|
tween NOx and all particle modes in summer (r =0.70–0.87). The robust correlation between NOx and N4−25/N25−100 suggests that local vehicle emission was the
pre-dominant source of UFPs throughout a year. However, in the winter case the PNCs of accumulation mode particles (N100−736) were dominated by NOx-independent sources,
which was most likely relevant to the pollution outbreaks from the Asian continent. Lin
5
et al. (2004) indicated that the long range transported air mass was characterized by high level of PM10 and low mixing ratio of NOx due to its short atmospheric lifetime.
The slope values shown in Fig. 6 can serve as a relative emission factor of parti-cles per NOx in the study area, which indicates the degree of the influences of vehicle emission on the PNCs (Cheung et al., 2013). Relatively higher slope values found in
10
summertime compared to winter period evidence a greater influence of the vehicle emission on particle concentration. Furthermore, the lower emission factor for nucle-ation mode and higher one for the Aitken mode demonstrate the size shift effects of particle growth in summer evening. The seasonal effects on the emission ratio of PNCs and NOx are rather difficult to address since the complexity of different controlling
fac-15
tors, such as formation mechanisms and meteorological conditions. For example, Nam et al. (2010) reported negatively exponential correlation between the PM/NOx ratio in vehicle emission and ambient temperature, and suggested that the impact of ambient temperature on particulate matter was larger than that on NOx. Nevertheless, the ob-served differences in the PNCs/NOxratios for winter and summer periods of this study
20
necessitate further investigations on the formation mechanisms of aerosol particles in urban areas, in particular the nucleation and the Aitken modes.
3.5 Influence of long-range transport (LRT)
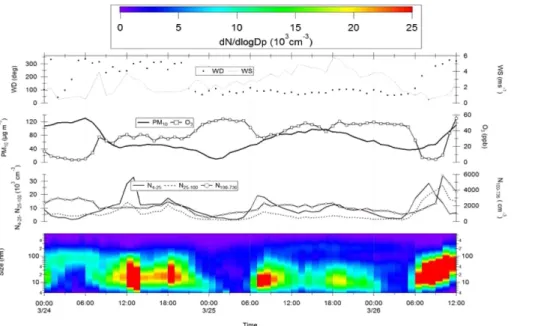
During the seasons of winter monsoons, i.e. from autumn to spring, the continental outflows have been frequently observed in urban Taipei, which is indicated by the stable
25
northeasterly wind and increase of O3level (Lin et al., 2004). Previous studies of
ACPD
15, 21803–21835, 2015Seasonality of ultrafine and sub-micron aerosols
H. C. Cheung et al.
Title Page
Abstract Introduction
Conclusions References
Tables Figures
◭ ◮
◭ ◮
Back Close
Full Screen / Esc
Printer-friendly Version Interactive Discussion
Discussion
P
a
per
|
Discussion
P
a
per
|
Discussion
P
a
per
|
Discussion
P
a
per
|
2004; Chou et al., 2004). Figure 6 demonstrates an LRT pollution event observed at the TARO during this study. The wind direction changed from westerly/northwesterly to northeasterly at 21:00, 24 March and which continued until 06:00, 26 March. During this period, the O3 mixing ratio remained at moderate level (∼30–55 ppb) and PM10
increased from 10 to 98 µg m−3. In this section, we attempt to analyze the PSDs/PNCs
5
under the influences of continental pollution outbreaks. The periods of the respective LRT events are listed in Table S2 in the Supplement.
As shown in Fig. 6, the diurnal variations of PSD during the LRT event exhibited two
N4−25 peaks associated to the morning and afternoon traffic rush hours, whereas the
PNCs of the Aitken mode particles kept at a low level. This result suggests that the
influ-10
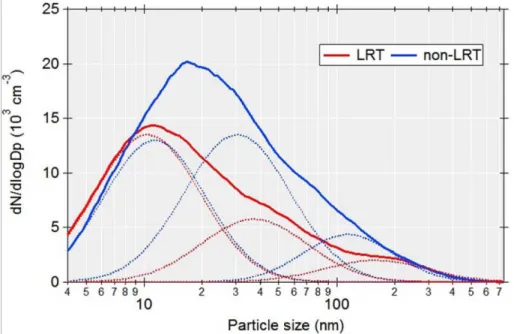
ences of local vehicle emission on PNCs were still in place, whereas growth of particles due to secondary production of condensable vapors could have been suppressed. The averaged PSDs for LRT and non-LRT cases are shown in Fig. 7. The geometric mean diameters of the nucleation, Aitken, and accumulation modes in PSDs were found to be at 10.6, 37.2 and 156.8 nm for LRT and 11.3, 30.0 and 113.4 nm for non-LRT cases,
re-15
spectively. The medianN4−25 (11.1×10 3
cm−3),N25−100(7.3×10 3
cm−3) andN100−736
(1.8×103cm−3) observed in non-LRT events are significantly higher than those for LRT
events (N4−25: 9.2×10 3
cm−3,N25−100: 3.8×10 3
cm−3,N100−736: 1.3×10 3
cm−3). This could be attributed to the lower wind speed (and hence poor dispersion) during non-LRT events (1.5±0.8 m s−1) than that for LRT events (3.0±0.8 m s−1). In contrast to the
20
increases in PM10 observed usually during LRT episodes (e.g., Lin et al., 2012), the relatively lower PNCs suggest that the number concentration of submicron particles, in particular UFPs, are still dominated by local emissions during the episodes of con-tinental pollution outbreaks. This is consistent with the observation of seasonal UFPs mass concentration that peaked in summertime when Taiwan was isolated from the
25
influences of continental air mass.
ACPD
15, 21803–21835, 2015Seasonality of ultrafine and sub-micron aerosols
H. C. Cheung et al.
Title Page
Abstract Introduction
Conclusions References
Tables Figures
◭ ◮
◭ ◮
Back Close
Full Screen / Esc
Printer-friendly Version Interactive Discussion
Discussion
P
a
per
|
Discussion
P
a
per
|
Discussion
P
a
per
|
Discussion
P
a
per
|
3.6 Factors affecting new particle formation (NPF)
As shown in previous study, the NPF events were frequently observed in summer, which subsequently induced a notable increase in N4−25 in urban Taipei (Cheung
et al., 2013). Figure 8a–d shows the scatter plots ofN4−25 against NOxfor daytimes in
each season. During the NPF events, a non-linear relationship between these two
pa-5
rameters was usually observed during the daytime (Cheung et al., 2013). The results show that remarkable NPF events were observed often in summer and occasionally in spring, but rarely in autumn and winter in the study area. The frequency of remark-able NPF events was found to be 8 out of 84 measurement days and the events were observed only in spring (3 out of 26 days) and summer (5 out of 14 days) seasons.
10
The averaged particle growth and formation rates were found to be 4.3±0.8 nm h−1 and 1.6±0.8 cm−3s−1, which were comparable to those measured in previous urban studies (e.g., Cheung et al., 2013). The particle growth and formation rates of each case are listed in Table S3 in the Supplement.
Table 3 summarizes the averages of N4−25, PM10, H2SO4 proxy (as
15
UVB*SO2/condensation sink) and wind speed for each season. The most signifi-cant factors relevant to the frequent particle formation observed in summertime are the low PM10 concentration (35.6 µg m
−3
) and high H2SO4 proxy (271.1 ppb W m
−2
s) in the season. The association of sulfuric acid production and the NPF events agrees with the elevated mass concentration of sulfate in UFPs during summertime
20
(shown in Table S1), as well as the results of previous urban studies (Woo et al., 2001; Cheung et al., 2013). This strongly supports that the new particle formation was mainly driven by the photochemical oxidation of SO2 under low condensation sink
conditions, where the SO2could be transported from the upwind area on the summer
monsoons (see Fig. 1d). On the contrary, the absence of particle formation events in
25
ACPD
15, 21803–21835, 2015Seasonality of ultrafine and sub-micron aerosols
H. C. Cheung et al.
Title Page
Abstract Introduction
Conclusions References
Tables Figures
◭ ◮
◭ ◮
Back Close
Full Screen / Esc
Printer-friendly Version Interactive Discussion
Discussion
P
a
per
|
Discussion
P
a
per
|
Discussion
P
a
per
|
Discussion
P
a
per
|
concentration and high sulfuric acid production favor the particle formation process in urban areas.
4 Conclusions
The mass concentration and chemical composition of UFPs and submicron particles (i.e. PM1) as well as the PNCs and PSDs with size ranged from 4 to 736 nm were
mea-5
sured during four seasonal campaigns in the period from October 2012 to August 2013 at the TARO, a subtropical urban aerosol station in East Asia. Significant differences in the seasonality and chemical composition of UFPs and PM1 were revealed. The
UFPs were composed mostly of organic matter and reached the maximal in summer, whereas the PM1composition was dominated by ammonium and sulfate and exhibited
10
a seasonal peak in the spring.
It was found that the total PNCs in Taipei, Taiwan were elevated significantly dur-ing cold seasons, which were caused mostly by the high levels of nucleation mode particles (N4−25). On the contrary, both the Aitken mode (N25−100) and accumulation
mode (N100−736) PNCs reached their respective maxima in summertime. Consistent
15
correlation without significant seasonal differences was found between the UFPs (i.e. nucleation and Aitken mode particles) and NOx, suggesting that local vehicle emission
is the major source of UFPs in the study area throughout a year. The local vehicle emission is also dominating the accumulation mode PNC in summer, but not in winter-time. The declined correlation between NOx and N100−736 in winter (r=0.38) is likely
20
due to the influences of air pollution associated with the Asian outflows.
The elevated UFPs level in summer is attributed to the increases in the concentration of Aitken mode particles (N25−100). It was revealed from the measurements of PSD that
a large number of nucleation mode particles could have shifted into the Aitken mode during summertime, which is most likely relevant to the photochemical production of
25
condensable vapors that, in turn, could have contributed to the growth of particles in the atmosphere. Moreover, the chemical measurements suggest that the constituents
ACPD
15, 21803–21835, 2015Seasonality of ultrafine and sub-micron aerosols
H. C. Cheung et al.
Title Page
Abstract Introduction
Conclusions References
Tables Figures
◭ ◮
◭ ◮
Back Close
Full Screen / Esc
Printer-friendly Version Interactive Discussion
Discussion
P
a
per
|
Discussion
P
a
per
|
Discussion
P
a
per
|
Discussion
P
a
per
|
of the condensed materials in UFPs are mostly organic matter, underlining the signifi-cance of secondary organic aerosols in the ambient UFPs.
A total of 8 new particle formation (NPF) events occurred out of 84 measurement days in this study, which were observed in spring (3 events out of 26 days) and sum-mer (5 events out of 14 days). The prevalence of NPF in sumsum-mer agrees with the
5
highest H2SO4proxy and lowest PM10observed in this study, which provided favorable
atmospheric conditions for new particle formation. The averaged particle growth and formation rates for the NPF events are 4.3±0.8 nm h−1and 1.6±0.8 cm−3s−1, respec-tively, which are comparable to those measured in previous urban studies.
As exemplifying above, the characteristics of various physicochemical properties of
10
particles investigated in this study and the occurrence of NPF exhibited a strong sea-sonality, which was co-influenced by the long-range transported particles during the seasons of winter monsoons and the strong photochemical activities in summer. The results of this study are critical for the authorities involved in urban development and health impact assessment, and the environmental policy makers who are tackling the
15
severe atmospheric pollution in the East Asia region.
The Supplement related to this article is available online at doi:10.5194/acpd-15-21803-2015-supplement.
Acknowledgements. This research was supported by the Academia Sinica and the Ministry of Science and Technology of Taiwan through grants 103-2111-M-001-003, 102-2628-M-001-007,
20
ACPD
15, 21803–21835, 2015Seasonality of ultrafine and sub-micron aerosols
H. C. Cheung et al.
Title Page
Abstract Introduction
Conclusions References
Tables Figures
◭ ◮
◭ ◮
Back Close
Full Screen / Esc
Printer-friendly Version Interactive Discussion
Discussion
P
a
per
|
Discussion
P
a
per
|
Discussion
P
a
per
|
Discussion
P
a
per
|
References
Charlson, R. J., Schwartz, S. E., Hales, J. M., Cess, R. D., Coakley Jr., J. A., Hansen, J. E., and Hofmann, D. J.: Climate forcing by anthropogenic aerosols, Science, 255, 423–430, 1992. Cheng, Y.-H., Kao, Y.-Y., and Liu, J.-J.: Correlations between black carbon mass and
size-resolved particle number concentrations in the Taipei urban area: a five-year long-term
ob-5
servation, Atmos. Pollut. Res., 5, 62–72, 2014.
Cheung, H. C., Wang, T., Baumann, K., and Guo, H.: Influence of regional pollution outflow on the concentrations of fine particulate matter and visibility in the coastal area of southern China, Atmos. Environ., 39, 6463–6474, 2005.
Cheung, H. C., Morawska, L., and Ristovski, Z. D.: Observation of new particle formation in
10
subtropical urban environment, Atmos. Chem. Phys., 11, 3823–3833, doi:10.5194/acp-11-3823-2011, 2011.
Cheung, H. C., Chou, C. C.-K., Huang, W.-R., and Tsai, C.-Y.: Characterization of ultrafine particle number concentration and new particle formation in an urban environment of Taipei, Taiwan, Atmos. Chem. Phys., 13, 8935–8946, doi:10.5194/acp-13-8935-2013, 2013.
15
Chou, C. C.-K., Lin, C.-Y., Chen, T.-K., Hsu, S.-C., Lung, S.-C., Liu, S. C., and Young, C.-Y.: Influence of long-range transport dust particles on local air quality: a case study on Asian dust episodes in Taipei during the Spring of 2002, Terr. Atmos. Ocean. Sci., 15, 881–889, 2004.
Chou, C. C.-K., Huang, S.-H., Chen, T.-K., Lin, C.-Y., and Wang, L.-C.: Size-segregated
char-20
acterization of atmospheric aerosols in Taipei during Asian outflow episodes, Atmos. Res., 75, 89–109, 2005.
Chou, C. C.-K., Lee, C.-T., Yuan, C. S., Hsu, W. C., Hsu, S. C., and Liu, S. C.: Implications of the chemical transformation of Asian outflow aerosols for the long-range transport of inorganic nitrogen species, Atmos. Environ., 42, 7508–7519, 2008.
25
Chou, C. C.-K., Lee, C. T., Cheng, M. T., Yuan, C. S., Chen, S. J., Wu, Y. L., Hsu, W. C., Lung, S. C., Hsu, S. C., Lin, C. Y., and Liu, S. C.: Seasonal variation and spatial distribution of carbonaceous aerosols in Taiwan, Atmos. Chem. Phys., 10, 9563–9578, doi:10.5194/acp-10-9563-2010, 2010.
Donaldson, K., Li, X. Y., and MacNee, W.: Ultrafine (nanometre) particle mediated lung injury, J.
30
Aerosol Sci., 29, 553–560, 1998.
ACPD
15, 21803–21835, 2015Seasonality of ultrafine and sub-micron aerosols
H. C. Cheung et al.
Title Page
Abstract Introduction
Conclusions References
Tables Figures
◭ ◮
◭ ◮
Back Close
Full Screen / Esc
Printer-friendly Version Interactive Discussion
Discussion
P
a
per
|
Discussion
P
a
per
|
Discussion
P
a
per
|
Discussion
P
a
per
|
Draxler, R. R.: HYSPLIT4 user’s guidem, NOAA Tech. Memo. ERL ARL-230, NOAA Air Re-sources Laboratory, Silver Spring, MD, USA, 1999.
Guo, H., Ding, A., Morawska, L., He, C., Ayoko, G., Li, Y., and Hung, W.: Size distribution and new particle formation in sub-tropical eastern Australia, Environ. Chem., 5, 382–390, 2008. Holman, J. P.: Heat Transfer, McGraw-Hill, New York, USA, 1972.
5
Hsu, S.-C., Lee, C. S. L., Huh, C.-A., Shaheen, R., Lin, F.-J., and Liu, S. C.: Ammonium defi-ciency caused by heterogeneous reactions during a super asian dust episode, J. Geophys. Res., 119, 6803–6817, doi:10.1002/2013JD021096, 2014.
Hughes, L. S., Cass, G. R., Gone, J., Ames, M., and Olmez, I.: Physical and chemical charac-terization of atmospheric ultrafine particles in the Los Angeles area, Environ. Sci. Technol.,
10
32, 1153–1161, 1998.
Hussein, T., Dal Maso, M., Petäjä, T., Koponen, I. K., Paatero, P., Aalto, P. P., Hämeri, K., and Kulmala, M.: Evaluation of an automatic algorithm for fitting the particle number size distributions, Boreal Env. Res., 10, 337–355, 2005.
Juwono, A., Johnson, G. R., Mazaheri, M., and Morawska, L., Roux, F., and Kitchen, B.:
Inves-15
tigation of the airborne submicrometer particles emitted by dredging vessels using a plume capture method, Atmos. Environ., 73, 112–123, 2013.
Kulmala, M.: How particles nucleate and grow, Science, 302, 1000–1001, 2003.
Kulmala, M., Vehkamäki, H., Petäjä, T., Dal Maso, M., Lauri, A., Kerminen, V.-M., Birmili, W., and McMurry, P. H.: Formation and growth rates of ultrafine atmospheric particles: a review
20
of observations, J. Aerosol Sci., 35, 143–176, 2004.
Kulmala, M., Kontkanen, J., Junninen, H., Lehtipalo, K., Manninen, H. E., Nieminen, T., Petäjä, T., Sipilä, M., Schobesberger, S., Rantala, P., Franchin, A., Jokinen, T., Järvi-nen, E., Äijälä, M., Kangasluoma, J., Hakala, J., Aalto, P. P., PaasoJärvi-nen, P., Mikkilä, J., Vanhanen, J., Aalto, J., Hakola, H., Makkonen, U., Ruuskanen, T., Mauldin III, R. L.,
Du-25
plissy, J., Vehkamäki, H., Bäck, J., Kortelainen, A., Riipinen, I., Kurtén, T., Johnston, M. V., Smith, J. N., Ehn, M., Mentel, T. F., Lehtinen, K. E. J., Laaksonen, A., Kerminen, V.-M., and Worsnop, D. R.: Direct observations of atmospheric aerosol nucleation, Science, 339, 943– 946, 2013.
Lee, Y., Lee, H., Kim, M., Choi, C. Y., and Kim, J.: Characteristics of particle formation events
30
in the coastal region of Korea in 2005, Atmos. Environ., 42, 3729–3739, 2008.
ACPD
15, 21803–21835, 2015Seasonality of ultrafine and sub-micron aerosols
H. C. Cheung et al.
Title Page
Abstract Introduction
Conclusions References
Tables Figures
◭ ◮
◭ ◮
Back Close
Full Screen / Esc
Printer-friendly Version Interactive Discussion
Discussion
P
a
per
|
Discussion
P
a
per
|
Discussion
P
a
per
|
Discussion
P
a
per
|
Lin, C.-Y., Liu, S. C., Chou, C. C.-K., Liu, T. H., and Lee, C.-T.: Long-range transport of Asian dust and air pollutants to Taiwan, Terr. Atmos. Ocean. Sci., 15, 759–784, 2004.
Lin, C.-Y., Chou, C. C.-K., Wang, Z., Lung, S.-C., Lee, C.-T., Yuan, C.-S., Chen, W.-N., Chang, S.-Y., Hsu, S.-C., Chen, W.-C., and Liu, S. C.: Impact of different transport mech-anisms of Asian dust and anthropogenic pollutants to Taiwan, Atmos. Environ., 60, 403–418,
5
2012.
Lundgren, D. A. Hlaing, D. N., Rich, T. A., and Marlpe, V. A.: PM10/PM2.5PM1data from a tri-chotomous sampler, Aerosol Sci. Tech., 25, 353–357, 1996.
Matsumoto, K., Uyama, Y., Hayano, T., Tanimoto, H., Uno, I., and Uematsu, M.: Chemical prop-erties and outflow patterns of anthropogenic and dust particles on Rishiri Island during the
10
Asian Pacific Regional Aerosol Characterization Experiment (ACE-Asia), J. Geophys. Res., 108, 8666, doi:10.1029/2003JD003426, 2003.
Mazaheri, M., Johnson, G. R., and Morawska, L.: Particle and gaseous emissions from com-mercial aircraft at each stage of the landing and takeoffcycle, Environ. Sci. Technol., 43, 441–446, 2009.
15
Morawska, L., Ristovski, Z., Jayaratne, E. R., Keogh, D. U., and Ling, X.: Ambient nano and ultrafine particles from motor vehicle emissions: characteristics, ambient processing and im-plications on human exposure, Atmos. Environ., 42, 8113–8138, 2008.
Nam, E., Kishan, S., Baldauf, R. W., Fulper, C. R., Sabisch, M., and Warila, J.: Temperature effects on particulate matter emissions from light-duty, gasonline-powered motor vehicles,
20
Environ. Sci. Technol., 44, 4672–4677, 2010.
Nie, W., Wang, T., Xue, L. K., Ding, A. J., Wang, X. F., Gao, X. M., Xu, Z., Yu, Y. C., Yuan, C., Zhou, Z. S., Gao, R., Liu, X. H., Wang, Y., Fan, S. J., Poon, S., Zhang, Q. Z., and Wang, W. X.: Asian dust storm observed at a rural mountain site in southern China: chemical evolution and heterogeneous photochemistry, Atmos. Chem. Phys., 12, 11985–11995,
doi:10.5194/acp-25
12-11985-2012, 2012.
O’Dowd, C. D., McFiggans, G., Greasey, D. J., Pirjola, L., Hoell, C., Smith, M. H., Allan, B. J., Plane, J. M. C., Heard, D. E., Lee, J. D., Pilling, M. J., and Kulmala, M.: On the photochemical production of new particles in the coastal boundary layer, Geophys. Res. Lett., 26, 1707– 1710, 1999.
30
Pakkanen, T. A., Kerminen, V.-M., Korhonen, C. H., Hillamo, R. E., Aarnio, P., Koskentalo, T., and Maenhaut, W.: Urban and rural ultrafine (PM0.1) particles in the Helsinki area, Atmos. Environ., 35, 4593–4607, 2001.
ACPD
15, 21803–21835, 2015Seasonality of ultrafine and sub-micron aerosols
H. C. Cheung et al.
Title Page
Abstract Introduction
Conclusions References
Tables Figures
◭ ◮
◭ ◮
Back Close
Full Screen / Esc
Printer-friendly Version Interactive Discussion
Discussion
P
a
per
|
Discussion
P
a
per
|
Discussion
P
a
per
|
Discussion
P
a
per
|
Pérez, N., Pey, J., Cusack, M., Reche, C., Querol, X., Alastuey, A., and Viana, M.: Variability of particle number, black carbon, and PM10, PM2.5and PM1levels and speciation: influence of road traffic emissions on urban air quality, Aerosol Sci. Tech., 44, 487–499, 2010.
Pey, J., Rodíguez, S., Querol, X., Alastuey, A., Moreno, T., Putaud, J. P., and Van Dingenen, R.: Variations of urban aerosols in the western Mediterranean, Atmos. Environ., 42, 9052–9062,
5
2008.
Pey, J., Querol, X., Alastuey, A., Rodiguez, S., Putaud, J. P., and Van Dingenen, R.: Source ap-portionment of urban fine and ultrafine particle number concentration in a Western Mediter-ranean city, Atmos. Environ., 43, 4407–4415, 2009.
Reche, C., Querol, X., Alastuey, A., Viana, M., Pey, J., Moreno, T., Rodríguez, S., González, Y.,
10
Fernández-Camacho, R., de la Rosa, J., Dall’Osto, M., Prévôt, A. S. H., Hueglin, C., Harri-son, R. M., and Quincey, P.: New considerations for PM, Black Carbon and particle number concentration for air quality monitoring across different European cities, Atmos. Chem. Phys., 11, 6207–6227, doi:10.5194/acp-11-6207-2011, 2011.
Salvador, C. M. and Chou, C. C.-K.: Analysis of semi-volatile materials (SVM) in fine particulate
15
matter, Atmos. Environ., 95, 288–295, 2014.
Subramanian, R., Khlystov, A. Y., Cabada, J. C., and Robinson, A. L.: Positive and negative artifacts in particulate organic carbon measurements with denuded and undenuded sampler configurations, Aerosol Sci. Tech., 38, 27–48, 2004.
Turpin, B. J. and Lim, H.-J.: Species contributions to PM2.5 mass concentrations: revisiting
20
common assumptions for estimating organic mass, Aerosol Sci. Tech., 35, 602–610, 2001. Vallius, M. J., Ruuskanen, J., Mirme, A., and Pekkanen, J.: Concentrations and estimated soot
content of PM1, PM2.5and PM10in a subarctic urban atmosphere, Environ. Sci. Technol., 34, 1919–1925, 2000.
Vehkamäki, H., Dal Maso, M., Hussein, T., Flanagan, R., Hyvärinen, A., Lauros, J.,
25
Merikanto, P., Mönkkönen, M., Pihlatie, K., Salminen, K., Sogacheva, L., Thum, T., Ruuska-nen, T. M., KeroRuuska-nen, P., Aalto, P. P., Hari, P., LehtiRuuska-nen, K. E. J., Rannik, Ü, and Kulmala, M.: Atmospheric particle formation events at Värriö measurement station in Finnish Lapland 1998-2002, Atmos. Chem. Phys., 4, 2015–2023, doi:10.5194/acp-4-2015-2004, 2004. Wang, T., Ding, A. J., Blake, D. R., Zahorowski, W., Poon, C. N., and Li, Y.-S.: Chemical
char-30
ACPD
15, 21803–21835, 2015Seasonality of ultrafine and sub-micron aerosols
H. C. Cheung et al.
Title Page
Abstract Introduction
Conclusions References
Tables Figures
◭ ◮
◭ ◮
Back Close
Full Screen / Esc
Printer-friendly Version Interactive Discussion
Discussion
P
a
per
|
Discussion
P
a
per
|
Discussion
P
a
per
|
Discussion
P
a
per
|
Weber, R. J., Moore, K., Kapustin, V., Clarke, A., Mauldin, R. L., Kosciuch, E., Cantrell, C., Eisele, F., Anderson, B., and Thornhill, L.: Nucleation in the equatorial pacific during PEM-tropics B: enhanced boundary layer H2SO4but no particle production: NASA global tropo-spheric experiment Pacific Exploratory Mission in the tropics phase B, Part 1: Measurement and analyses (PEM-Tropics B), J. Geophys. Res., 106, 32767–32776, 2001.
5
Woo, K. S., Chen, D. R., Pui, D. Y. H., and McMurry, P. H.: Measurement of Atlanta aerosol size distribution: observation of ultrafine particle events, Aerosol Sci. Tech., 34, 75–87, 2001.
ACPD
15, 21803–21835, 2015Seasonality of ultrafine and sub-micron aerosols
H. C. Cheung et al.
Title Page
Abstract Introduction
Conclusions References
Tables Figures
◭ ◮
◭ ◮
Back Close
Full Screen / Esc
Printer-friendly Version Interactive Discussion
Discussion
P
a
per
|
Discussion
P
a
per
|
Discussion
P
a
per
|
Discussion
P
a
per
|
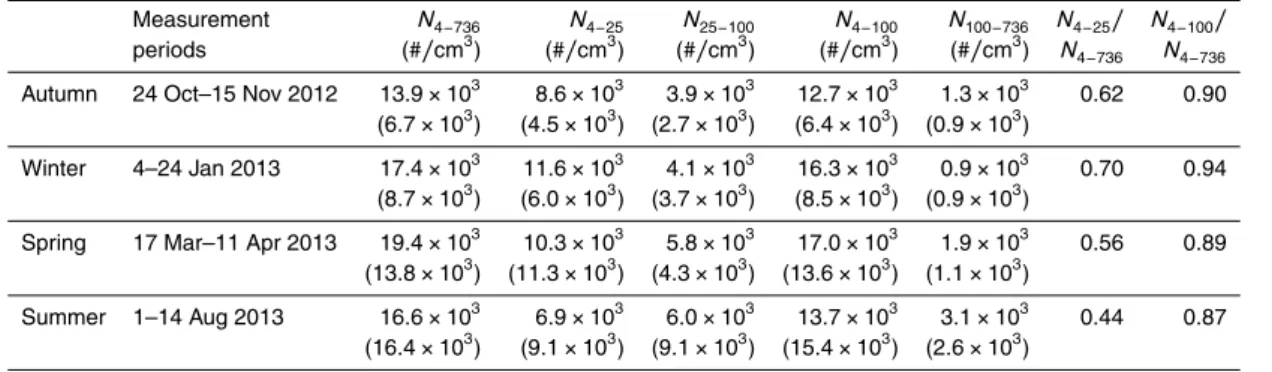
Table 1. Median and standard deviation of the PNCs measured in each season. The size
ranges of the PNCs are represented by the subscripted number. For example,N4−25, represents
the number concentrations of the particles from 4 to 25 nm.
Measurement N4−736 N4−25 N25−100 N4−100 N100−736 N4−25/ N4−100/
periods (#/cm3) (#/cm3) (#/cm3) (#/cm3) (#/cm3) N4−736 N4−736
Autumn 24 Oct–15 Nov 2012 13.9×10³ 8.6×10³ 3.9×10³ 12.7×10³ 1.3×10³ 0.62 0.90 (6.7×10³) (4.5×10³) (2.7×10³) (6.4×10³) (0.9×10³)
Winter 4–24 Jan 2013 17.4×10³ 11.6×10³ 4.1×10³ 16.3×10³ 0.9×10³ 0.70 0.94 (8.7×10³) (6.0×10³) (3.7×10³) (8.5×10³) (0.9×10³)
Spring 17 Mar–11 Apr 2013 19.4×10³ 10.3×10³ 5.8×10³ 17.0×10³ 1.9×10³ 0.56 0.89 (13.8×10³) (11.3×10³) (4.3×10³) (13.6×10³) (1.1×10³)
ACPD
15, 21803–21835, 2015Seasonality of ultrafine and sub-micron aerosols
H. C. Cheung et al.
Title Page
Abstract Introduction
Conclusions References
Tables Figures
◭ ◮
◭ ◮
Back Close
Full Screen / Esc
Printer-friendly Version Interactive Discussion
Discussion
P
a
per
|
Discussion
P
a
per
|
Discussion
P
a
per
|
Discussion
P
a
per
|
Table 2.Pearson correlation coefficient (r) and slope of linear regression of PNCs against NOx
during the nighttime (20:00–04:00 LT) in winter and summer periods.
Periods N4−25 N25−100 N100−736
Winter Slope 279 163 18
r 0.84 0.88 0.38
Summer Slope 239 330 155
r 0.76 0.87 0.70
ACPD
15, 21803–21835, 2015Seasonality of ultrafine and sub-micron aerosols
H. C. Cheung et al.
Title Page
Abstract Introduction
Conclusions References
Tables Figures
◭ ◮
◭ ◮
Back Close
Full Screen / Esc
Printer-friendly Version Interactive Discussion
Discussion
P
a
per
|
Discussion
P
a
per
|
Discussion
P
a
per
|
Discussion
P
a
per
|
Table 3.Median ofN4−25, PM10, UVB
∗
SO2, H2SO4proxy and wind speed of different seasons.
Periods N4−25 PM10 UVB
∗
SO2 H2SO4proxy Wind speed (cm−3
) (µg m−3
) (ppb W m−2
) (ppb W m−2
s) (m s−1
)
Autumn 8.6×10³ 53.9 2.46 75.2 2.82
Winter 11.6×10³ 48.4 2.24 113.2 2.34
Spring 10.5×10³ 61.1 3.01 67.8 2.17
Summer 6.9×10³ 35.6 7.28 271.1 2.35
∗
ACPD
15, 21803–21835, 2015Seasonality of ultrafine and sub-micron aerosols
H. C. Cheung et al.
Title Page
Abstract Introduction
Conclusions References
Tables Figures
◭ ◮
◭ ◮
Back Close
Full Screen / Esc
Printer-friendly Version Interactive Discussion
Discussion
P
a
per
|
Discussion
P
a
per
|
Discussion
P
a
per
|
Discussion
P
a
per
|
Figure 1.Back-trajectories calculated for TARO for the measurement periods (left panel) and
surface wind rose plots (right panel) in(a)autumn,(b)winter,(c)spring and(d)summer.
ACPD
15, 21803–21835, 2015Seasonality of ultrafine and sub-micron aerosols
H. C. Cheung et al.
Title Page
Abstract Introduction
Conclusions References
Tables Figures
◭ ◮
◭ ◮
Back Close
Full Screen / Esc
Printer-friendly Version Interactive Discussion
Discussion
P
a
per
|
Discussion
P
a
per
|
Discussion
P
a
per
|
Discussion
P
a
per
|
Figure 2.Size distribution of particle number (upper panel), surface and volume (lower panel)
ACPD
15, 21803–21835, 2015Seasonality of ultrafine and sub-micron aerosols
H. C. Cheung et al.
Title Page
Abstract Introduction
Conclusions References
Tables Figures
◭ ◮
◭ ◮
Back Close
Full Screen / Esc
Printer-friendly Version Interactive Discussion
Discussion
P
a
per
|
Discussion
P
a
per
|
Discussion
P
a
per
|
Discussion
P
a
per
|
(a) (b)
Figure 3.Seasonal concentration and composition of(a)ultra-fine (UFPs) and(b)sub-micron
(PM1) particles observed at the TARO in Taipei, Taiwan from autumn 2012 to summer 2013.
ACPD
15, 21803–21835, 2015Seasonality of ultrafine and sub-micron aerosols
H. C. Cheung et al.
Title Page
Abstract Introduction
Conclusions References
Tables Figures
◭ ◮
◭ ◮
Back Close
Full Screen / Esc
Printer-friendly Version Interactive Discussion
Discussion
P
a
per
|
Discussion
P
a
per
|
Discussion
P
a
per
|
Discussion
P
a
per
|
Figure 4.Median PSDs measured during the daytime (07:00–17:00 LT) and nighttime (17:00–
ACPD
15, 21803–21835, 2015Seasonality of ultrafine and sub-micron aerosols
H. C. Cheung et al.
Title Page
Abstract Introduction
Conclusions References
Tables Figures
◭ ◮
◭ ◮
Back Close
Full Screen / Esc
Printer-friendly Version Interactive Discussion
Discussion
P
a
per
|
Discussion
P
a
per
|
Discussion
P
a
per
|
Discussion
P
a
per
|
Figure 5.Scatter plots for PNCs vs. NOxmeasured during the time period of 20:00–04:00 (LT)
in(a)winter and(b)summer, with classification of various particle size ranges.
ACPD
15, 21803–21835, 2015Seasonality of ultrafine and sub-micron aerosols
H. C. Cheung et al.
Title Page
Abstract Introduction
Conclusions References
Tables Figures
◭ ◮
◭ ◮
Back Close
Full Screen / Esc
Printer-friendly Version Interactive Discussion
Discussion
P
a
per
|
Discussion
P
a
per
|
Discussion
P
a
per
|
Discussion
P
a
per
|
Figure 6.Time series of PSD, theN4−25,N25−100,N100−736, PM10, ozone (O3) and wind
ACPD
15, 21803–21835, 2015Seasonality of ultrafine and sub-micron aerosols
H. C. Cheung et al.
Title Page
Abstract Introduction
Conclusions References
Tables Figures
◭ ◮
◭ ◮
Back Close
Full Screen / Esc
Printer-friendly Version Interactive Discussion
Discussion
P
a
per
|
Discussion
P
a
per
|
Discussion
P
a
per
|
Discussion
P
a
per
|
Figure 7. Averaged PSDs for LRT and non-LRT episodes measured during the seasons of
winter monsoons. Dashed lines illustrate the PSD of each individual mode.
ACPD
15, 21803–21835, 2015Seasonality of ultrafine and sub-micron aerosols
H. C. Cheung et al.
Title Page
Abstract Introduction
Conclusions References
Tables Figures
◭ ◮
◭ ◮
Back Close
Full Screen / Esc
Printer-friendly Version Interactive Discussion
Discussion
P
a
per
|
Discussion
P
a
per
|
Discussion
P
a
per
|
Discussion
P
a
per
|
Figure 8.Scatter plots betweenN4−25and NOxobserved in(a)Autumn,(b)Winter,(c)Spring