Not Due to the Absence of Nucleotide Binding to the
Noncatalytic Nucleotide Binding Sites
Toru Ishikawa1, Yasuyuki Kato-Yamada1,2*
1Department of Life Science, Rikkyo University, Toshima-ku, Tokyo, Japan,2Research Center for Life Science, Rikkyo University, Toshima-ku, Tokyo, Japan
Abstract
F1-ATPase fromBacillus subtilis(BF1) is severely suppressed by the MgADP inhibition. Here, we have tested if this is due to
the loss of nucleotide binding to the noncatalytic site that is required for the activation. Measurements with a tryptophan mutant of BF1indicated that the noncatalytic sites could bind ATP normally. Furthermore, the mutant BF1that cannot bind
ATP to the noncatalytic sites showed much lower ATPase activity. It was concluded that the cause of strong MgADP inhibition of BF1is not the weak nucleotide binding to the noncatalytic sites but the other steps required for the activation.
Citation:Ishikawa T, Kato-Yamada Y (2014) Severe MgADP Inhibition ofBacillus subtilisF1-ATPase Is Not Due to the Absence of Nucleotide Binding to the Noncatalytic Nucleotide Binding Sites. PLoS ONE 9(9): e107197. doi:10.1371/journal.pone.0107197
Editor:Adam Driks, Loyola University Medical Center, United States of America
ReceivedFebruary 28, 2014;AcceptedAugust 13, 2014;PublishedSeptember 22, 2014
Copyright:ß2014 Ishikawa, Kato-Yamada. This is an open-access article distributed under the terms of the Creative Commons Attribution License, which permits unrestricted use, distribution, and reproduction in any medium, provided the original author and source are credited.
Funding:This work was supported in parts by the Grant-in-Aid for Young Scientists (B) (No. 23770157) from the Japanese Society for the Promotion of Science, the Strategic Research Foundation Grant-aided Project for Private Universities (No. S1201003) from the Ministry of Education, Culture, Sports, Science and Technology of Japan (www.mext.go.jp) (to Y. K.-Y.). The funders had no role in study design, data collection and analysis, decision to publish, or preparation of the manuscript.
Competing Interests:The authors have declared that no competing interests exist.
* Email: katoyama@rikkyo.ac.jp
Introduction
FoF1-ATPase/synthase (FoF1) catalyzes ATP synthesis from
ADP and inorganic phosphate coupled with the H+
flow driven by the electrochemical gradient of H+ across cellular membranes. FoF1consists of a water-soluble F1part (F1-ATPase) connected to
a membrane-embedded H+
channel, Fo [1–3]. F1-ATPase consists
of a3, b3, c, d and e subunits and its hydrolysis of one ATP
molecule at a catalytic site on thebsubunit drives a discrete 120u
rotation of the ce subunits relative to the a3b3d [4]. In FoF1,
rotation of the rotor subunits of F1(cande) is transferred to the c
subunit ring of Fo to couple ATP synthesis/hydrolysis and H+ flow.
The catalytic mechanism of ATP synthase has been extensively studied by structural studies and single-molecular experiments and the mechanism of the regulation of ATP synthase becomes attracting more interests. Several regulatory mechanisms are known: The mitochondrial ATP synthase has specific regulatory protein called IF1, which prevent ATP hydrolysis; The chloroplast
ATP synthase has a pair of cystein residues in thecsubunit and the formation of the disulfide between them inhibits the activity; Theesubunit of bacterial and chloroplast ATP synthase inhibits ATP hydrolysis: and so on. Among them, the most prominent is MgADP inhibition [5–7]. When the ATP hydrolysis product, MgADP, is tightly bound at a catalytic site, the F1-ATPase is
stalled. It is a common mechanism among all ATP synthases examined so far. Several factors are known to affect MgADP inhibition; Sodium azide stabilizes MgADP inhibition [6]: A detergent lauryldimethylamineN-oxide (LDAO) releases MgADP inhibition [8]: Incubation with Pi reduces MgADP inhibition [9]: and so on. It is also known that nucleotide binding to the noncatalytic nucleotide binding sites on the a subunits facilitate
escape from MgADP inhibition [10]. Thus, in the ATP hydrolysis reaction, initial high activity decreases with time due to the MgADP inhibition. Then F1 reaches equilibrium between active
and MgADP inhibited states, resulting in lower steady-state activity compared to the initial one [5,11].
Our recent study revealed that the ATPase activity of F1
-ATPase fromBacillus subtilis (BF1) is highly suppressed by the
MgADP inhibition [12]. The initial ATPase activity, which is not inhibited by the MgADP inhibition, falls down rapidly to several percent in the steady state [12]. That is very large inactivation compared to other F1-ATPases because they only fall into half, one
third or so [5,11]. LDAO activates BF1more than a hundredfold
[12] and this activation is also very large compared to those of other F1-ATPases (only several fold) [8]. Due in part to the strong
MgADP inhibition, BF1 has a strange ATP concentration
dependency of steady-state ATPase activity, the ATPase activity at 20,100mM ATP is lower than those at 1,10mM or
200,5000mM [12]. Interestingly, theesubunit does not inhibit
but activates BF1by releasing MgADP inhibition [12]. In bacterial
ATP synthases, the relationship between these two inhibitions must be very important to gain proper regulation fit for the physiological demand. Thus, studying such a characteristic behavior of BF1will help us to understand how the regulation of
ATP synthase varies depending on the environment where the source organisms live.
Studies with F1-ATPases from other species showed that the
ATP binding to the noncatalytic site promotes release of inhibitory MgADP from catalytic sites and results in the substantial activation [10,13]. A mutant F1-ATPase from thermophilic
BacillusPS3 (TF1) that cannot bind nucleotide to the noncatalytic
steady-state activity [13]. In eubacterial V-type ATPases, which is thought to have the same origin as F1-ATPases, the noncatalytic B
subunit does not bind nucleotide and V1-ATPase from Thermus
thermophilus HB8 showed strong MgADP inhibition and no
steady-state activity [14]. Inspired by these observations, we hypothesized that strong MgADP inhibition of BF1is due to the
inability of noncatalytic sites to bind nucleotide. To examine this hypothesis, we prepared a mutanta3b3ccomplex of BF1in which
nucleotide binding to the noncatalytic nucleotide binding sites can be monitored by the changes in the fluorescence from the tryptophan residues introduced near the noncatalytic sites. The result indicated that the noncatalytic sites of BF1could bind ATP.
Thus, the cause of strong MgADP inhibition of BF1is not the weak
binding ability of the noncatalytic sites but other steps required for the recovery from the MgADP inhibition. However, the mutant
a3b3c complex of BF1 that cannot bind nucleotide to the
noncatalytic sites showed lowered ATPase activity, indicating that the nucleotide binding to the noncatalytic sites has a substantial role for recovery from MgADP inhibition in BF1.
Materials and Methods
Plasmid construction and protein preparation
The mutation (aR354W), which corresponded to the same mutant ofEscherichia coliF1-ATPase (EF1) [15], was introduced
by overlap extension PCR method [16] with KOD-plus DNA polymerase (Toyobo) and following primers by using the expression plasmid for the wild type (WT) a3b3c complex of
BF1, pET21-BF1 [12] as a template. Mutagenic primers were 59
-CTCAGGCGTATGGCCAGCGATCAATGCCGG-39 and 59
-TTGATCGCTGGCCATACGCCTGAGAAGAAC-39 and the
franking primers were 59 -GCCGTATTGTAAACCCGC-TAGGCCAG-39 and 59 -TCTTGTGTGATGGCTGCTTGGC-GAG-39. The resulting 2.2 kbp DNA fragment was introduced into the EcoRV site of pZero2.1 vector (Novagen). Then the
0.8 kbp DNA fragment containing mutation was excised out by cutting this plasmid withNotI andNcoI. The fragment was put back to the original site of WT pET21-BF1 by ligating withNcoI/
BamHI fragment (1.2 kbp) andNotI/BamHI fragment (7.3 kbp)
of WT pET21-BF1. The resulting plasmid, pET21-BF1(aR354W) was used for protein expression. The mutations (aK175A/ T176A), which is known to suppress nucleotide binding to the noncatalytic site [13,17], were introduced in addition toaR354W by overlap extension PCR method with following primers by using pET21-BF1(aR354W) as a template. Mutagenic primers were 59 -CCGTCAAACAGGTGCAGCATCTGTTG-39and 59- ATCG-CAACAGATGCTGCACCTGTTTG-39and the franking prim-ers were 59-GAAATTAATACGACTCACTATAGG-39 and 59 -GATAAGCACTCCGTAAAACCGAACTG-39. The resulting 2.0 kbp DNA fragment was introduced into the EcoRV site of pZero2.1 vector (Novagen). Then the 1.6 kbp DNA fragment containing mutations was excised out by cutting this plasmid with XbaI andNcoI. The fragment was put back to the original site of pET21-BF1(aR354W) by ligating with NcoI/BamHI fragment (1.3 kbp) and XbaI/BamHI fragment (6.4 kbp) of pET21-BF1(aR354W). The resulting plasmid, pET21-BF1(aK175A/ T176A/R354W) was used for protein expression. Mutations were confirmed by DNA sequencing. WT (a3b3cWT),aR354W mutant
(a3b3cRW), and aK175A/T176A/R354W mutant (a3b3c DNC
)
a3b3ccomplexes of BF1 were prepared as described previously
[12].
Fluorescence measurement
The assay mixture consisted of 50 mM Tris-H2SO4(pH 7.5),
50 mM K2SO4 and 2 mM MgSO4 was transferred to a quartz
cuvette (1.5 ml). The cuvette was placed in a fluorescence spectrophotometer, FP-6500 (JASCO, Tokyo) and the tempera-ture was controlled to 25uC. Thea3b3ccomplex of BF1was added
to 100 nM. The concentrated ATP-Mg solution (a mixture of equal molar ATP and MgSO4) was injected into the cuvette at the
time indicated and the changes in the fluorescence were measured every 0.5 s or 1 s until the fluorescence reached a plateau. Excitation and emission wavelengths were set at 300 nm and 350 nm, respectively. Excitation and emission slit widths were 5 and 10 nm, respectively. The solution was stirred continuously Figure 1. Emission spectra ofa3b3cWTanda3b3cRWcomplexes of
BF1.Fluorescence emission spectra ofa3b3cWTanda3b3cRWcomplexes in the absence and presence of 1 mM ATP are shown. Excitation wavelength was 300 nm and the fluorescence emission spectra were recorded at 50 nm/min. Excitation and emission slit-widths were set at 5 and 10 nm, respectively. The fluorescence values are normalized to peak ofa3b3cRWin the absence of ATP as 100%. Solid line, dotted line, two-dot-chain line and dashed line representa3b3cRW-ATP,a3b3cRW+
ATP,a3b3cWT-ATP anda3b3cWT+ATP, respectively.
doi:10.1371/journal.pone.0107197.g001
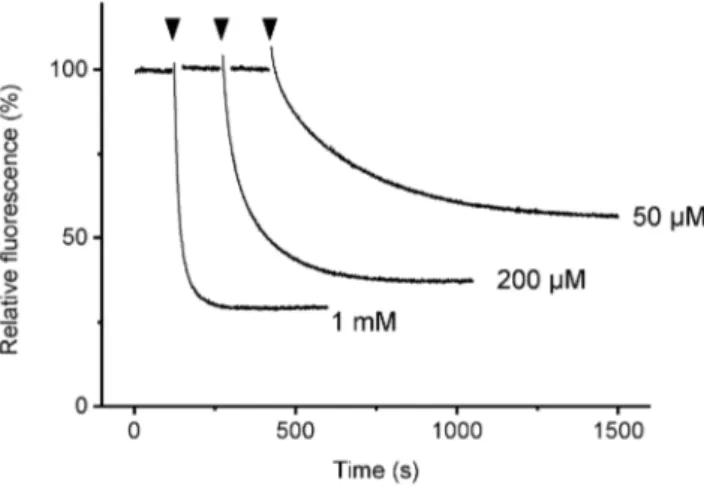
Figure 2. Time course of fluorescence change ofa3b3cRWupon
during the measurement. Emission spectra were measured before and after the time-course measurement at a rate 50 nm/min.
Fluorescence data analysis
The time course of the fluorescence was corrected for baseline with buffer. The fluorescence change at a plateau was plotted against the ATP concentration and fitted with the simple binding equation or the Hill equation by the computer software (Origin 9.0 J, Microcal Co.). The sum of two simple binding equations did not improve fitting (data not shown).
ATPase assay
ATPase activity was measured by NADH-coupled ATP-regenerating system at 25uC as described previously [12]. Reaction rates were determined at 3–5 s (initial) and 12–13 min (steady state) after the start of the reaction. The reaction rate in the presence of 0.1% LDAO was determined 100–150 s after the addition of LDAO.
Other methods
Protein concentration was determined by the method of Bradford [18] using bovine serum albumin as a standard. Chemicals were of the highest grades available.
Results and Discussion
Tryptophan fluorescence ofa3b3cRWwas completely quenched by the addition of ATP
The mutanta3b3c RW
showed large fluorescence compared to the WT (Fig. 1). Addition of ATP resulted in the quenching of fluorescence to the same level as the WT background, indicating that the fluorescence from tryptophan introduced near the noncatalytic sites was completely quenched by the addition of ATP. Thus, as reported on EF1 [15], tryptophan fluorescence
could be used as the indicator of nucleotide binding to the noncatalytic sites of the a3b3cRW complex. The time course of
fluorescence showed the ATP-concentration dependent rate and magnitude of fluorescence quenching (Fig. 2). There was a small jump in the fluorescence upon addition of ATP but this was not considered in the calculation of the degree of quenching. The titration with ATP showed an apparentKd= 34.4mM with simple
binding equation and an apparent Kd= 36.5mM and n= 1.47
with Hill equation (Fig. 3). These values were in the same range as that reported on EF1 (Kd of the noncatalytic site for MgATP is
25mM) [15]. It should be noted that the part of ATP will be
hydrolyzed into ADP and Pi and the noncatalytic sites will be filled with some combination of ATP and ADP depending on initial ATP concentration since the fluorescence measurement did not include pyruvate kinase, an ATP-regenerating enzyme. Neverthe-less, according to the results of ATPase measurement (Fig. 4), only a few percent of ATP was hydrolyzed before fluorescence reached the plateau (,100 s) at high concentrations of ATP such as 1 mM.
a3b3cRWWas inhibited severely even the noncatalytic sites were filled
Except for the lower steady-state activity, the mutanta3b3cRW
showed similar ATPase properties to thea3b3cWT(Fig. 4); very
Figure 4. ATPase activities ofa3b3ccomplexes.The initial (A) and steady-state (B) ATPase activities and ATPase activity in the presence of 0.1% LDAO (C) were determined. Hatched, open and solid bars represent a3b3cWT, a3b3cRW and a3b3cDNC, respectively. Error bars represent standard errors. Asterisks represent statistically significant differences (*p,0.05 and **p,0.01, Student’s t-test). Data for WT are taken from [12].
doi:10.1371/journal.pone.0107197.g004
Figure 3. Titration of fluorescence by ATP. Changes in the fluorescence upon addition of ATP are expressed as percent of the fluorescence before the addition of ATP. Values are taken when the fluorescence reached a plateau. Error bars represent standard errors. The solid line represents the theoretical curve with the Hill equation (Fluorescence quenching =DFLmax6[ATP]n/(K
dn+[ATP]n)) with the
fol-lowi ng p arameters (6 s t andard error); Kd= 3 6 . 561.2mM, DFLmax= 71.060.7%, n= 1.4760.1. The dotted line represents the theoretical curve with simple binding equation (Fluorescence quench-i n g =DF Lm a x6[ A T P ] / (Kd+[ A T P ] ) ) w i t h Kd= 3 4 . 462 . 9 mM , DFLmax= 73.561.5%.
a3b3cDNCShowed even lower ATPase activity
Since there are no obvious correlation between rate of very rapid inactivation [12] and that of nucleotide binding to the noncatalytic sites (Fig. 2), it was unclear that whether the nucleotide binding to the noncatalytic sites could facilitate release of inhibitory MgADP or not. To clarify this, we prepared the mutanta3b3ccomplex of BF1that contained mutations in Walker
A motif (a3b3c DNC
) to test if the nucleotide binding to the noncatalytic sites of BF1 promotes recovery from MgADP
inhibition, even if weak. With the a3b3c DNC
, no fluorescence quenching upon addition of ATP was observed (Fig. S1), indicating that the mutation totally abolished nucleotide binding to the noncatalytic sites as reported on TF1 [13]. The initial
ATPase activity of a3b3c DNC
complex was essentially the same level as the WT (Fig. 4A). However, the steady-state ATPase activity was much lower (2.7,13% of WT, Fig. 4B). Even in the
presence of LDAO, the activity was very low compared to the WT (10,13% of WT, Fig. 4C). These properties of the a3b3cDNC
complex were similar to those reported on the same mutant of TF1
[13,21], suggesting that the noncatalytic site of BF1 also has the
substantial role to facilitate the release of inhibitory MgADP from the catalytic sites even if low efficiency.
Conclusions
The noncatalytic nucleotide binding sites of BF1 can bind
nucleotides by the affinity similar to other F1-ATPases. From the
synthases, the degree of that varied considerably. There have been no report about such strong MgADP inhibition on other F1
-ATPases. To study what determines the degree of the MgADP inhibition may help us to understand the whole picture of the physiological regulation of ATP synthases from various species living in the various environment.
Supporting Information
Figure S1 Emission spectra ofa3b3cDNCof BF1.
Fluores-cence emission spectra ofa3b3cDNCin the absence and presence of
1 mM ATP were measured as Fig. 1. Solid line and dotted line represent in the absence and presence of ATP, respectively. The fluorescence values are normalized to peak in the absence of ATP as 100%.
(TIF)
Acknowledgments
We thank Dr. Takamitsu Haruyama (Kanazawa Univ.) and members of Kato-Yamada’s laboratory for their help and fruitful discussion.
Author Contributions
Conceived and designed the experiments: YKY. Performed the experi-ments: TI YKY. Analyzed the data: TI YKY. Wrote the paper: TI YKY.
References
1. Boyer PD (1997) The ATP synthase—a splendid molecular machine. Annu Rev Biochem 66: 717–749.
2. Yoshida M, Muneyuki E, Hisabori T (2001) ATP synthase—a marvellous rotary engine of the cell. Nat Rev Mol Cell Biol 2: 669–677.
3. Senior AE, Nadanaciva S, Weber J (2002) The molecular mechanism of ATP synthesis by F1Fo-ATP synthase. Biochim Biophys Acta 1553: 188–211.
4. Noji H, Yasuda R, Yoshida M, Kinosita K Jr (1997) Direct observation of the rotation of F1-ATPase. Nature 386: 299–302.
5. Vasilyeva EA, Minkov IB, FitinAF, Vinogradov AD (1982) Kinetic mechanism of mitochondrial adenosine triphosphatase. ADP-specific inhibition as revealed by the steady-state kinetics. Biochem J 202: 9–14.
6. Vasilyeva EA, Minkov IB, Fitin AF, Vinogradov AD (1982) Kinetic mechanism of mitochondrial adenosine triphosphatase. Inhibition by azide and activation by sulphite. Biochem J 202: 15–23.
7. Zhou J-M, Xue Z, Du Z, Melese T, Boyer PD (1988) Relationship of tightly bound ADP and ATP to control and catalysis by chloroplast ATP synthase. Biochemistry 27: 5129–5135.
8. Jault J-M, Dou C, Grodsky NB, Matsui T, Yoshida M, et al. (1996) The subcomplex of the F1-ATPase from the thermophilic Bacillus PS3 with the
bT165S substitution does not entrap inhibitory MgADP in a catalytic site during turnover. J Biol Chem 271: 28818–28824.
9. Drobinskaya IY, Kozlov IA, Murataliev MB, Vulfson EN (1985) Tightly bound adenosine diphosphate, which inhibits the activity of mitochondrial F1-ATPase,
is located at the catalytic site of the enzyme. FEBS lett 182: 419–424. 10. Jault J-M, Allison WS (1993) Slow binding of ATP to noncatalytic nucleotide
binding sites which accelerates catalysis is responsible for apparent negative
cooperativity exhibited by the bovine mitochondrial F1-ATPase. J Biol Chem
268: 1558–1566.
11. Hirono-Hara Y, Noji H, Nishiura M, Muneyuki E, Hara KY, et al. (2001) Pause and rotation of F1-ATPase during catalysis. Proc Natl Acad Sci U S A 98:
13649–13654.
12. Mizumoto J, Kikuchi Y, Nakanishi YH, Mouri N, Cai A, et al. (2013)eSubunit of Bacillus subtilis F1-ATPase relieves MgADP inhibition. PLoS ONE 8: e73888.
13. Matsui T, Muneyuki E, Honda M, Allison WS, Dou C, et al. (1997) Catalytic activity of thea3b3ccomplex of F1-ATPase without noncatalytic nucleotide
binding site. J Biol Chem 272: 8215–8221.
14. Yokoyama K, Muneyuki E, Amano T, Mizutani S, Yoshida M, et al. (1998) V-ATPase of Thermus thermophilus is inactivated during ATP hydrolysis but can synthesize ATP. J Biol Chem 273: 20504–20510.
15. Weber J, Wilke-Mounts S, Grell E, Senior AE (1994) Tryptophan fluorescence provides direct probe of nucleotide binding in the noncatalytic sites of Escherichia coli F1-ATPase. J Biol Chem 269: 11261–11268.
16. Higuchi R, Krummel B, Saiki RK (1988) A general method of in vitro preparation and specific mutagenesis of DNA fragments: study of protein and DNA interactions. Nucleic Acids Res 16: 7351–7367.
17. Ono S, Hara KY, Hirao J, Matsui T, Noji H, et al. (2003) Origin of apparent negative cooperativity of F1-ATPase. Biochim Biophys Acta 1607: 35–44.
19. Milgrom YM, Ehler LL, Boyer PD (1990) ATP binding at noncatalytic sites of soluble chloroplast F1-ATPase is required for expression of the enzyme activity.
J Biol Chem 265: 18725–18728.
20. Milgrom YM, Ehler LL, Boyer PD (1991) The characteristics and effect on catalysis of nucleotide binding to noncatalytic sites of chloroplast F1-ATPase.
J Biol Chem 266: 11551–11558.
21. Amano T, Matsui T, Muneyuki E, Noji H, Hara K, et al. (1999)a3b3cComplex
of F1-ATPase from thermophilic Bacillus PS3 can maintain steady-state ATP
hydrolysis activity depending on the number of non-catalytic sites. Biochem J 343: 135–138.
22. Jault J-M, Matsui T, Jault FM, Kaibara C, Muneyuki E, et al. (1995)a3b3c
Complex of the F1-ATPase from thermophilic Bacillus PS3 containing the
aD261N substitution fails to dissociate inhibitory MgADP from a catalytic site