ACPD
10, 8297–8339, 2010Implications for fire weather forecasting
D. Peterson et al.
Title Page
Abstract Introduction
Conclusions References
Tables Figures
◭ ◮
◭ ◮
Back Close
Full Screen / Esc
Printer-friendly Version
Interactive Discussion Atmos. Chem. Phys. Discuss., 10, 8297–8339, 2010
www.atmos-chem-phys-discuss.net/10/8297/2010/ © Author(s) 2010. This work is distributed under the Creative Commons Attribution 3.0 License.
Atmospheric Chemistry and Physics Discussions
This discussion paper is/has been under review for the journal Atmospheric Chemistry and Physics (ACP). Please refer to the corresponding final paper in ACP if available.
E
ff
ects of lightning and other
meteorological factors on fire activity in
the North American boreal forest:
implications for fire weather forecasting
D. Peterson1, J. Wang1, C. Ichoku2, and L. Remer2
1
Department of Geosciences, University of Nebraska-Lincoln, Lincoln, NE, USA
2
Laboratory for Atmospheres, NASA Goddard Space Flight Center, Greenbelt, MD, USA
Received: 22 February 2010 – Accepted: 18 March 2010 – Published: 31 March 2010
Correspondence to: J. Wang ([email protected])
ACPD
10, 8297–8339, 2010Implications for fire weather forecasting
D. Peterson et al.
Title Page
Abstract Introduction
Conclusions References
Tables Figures
◭ ◮
◭ ◮
Back Close
Full Screen / Esc
Printer-friendly Version
Interactive Discussion
Abstract
The effects of lightning and other meteorological factors on wildfire activity in the North American boreal forest were statistically analyzed during the fire seasons of 2000–2006 through an integration of the following data sets: the MODerate Resolution Imaging Spectroradiometer (MODIS) level 2 fire products, the 3-hourly 32-km gridded mete-5
orological data from North American Regional Reanalysis (NARR), and the lightning data collected by the Canadian Lightning Detection Network (CLDN) and the Alaska Lightning Detection Network (ALDN). Positive anomalies of the 500 hPa geopotential height field, convective available potential energy (CAPE), number of cloud-to-ground lightning strikes, and the number of consecutive dry days are found to be statistically 10
important to the seasonal variation of MODIS fire counts in a large portion of Canada and the entirety of Alaska. Analysis of fire occurrence patterns in the eastern and west-ern boreal forest regions shows that dry lightning strikes account for only 20% of the total lightning strikes, but are associated with (and likely cause) 40% of the MODIS ob-served fire counts in these regions. The chance for ignition increases when a threshold 15
of at least 10 dry strikes per NARR grid box and at least 10 consecutive dry days is reached. Due to the orientation of the large-scale synoptic pattern, complex differences in fire and lightning occurrence and variability were also found between the eastern and western sub-regions. Locations with a high percentage of dry strikes commonly expe-rience an increased number of fire counts, but the mean number of fire counts per dry 20
strike is more than 50% higher in western boreal forest sub-region, suggesting a ge-ographic and possible topge-ographic influence. While wet lightning events are found to occur with a large range of CAPE values, a high probability for dry lightning occurs only when 500 hPa geopotential heights are above∼5700 m and CAPE values are near the maximum observed level, underscoring the importance of low-level instability to boreal 25
ACPD
10, 8297–8339, 2010Implications for fire weather forecasting
D. Peterson et al.
Title Page
Abstract Introduction
Conclusions References
Tables Figures
◭ ◮
◭ ◮
Back Close
Full Screen / Esc
Printer-friendly Version
Interactive Discussion
1 Introduction
The boreal forest of North America, which is dominated by dense evergreen vegetation, covers an east-west oriented belt of land south of the tundra regions, and is a favorite spawning ground for wildfire activity each summer (Ichoku et al., 2008a). With plenty of available fuel to burn, wildfires often reach 200 hectares in size and are commonly left 5
to burn unimpeded because of their remoteness (Stocks et al., 2002). In Alaska alone, roughly 400 000 hectares burned annually during the period 1990 to 1996 (Boles and Verbyla, 2000). In the large boreal forest in Canada, 2.75 million hectares was found to burn annually during the 1990s (Stocks et al., 2002). In addition to the ecological health hazard and change in surface albedo caused by biomass burning, enormous amounts 10
of particulate matter, as well as carbon monoxide, carbon dioxide, methane, and other trace gases are emitted into the atmosphere, creating concerns for air quality and other atmospheric impacts (e.g. Spracklen et al., 2007; Jordan et al., 2008). The need for an accurate assessment of direct and indirect fire impacts including the development of effective mitigation strategies underscores the importance of studying the potential 15
causes of wildfire ignition in the boreal region.
Attempts have been made during the past several decades to discern the role of local meteorology, topography, climate, and land use in the formation of intense boreal fire seasons (e.g. Skinner et al., 1999; Stocks et al., 2002). Flannigan and Harring-ton (1988) described the enhanced effect of prolonged dry and warm periods on fire 20
intensity and duration. Skinner et al. (1999, 2002) showed that regions under the influence of positive 500 hPa geopotential height anomalies in Canada commonly ex-perience above average fire seasons. In addition, Fauria and Johnson (2006) found that positive height anomalies must persist for approximately 10 days to have a signifi-cant impact on fire activity. These earlier studies suggest that persistent positive height 25
ACPD
10, 8297–8339, 2010Implications for fire weather forecasting
D. Peterson et al.
Title Page
Abstract Introduction
Conclusions References
Tables Figures
◭ ◮
◭ ◮
Back Close
Full Screen / Esc
Printer-friendly Version
Interactive Discussion 1996 was a result of lightning-started fires, and Stocks et al. (2002) found that∼72%
of the large fires in Canada during 1959–1997 were associated with lightning activity. These fires are sparked by thunderstorms producing “dry” lightning, which can occur by any of the following scenarios: (a) the thunderstorm is high-based and most of the precipitation evaporates before reaching the ground; (b) lightning strikes outside the 5
rain shaft of a “wet” thunderstorm; (c) lightning occurs with a rapidly moving thunder-storm where rainfall does not have sufficient time to accumulate (Rorig and Ferguson, 1999, 2002).
Several fire weather indices have also been developed to guide forecasts for the po-tential of fire ignition and spread. The Haines Index, which is widely used in the United 10
States, is an integer scale (1–6) that indicates the potential for fire ignition and growth based on two equally weighted ingredients for moisture and stability, respectively de-rived from the surface dew point depression and atmospheric lapse rate (Haines, 1988; Potter et al., 2008). Unstable conditions in the lower troposphere commonly result in a greater chance for lightning strikes, higher smoke plumes, stronger entrainment of the 15
air near the fires, and faster spread rate, all of which can lead to “extreme fire behavior” (Werth and Ochoa, 1993).
In contrast to the Haines Index, the fire indices used in the Canadian boreal forest regions generally disregard atmospheric instability variables and put more focus on biomass moisture content. For example, the Canadian Fire Weather Index (FWI) is 20
based on the use of surface temperature, relative humidity, rainfall, and wind speed to derive the amount of biomass moisture content used for assessing fire potential and spreading in the unique boreal ecosystem (Amiro et al., 2004). The same index is also used in Alaska to complement their own Alaska Fire Potential Index (FPI), which is an integer scale from 1 to 100 ranking the level of biomass moisture content for specific 25
vegetation types based on the satellite derived Normalized Difference Vegetation Index (NDVI) along with other surface observations (Burgan et al., 1998).
ACPD
10, 8297–8339, 2010Implications for fire weather forecasting
D. Peterson et al.
Title Page
Abstract Introduction
Conclusions References
Tables Figures
◭ ◮
◭ ◮
Back Close
Full Screen / Esc
Printer-friendly Version
Interactive Discussion has not been quantitatively analyzed. This analysis is paramount to explaining the
regional and interannual variability of wildfires in boreal North America. Even with in-stability recognized as a fundamental component of the Haines Index, there has never been an attempt to quantitatively assess the importance of this variable in fire ignition, especially over large temporal and spatial scales in the boreal forest. Furthermore, 5
instability is paramount in determining the potential for convection and dry lightning (Rorig and Ferguson, 1999, 2002); but little work has been done to investigate its rela-tionship with dry lightning strikes and fire locations across boreal North America.
The lack of a study on possible relationships between low-level instability and other meteorology factors in the formation of lightning and fire ignition is partially due to the 10
dearth of spatiotemporally collocated meteorological, lightning, and fire data. Often, scattered reports of weather, fire, and burned area from ground observations are used to characterize fire variability. Admittedly, these reports are not very reliable in de-scribing the fire spatial distribution, temporal distribution (including the start and end dates), and intensity over the vast, sparsely populated boreal forests (Stocks et al., 15
2002; Flannigan and Wotton, 1991).
This study builds upon the following observational advancements to systematically investigate the cause of the variability in wildfire activity throughout boreal North Amer-ica: (a) the development of ground-based lightning observation network with large spa-tial coverage in Alaska and Canada; (b) the high spatiotemporal meteorological reanal-20
ysis over North America; and (c) the near daily measurements of fire location and intensity with global coverage from NASA’s MODerate Resolution Imaging Spectrora-diometer (MODIS). In addition to discerning fire locations with unprecedented accuracy (e.g. Justice et al., 2002), MODIS can measure fire radiative power (FRP), a parame-ter directly reflecting fire intensity and emission. This product, pioneered by MODIS, 25
ACPD
10, 8297–8339, 2010Implications for fire weather forecasting
D. Peterson et al.
Title Page
Abstract Introduction
Conclusions References
Tables Figures
◭ ◮
◭ ◮
Back Close
Full Screen / Esc
Printer-friendly Version
Interactive Discussion the effect of lightning on boreal fire activity characterized by MODIS for the fire
sea-sons of 2000–2006. Section 2 of this paper describes the regions of study. Section 3 describes each data source in detail and the data integration algorithm. Sections 4 and 5 respectively present the spatiotemporal statistical analysis for a large-scale and focused sub-regional analysis. Section 6 addresses the specific causes of dry lighting 5
and their effects on fire ignition using a grid-based joint probability analysis.
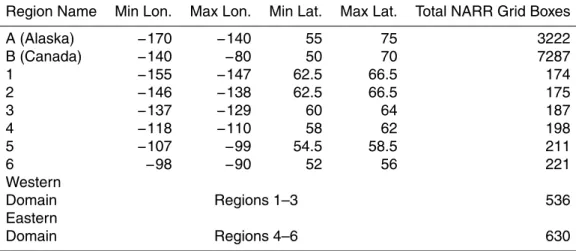
2 Regions and time period of study
As shown in Fig. 1, the North American boreal forest is divided into two large regions including the majority of Alaska (region A) and a portion of Canada west of the Great Lakes and Hudson Bay (region B). The boundaries of these two regions (defined in 10
Table 1) follow that of Ichoku et al. (2008a) in which 36 regions, each containing a dominant ecosystem type (such as boreal forest in this study), are defined across the globe to study MODIS-observed wildfire patterns and intensity. The low human pop-ulation in this portion of the boreal forest coupled with the results from earlier studies describing the influence of lightning strikes as the main ignition source (Stocks et al., 15
2002; Boles and Verbyla, 2000), justifies the assumption that any anthropogenic influ-ence is minimal in regions A and B.
While the large areas of regions A and B are suitable for studying the variability of fires in large temporal (monthly to yearly) and spatial (synoptic) scales, detailed analysis of meteorological factors affecting fire ignition requires the investigation of fire 20
variability in the core of boreal forest at fine spatial and temporal scales. For this pur-pose, 6 smaller regions (defined in Table 1 and labeled from 1 through 6 in Fig. 1) are created to include only the core of the boreal forest belt with the caveat that it is nearly impossible for each region to contain exactly the same type of vegetation. Because re-gions 1–3 are located in the mountainous boreal forest of Alaska and Canada, they are 25
ACPD
10, 8297–8339, 2010Implications for fire weather forecasting
D. Peterson et al.
Title Page
Abstract Introduction
Conclusions References
Tables Figures
◭ ◮
◭ ◮
Back Close
Full Screen / Esc
Printer-friendly Version
Interactive Discussion Such grouping allows the analysis to focus on the effect of meteorological factors on
fire ignition in each domain, while the likely effect of a positive relationship between lightning strikes and elevation, as shown in previous studies (e.g. Reap, 1991; Diss-ing and Verbyla, 2003), only influences the western domain. Furthermore, the eastern domain includes the portion of Canada known to have the highest frequency of fires, 5
where up to 0.74% of the total land area burns annually (Stocks et al., 2002; Skinner et al., 2002), and the western domain covers nearly all of the boreal forest in Alaska known to have regular fire activity.
The fire season (when the vast majority of fires occur) in the high latitudes is limited by the duration of a short warm season from June to August (Skinner et al., 1999; 10
Stocks et al., 2002; Fauria and Johnson, 2006). Therefore, the fire variability in this three-month time period beginning in 2000 (when the MODIS fire data starts) and ending in 2006 (when this study began) is the focus of this investigation. Consequently, the data are collected and integrated accordingly to match the time period and regions of this study described above.
15
3 Data description and integration
3.1 MODIS fire products
The MODIS sensor aboard the polar-orbiting Terra satellite (launched 19 December 1999) provides all of the fire data used in this study. Specifically, this study uses the MODIS level 2, collection 4 fire product with a spatial resolution of 1 km at nadir (Giglio 20
et al., 2003; Ichoku et al., 2008a). Terra MODIS has a swath width of 2330 km with equator crossing times of 10:30 a.m. and 10:30 p.m. local time (Kaufman et al., 2003). Its swaths overlap poleward of 50◦latitude, resulting in complete daytime and nighttime spatial coverage every 24 h for the boreal forest including the general study region of North America (50–75◦N) used in this study (e.g. Ichoku et al., 2008a).
ACPD
10, 8297–8339, 2010Implications for fire weather forecasting
D. Peterson et al.
Title Page
Abstract Introduction
Conclusions References
Tables Figures
◭ ◮
◭ ◮
Back Close
Full Screen / Esc
Printer-friendly Version
Interactive Discussion When compared to earlier satellite sensors, MODIS is unparalleled in fire
detec-tion because of its ability to differentiate a wide range of fire intensities, as a result of the synergy between its two 4 µm (more precisely 3.96 µm) channels whose dynamic ranges are complementary. The first 4 µm channel with a low signal-to-noise ratio sat-urates at 331 K brightness temperature, and thus serves as the primary channel for fire 5
detection (Justice et al., 2002); the second channel saturates at 500 K and is used to detect fires with brightness temperatures higher than 331 K (Justice et al., 2002). Other satellites with fire detection capabilities, such as the Advanced Very High Resolution Radiometer (AVHRR) and the Along Track Scanning Radiometer (ASTR), have much lower saturation brightness temperatures of about 325 K and 312 K respectively (e.g. 10
Gao et al., 2007; Kelha et al., 2003), and are not capable of distinguishing between weak and intense fires.
The MODIS fire detection algorithms retrieve fire locations through a hybrid, contex-tual process beginning with the absolute detection of a fire pixel. A set of thresholds for reflectance at 0.86 µm and brightness temperature (T) at the 4 µm and 11 µm infrared 15
channels (hereafter T4 and T11) are used to remove sun glint, cloudy pixels, and to
identify potential fire pixel (Justice et al., 2002; Giglio et al., 2003). Potential fire pixels are defined as those withT4>325 K (>310 K) and T4−T11>20 K (>10 K) for daytime
(night) observations (Giglio et al., 2003). The second step is relative fire detection, which relates the brightness temperature of the potential fire pixel with the surround-20
ing background pixels and applies to all cloud-free and sun glint-free pixels regardless of their classification in the first step. A neighborhood search is conducted within a square window that progressively widens as necessary around a potential fire pixel un-til at least 25% of the pixels in the square are valid background pixels (absence of fire) and the number of these valid pixels is at least eight. If enough valid background pixels 25
are found, the mean and absolute deviation of theirT4,T11, andT4−T11 are computed
ACPD
10, 8297–8339, 2010Implications for fire weather forecasting
D. Peterson et al.
Title Page
Abstract Introduction
Conclusions References
Tables Figures
◭ ◮
◭ ◮
Back Close
Full Screen / Esc
Printer-friendly Version
Interactive Discussion In addition to discerning fire location and brightness temperature, the MODIS fire
algorithm also retrieves the fire radiative power (FRP) using only the 4 µm channels: (Kaufman et al., 1998a, b): FRP=4.34×10⁻¹⁹(T48−T48b) where T4b is the background temperature, yielding FRP in units of MW per pixel area (Kaufman et al., 1998a). It has been shown that the FRP can be used as a quantitative indicator for fire intensity and is 5
proportional to both the fire’s fuel consumption and smoke emission rates (e.g. Wooster et al., 2002, 2003, 2005; Ichoku and Kaufman 2005; Roberts et al., 2005, 2008; Ichoku et al., 2008a, 2008b; Jordan et al., 2008). In contrast to earlier sensors, MODIS is currently the only operational satellite sensor designed to specifically measure FRP globally (e.g. Kaufman et al., 1998a, b; Ichoku et al., 2008a). The higher saturation 10
temperatures of MODIS allow for the derivation of FRP for nearly every fire it detects, because fires withT4≫500 K seldom occur (Ichoku et al., 2008a).
The major caveats of the MODIS fire products in the boreal regions are sun glint, coastal false alarms (water reflectance), and clouds that may hamper the fire detection. These non-idealities are accounted for by applying water masks and cloud masks in 15
the fire detection algorithm (Kaufman et al., 1998a; Giglio et al., 2003). Validation studies showed that the probability of fire detection by the collection 4 algorithm in the boreal forest is∼80–100% during the day and near 100% at night (Giglio et al., 2003). The smallest detectable fire size in any given pixel was found to be∼100 m2(Giglio et
al., 2003). Though hard to validate directly and globally, MODIS FRP was found to be 20
in good agreement with in situ measurements in several case studies (Wooster et al., 2003; Roberts et al., 2005; Ichoku et al., 2008a).
3.2 Meteorological data
Meteorological data are obtained from the North American Regional Reanalysis (NARR) database archived at the National Climatic Data Center (NCDC). Through 25
ACPD
10, 8297–8339, 2010Implications for fire weather forecasting
D. Peterson et al.
Title Page
Abstract Introduction
Conclusions References
Tables Figures
◭ ◮
◭ ◮
Back Close
Full Screen / Esc
Printer-friendly Version
Interactive Discussion surface variables (Ebisuzaki, 2004; Mesinger, 2006). The specific number of NARR
grid boxes per study region ranges from 500–600 in the eastern and western domains to over 3000 in regions A and B (Table 1). A collection of NARR monthly means and 3-hourly data for several meteorological variables including soil and atmospheric mois-ture, instability, precipitation, etc. are used for analysis (Table 2). The surface-based 5
convective available potential energy (CAPE) is used to address the role of low-level instability. Commonly included in convective forecasts, CAPE is directly related to the maximum potential vertical speed within an updraft; therefore, higher values indicate a greater potential for convection (thunderstorms).
3.3 Lightning data
10
Lightning data were obtained from the Canadian Lightning Detection Network (CLDN) owned by Environment Canada and the US Bureau of Land Management’s Alaska Lightning Detection Network (ALDN). For the purposes of this paper, only cloud-to-ground (CG) discharges were considered. CG lightning commonly consists of several separate strokes (multiplicity) forming the individual flash. However, in this study, each 15
large lightning flash was considered as a single strike regardless of the multiplicity. The lightning location and timing are measured from sensors using the time-of-arrival method or a combination of time-of-arrival and direction finding (Cummins et al., 1998; Burrows et al., 2002). Specifically, the CLDN uses 82 sensors across the country and roughly 34 of these are located in region B (Burrows et al., 2002). The ALDN uses 9 20
sensors concentrated in the center of the state (region A) where the majority of lightning events are known to occur (Dissing and Verbyla, 2003). The combination of sensors from the CLDN and ALDN provides spatial coverage for all relevant regions used in this study. Furthermore, the detection efficiency of CG lightning in the CLDN (ALDN) is roughly 85–90% (80%) with a positional accuracy of 500 m (1 km) or better (Burrows 25
ACPD
10, 8297–8339, 2010Implications for fire weather forecasting
D. Peterson et al.
Title Page
Abstract Introduction
Conclusions References
Tables Figures
◭ ◮
◭ ◮
Back Close
Full Screen / Esc
Printer-friendly Version
Interactive Discussion
3.4 Data integration
In order to facilitate our analysis, the MODIS fire data and the lightning data points are geographically matched into the mesh of NARR grid boxes. The matching algorithm computes the distance between each data point and the center of a grid box using spherical coordinates, and accounts for the variation (5–8 km) of the NARR’s grid size 5
(∼32 km in average) in the Lambert Conformal Conic projection. The number of light-ning strikes and fire counts in each NARR grid box are respectively summed for each day. As a result, the matching algorithm generates an integrated, gridded dataset that includes the means of each meteorological variable (derived from the 3-hourly NARR data), the total number of lightning strikes, and the Terra MODIS fire counts at each 10
NARR grid box for each day.
Several new variables important for discerning atmospheric regimes for igniting fires are derived from the integrated dataset at each NARR grid box including: the number of dry and wet days, the number of dry and wet lightning strikes, and the daily maximum temperature (Table 2). Dry (wet) days are simply a running total of days for each 15
NARR grid box where less than 2 mm (≥2 mm) of precipitation is observed during the
24-h period. The dry (wet) day variable is set to zero when a grid box receives a precipitation amount≥2 mm (<2 mm). Similarly, dry (wet) lightning strikes are defined as any strike occurring in a NARR grid box that receives less than 2 mm (≥2 mm) of
precipitation for each daily time step. The 2 mm threshold used here is similar to that 20
used in Hall (2007) and less than the 2.54 mm value used in Rorig and Ferguson (1999, 2001). In contrast to earlier studies of dry lightning activity using precipitation data from scattered surface observations, this study allows for a unique, high-resolution dataset of dry lightning activity across the entirety of northern North America, regardless of population and instrument placement.
ACPD
10, 8297–8339, 2010Implications for fire weather forecasting
D. Peterson et al.
Title Page
Abstract Introduction
Conclusions References
Tables Figures
◭ ◮
◭ ◮
Back Close
Full Screen / Esc
Printer-friendly Version
Interactive Discussion
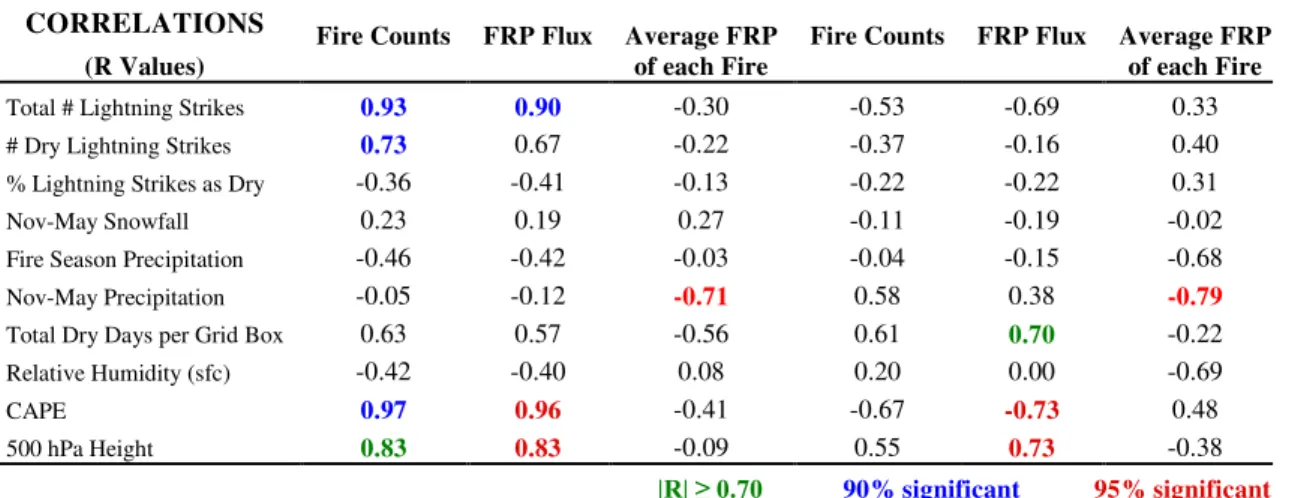
4 Large-scale analysis
To provide a general representation of the meteorological factors responsible for the interannual variability of fire activity, the Pearson correlation coefficients (R) are com-puted between the fire, lightning, and meteorological parameters for region A and B based upon the seasonal-mean of the analysis variables in Table 2. To represent fire 5
intensity, the average FRP per fire pixel (FRPavg), and the FRP flux (FRPf), defined as
the total FRP divided by the total land area within each regional domain, are also used. Following this analysis, only a few key meteorological variables stand out as statisti-cally significant (Table 3), and they are analyzed comparatively and independently in each region (A and B).
10
4.1 Role of moisture in fire variability
As expected, both relative humidity (RH) and fire season precipitation show a nega-tive correlation with the fire data in region A. However, the weakness of this neganega-tive correlation (e.g. Rfire count=−0.42 and RFRPf=−0.40) is a surprise because moisture
is generally considered as a key component in many of the fire weather indices such 15
as the FPI and FWI used in boreal North America. In region B, the influence from RH and fire season precipitation is even less with RH displaying a weak positive corre-lation. While necessary for short-term forecasts of fire potential and behavior, these variables do not seem to be major factors affecting the interannual variability in the boreal regions.
20
In contrast, the derived consecutive dry days variable does show a relatively strong, positive correlation with fire counts and FRPf in both regions withRfire count=0.63 and
RFRPf=0.57 (Rfire count=0.61 andRFRPf=0.70) in region A (region B). This result
quan-titatively supports the hypothesis made in earlier studies, with limited ground-based data (e.g. Flannigan and Harrington, 1988), that the role of the duration of dry con-25
ACPD
10, 8297–8339, 2010Implications for fire weather forecasting
D. Peterson et al.
Title Page
Abstract Introduction
Conclusions References
Tables Figures
◭ ◮
◭ ◮
Back Close
Full Screen / Esc
Printer-friendly Version
Interactive Discussion with ample precipitation may still be active if there is a long stretch of dry conditions
between wet periods. Furthermore, the upper layer of soil and plant debris would be greatly affected by a long stretch of dry days, and the moisture at this particular layer is indeed the major moisture parameter considered in the Canadian Fire Weather Index (Amiro et al., 2004).
5
When investigating the FRPavg of each individual fire count, only the precipitation
prior to the start of the fire season (November–May) stands out withR=−0.71 in
re-gion A. The pre-season precipitation variable is also important to fire season variability in region B withR=−0.79. Following a dry winter and/or spring, forest vegetation, es-pecially smaller undergrowth, will not grow as healthy. This allows for more dead plant 10
material during the fire season providing a greater quantity of available fuel and results in fires that burn hotter and/or grow larger. Therefore, the FRP can easily increase especially if conditions become anomalously dry during the actual fire season.
4.2 Role of instability and lightning in fire variability
Consistent with earlier studies (e.g. Skinner et al., 1999, 2002; Fauria and Johnson, 15
2006), the 500 hPa geopotential heights display a positive relationship (R=0.83) with the fire counts in region A, suggesting that anomalously high 500 hPa heights set the stage for active fire weather periods in this region. Three parameters affected by the 500 hPa height pattern (the surface-based CAPE, total cloud-to-ground lightning strikes, and total dry lightning strikes) are also immediately evident as important vari-20
ables in region A with R=0.97, R=0.93, and R=0.73, respectively. Similar results are obtained when using the FRPf, suggesting that changes in instability and
light-ning activity associated with the large-scale pattern influence both the number and the intensity of fires in region A (Alaska).
Conversely, 500 hpa geopotential heights, instability (CAPE), and lightning strikes 25
are weakly correlated with fire counts in region B, with respective R values of 0.55,
ACPD
10, 8297–8339, 2010Implications for fire weather forecasting
D. Peterson et al.
Title Page
Abstract Introduction
Conclusions References
Tables Figures
◭ ◮
◭ ◮
Back Close
Full Screen / Esc
Printer-friendly Version
Interactive Discussion region B are likely due to the height gradient between a ridge and a trough at 500 hPa
bisecting this region in the seasonal mean with a ridge present in the west and trough in the east (contours in Fig. 1). This pattern creates a highly variable environment with respect to geopotential height just east of the Canadian Rockies that does not allow a specific synoptic pattern to remain in place for long temporal durations (Skinner et al., 5
2002).
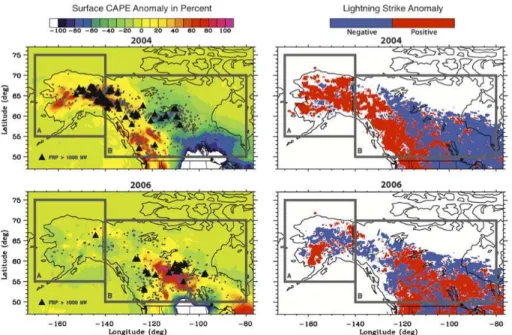
Geographical examples for interpreting the statistical results revealed in the above analysis are shown in Fig. 2. The fire season of 2006, which follows a traditional synoptic setup for an active fire season in central Canada (Skinner et al., 2002), con-forms to the expectation that the distribution of anomalously high CAPE and lightning 10
strikes will coincide with the highest concentration of fire counts and high FRP values (>1000 MW). In contrast, there is an unconformity in central Canada immediately east of the Rocky Mountains during the fire season of 2004, the most active fire season of the seven-year study period in both region A and B. Previous studies have shown similar examples where a certain amount of fire activity occurs within the trough in the 15
seasonal 500 hPa height mean (e.g. Skinner et al., 2002) suggesting that the 500 hPa height is not a perfect tool for assessing fire variability under certain synoptic environ-ments in every region of the boreal forest. Therefore, it is also obvious that discrepan-cies may exist between the meteorological setups producing the dry lightning events that ultimately ignite fires across the boreal forest.
20
5 Focused sub-regional analysis
While the large-scale analysis (regions A and B) in the previous section is helpful to-ward a general understanding of the effects of the synoptic pattern on fire activity, a finer spatial (eastern and western domains) and temporal (daily) analysis is neces-sary for understanding the meteorological factors favorable to lightning activity and 25
to-ACPD
10, 8297–8339, 2010Implications for fire weather forecasting
D. Peterson et al.
Title Page
Abstract Introduction
Conclusions References
Tables Figures
◭ ◮
◭ ◮
Back Close
Full Screen / Esc
Printer-friendly Version
Interactive Discussion tal lightning strikes) considered as important for fire ignition showed little correlation
with the average FRP per fire pixel. With lightning activity recognized as the major cause of boreal fire ignition, the following sub-regional analysis focuses on the mete-orological influences on lightning activity and its effect on the variation of fire counts. Detailed analysis of meteorological variables and their effects on fire intensity (FRPf 5
and FRPavg) will be left for a future study.
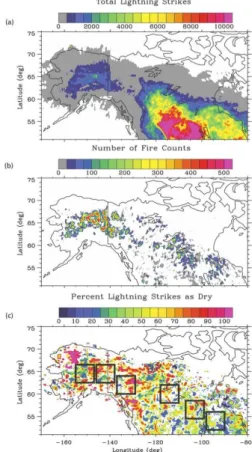
5.1 Spatial and temporal variation of lightning and fire counts
Figure 3a shows the total number of lightning strikes per NARR grid box observed dur-ing the 7-year study period, indicatdur-ing a general increase of lightndur-ing activity from the coast to the interior regions of Canada and Alaska especially in the southern portions 10
of the boreal forest. Quantitatively, the general location of the eastern domain expe-riences much more lightning activity (often 2000–6000 strikes per grid box) than the western domain (often 500–2000 strikes per grid box). However, the western domain does coincide with a local maximum of lightning activity in interior Alaska and Canada. The distribution of total fire counts in each NARR grid box (Fig. 3b) shows the oppo-15
site pattern as that for lightning (Fig. 3a). Specifically, the majority of grid boxes in the western domain experienced ∼400–500 fire counts during the seven-year study time period while only a few grid boxes in the eastern domain approached 300 fire counts.
To study the difference in spatial patterns between Fig. 3a and b, the distribution of the percentage of lightning strikes occurring as dry strikes per grid box is computed 20
(Fig. 3c). Interestingly, dry strikes, which have been found to be the dominant driver of fire variability in the boreal forest (Boles and Verbyla, 2000; Stocks et al. 2002), are only a small portion of the total lightning activity. For example, only 23% (21%) of all observed lightning strikes are dry in the western (eastern) domain. From a monthly perspective, 27–31% (23–24%) of lightning strikes are dry in June and August while 25
ACPD
10, 8297–8339, 2010Implications for fire weather forecasting
D. Peterson et al.
Title Page
Abstract Introduction
Conclusions References
Tables Figures
◭ ◮
◭ ◮
Back Close
Full Screen / Esc
Printer-friendly Version
Interactive Discussion Geographically, the western domain contains the highest percentage of dry lightning
strikes with several individual grid boxes greater than 80%. These localized values are much higher than the averaged percentage of dry strikes in the western domain as a whole (23%) because there are many more grid boxes with less than 40% dry strike activity. Therefore, localized influences, such as topography, likely affect the distribution 5
between high percentage and low percentage dry strike grid boxes. Previous work has shown a positive relationship between total lightning strikes and elevation (Reap, 1991; Dissing and Verbyla, 2003), but the effect of topography on only dry strikes is still unclear.
Regardless of potential topographical influences, the western and eastern boreal 10
domains contain a greater quantity of grid boxes with a high percentage of dry strikes than non-forested locations to the south. In addition, the individual grid boxes (within the eastern and western domains) with a high percentage of dry strike activity com-monly experience a greater number of fire counts over the seven-year study period. Hence, while the average percentage of dry strikes is low in both the eastern and west-15
ern domain, the percentage of dry strikes per grid box qualitatively appears to reconcile the discrepancies between total lightning strikes (Fig. 3a) and fire activity (Fig. 3b).
5.2 Temporal segment correlations and holdover effect analysis
While Fig. 3 is consistent with the large-scale analysis in Table 3 suggesting that light-ning activity is positively correlated with fire counts in the western domain but not in the 20
eastern domain, it is worth noting that such correlation analysis is done at the seasonal scale using averages over large regions (A and B) where considerable portions are not covered by the boreal forest. To further study the lightning effects on fire ignition, the following two questions become relevant: (1) does the same correlation contrast be-tween west and east (shown in Table 3) change at varying time scales when focusing 25
ACPD
10, 8297–8339, 2010Implications for fire weather forecasting
D. Peterson et al.
Title Page
Abstract Introduction
Conclusions References
Tables Figures
◭ ◮
◭ ◮
Back Close
Full Screen / Esc
Printer-friendly Version
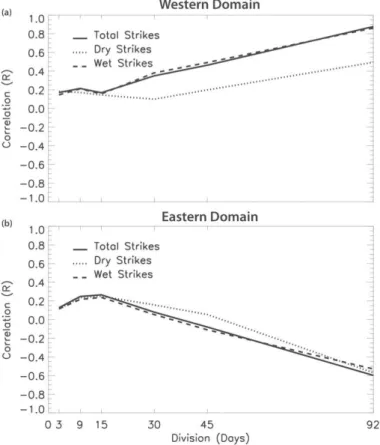
Interactive Discussion To address the first question, a temporal segment correlation analysis is conducted
by dividing the fire season (92 days) into a series of temporal segments (ranging from 3–92 days) with an equal length of days for each year. Using the seven years of data, the correlation coefficients between fire counts and dry, wet, and total lightning strikes are then computed based upon the averages over each individual temporal 5
segment in both the eastern and western domains (Fig. 4a, b). It is expected that such a correlation should increase as the length of the segment reaches the total number of days for the season and hence, many localized (and somewhat random) processes will be averaged out to allow the dominant mechanisms for the interannual variability to stand out.
10
The western domain follows the expected result nicely with R-values increasing from 0.20 at segment length of 9 days to 0.80 at the seasonal cutoff (Fig. 4a). However, the eastern domain deviates from the expectation after the 15-day division withR ap-proaching −0.60 by the seasonal cutoff (Fig. 4b). This result is likely related to the
mechanisms responsible for lightning activity in each domain. In the western domain, 15
prolific lightning activity only occurs in active fire years because this is when the large-scale pattern becomes conducive to enhanced thunderstorm development in these high latitudes by allowing low-level instability (CAPE) to increase dramatically (Skinner et al., 1999; Dissing and Verbyla, 2003). Furthermore, the synoptic pattern displays limited fire season variability in the region encompassing the western domain (Skinner 20
et al., 2002), suggesting that a fire-conducive pattern will remain in place for relatively long durations.
In contrast, the eastern domain, located at lower latitudes, experiences a great deal of lightning activity in every season in association with both unstable air mass events and large frontal disturbances. During an active fire season, the frequency of 25
subse-ACPD
10, 8297–8339, 2010Implications for fire weather forecasting
D. Peterson et al.
Title Page
Abstract Introduction
Conclusions References
Tables Figures
◭ ◮
◭ ◮
Back Close
Full Screen / Esc
Printer-friendly Version
Interactive Discussion quently increases. As observed in the large-scale analysis and previous studies (e.g.
Skinner et al., 2002), the eastern domain is located in a highly transient synoptic en-vironment allowing for more monthly variations than the western domain. Therefore, many fire-conducive patterns will remain in place for only a few days to a few weeks, helping to explain the negative correlation after the 15-day division. This analysis builds 5
on the large-scale results (region B) and shows that there are many complexities with lightning activity and fire ignition in the smaller eastern domain. It is very likely that a fire will be ignited during short-lived, but favorable, dry lightning conditions and will burn during the days following the synoptic pattern change. This seems to be espe-cially true when positive height anomalies persist in western North America such as 10
during the fire season of 2004 (Fig. 2). Therefore, it is also possible that some of these lightning-caused fires will be extinguished when the pattern shifts and less favorable burning conditions exist.
Another complicated factor for interpreting the inconsistency between spatial distri-bution of fire counts and lightning strikes is the time lag between the actual strike and 15
the fire start (question 2 raised in the beginning of this subsection). This lag effect results from the time it takes for a fire, which may smolder for several days (holdover fire), to become substantial enough to be observed by either satellite or ground obser-vations following the strike. It has been suggested that these holdover fires can take as long as 7–10 days to become visible when using surface observation techniques in the 20
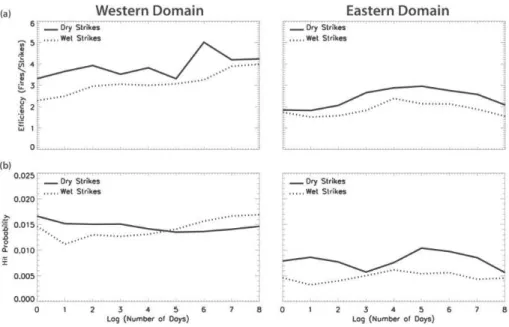
remote boreal forest (Flannigan and Wotton, 1991). When using MODIS data, this time should be reduced, but it will not be completely removed because fire detection is diffi -cult in cloudy conditions (whose likelihood is small under positive height anomalies). In the western (eastern) domain the average number of fires per dry strike is about 0.50 (0.04) and 0.15 (<0.01) for wet strikes without accounting for the holdover effect. 25
To address the actual holdover effect, two parameters, the efficiency (E) of lightning strikes in producing fires and the “hit” probability of lightning with fires (HP) are com-puted for each NARR grid as a function of lag time. Specifically, Edry and Ewet are
ACPD
10, 8297–8339, 2010Implications for fire weather forecasting
D. Peterson et al.
Title Page
Abstract Introduction
Conclusions References
Tables Figures
◭ ◮
◭ ◮
Back Close
Full Screen / Esc
Printer-friendly Version
Interactive Discussion strikes. HP values for dry and wet lightning (HPdryand HPwet) are computed through a
“hits and misses” technique. For example, dry hits (Hdry) occur when a fire count and
dry lightning strike are observed together in a grid box and dry misses (Mdry) occur
when only dry lightning is observed in a grid box. HPdry is simply the ratio ofHdrywith
the sum ofHdry andMdry. Using a similar procedure, HPwet, the counterpart of HPdry,
5
can also be computed. Each parameter (Edry, Ewet, HPdry, and HPwet) is computed
using the available data from 2000–2006 for each NARR grid box. However, any grid boxes with neither fires nor lightning are disregarded. The averages of the valid results at each grid box over the eastern and western domains are shown in Fig. 5 using fire count lag times of 1 to 8 days.
10
As expected, the averagedEdryand HPdryare higher thanEwetand HPwetin both
do-mains. However, theEwetand HPwetvalues are greater than zero in both domains
sug-gesting that wet strikes, presumably associated with precipitation amounts just above 2 mm, may also play a role in fire ignition. This “wet” influence would be most com-mon with lightning striking away from the main precipitation shield or with dying thun-15
derstorms. Regardless of lag, Edry in the western domain is higher than the eastern
domain with values of about 4 and 2.5 fires per dry strike respectively. Therefore, the chance of a dry lightning strike igniting a fire in the western domain is a factor of∼1.5 higher than the eastern domain. Similarly, HPdryis also higher in the western domain.
It was expected that the efficiency and hit probability lag plots would show a dis-20
tinct peak at the optimal lag needed to account for the holdover effect. However, the hit probability analysis (HPdry) does not show a trend based on lag in either domain
(Fig. 5b). Therefore, the holdover effect is based solely on the efficiency profiles (Edry).
For example, the eastern domain shows a distinct increasing trend inEdry until lag 3
(Fig. 5a) suggesting that a lag of 3 days must be accounted for. In contrast, theEdry
25
discrep-ACPD
10, 8297–8339, 2010Implications for fire weather forecasting
D. Peterson et al.
Title Page
Abstract Introduction
Conclusions References
Tables Figures
◭ ◮
◭ ◮
Back Close
Full Screen / Esc
Printer-friendly Version
Interactive Discussion ancies affecting the plots in Fig. 4. To further account for possible on-going fires, the
calculations used to produce Fig. 5 were also performed by applying running means of 2–5 days to the fire data prior to the efficiency and hit probability calculations. However, any influence onEdry,Ewet, HPdry, or HPwet from this on-going fire effect was found to
be negligible (results not shown). 5
While a detailed lag-analysis is conducted above to account for holdover fires, the exact time of a fire start remains a mystery even with daily satellite observations in clear conditions, not to mention in cloudy conditions. If meteorological data with a smaller grid size becomes available, it is possible that even this resolution will be too coarse to capture exact meteorological factors for isolated lightning events and to establish cause 10
vs. effect. There is also a chance, although small, that fires may propagate from one model grid box to another. Due to the fact that precise scenarios for each individual fire are difficult to obtain, our results are statistical in nature, as shown in this section and the following section, by analyzing the large dataset to discern dominant mechanisms.
6 Grid-based joint probability analysis
15
The final analysis builds upon the previous sections (4 and 5) to study the meteoro-logical influence on the lightning-related fire variability in the boreal forest through a three-step investigation: (1) the probability of dry and wet lightning occurrence as a function of the contributing meteorological variables found in the large-scale analysis, (2) the meteorological regimes favorable for lightning to ignite a fire, and (3) a com-20
ACPD
10, 8297–8339, 2010Implications for fire weather forecasting
D. Peterson et al.
Title Page
Abstract Introduction
Conclusions References
Tables Figures
◭ ◮
◭ ◮
Back Close
Full Screen / Esc
Printer-friendly Version
Interactive Discussion
6.1 Meteorological factors associated with lightning activity
Based on the large-scale analysis (Sect. 4), CAPE and 500 hPa geopotential height anomalies have a distinct influence on fire activity. However, to better explain their impacts on fire activity, the effect of these variables on lightning activity, the presumable cause of most fires in the western and eastern domains, must be investigated. To 5
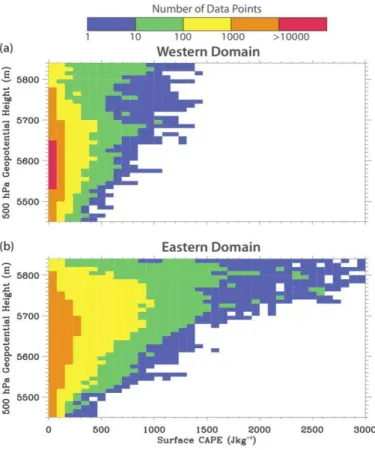
begin, the range of the observed 500 hPa height and CAPE data are each divided equally into ∼20 bin boxes per variable. This forms a mesh of ∼400 bin boxes with
500 hPa heights in one dimension and CAPE in another dimension. The available data points, derived from each NARR grid box over the seven-year interval are mapped into bin boxes on the mesh based upon their corresponding values of 500 hPa height and 10
CAPE.
By tallying the available NARR grid boxes in each bin box (Nxytot), the joint number density distribution of data points based on CAPE (subscriptx) and 500 hPa heights (y) can be ascertained (Fig. 6). In the eastern domain, the distribution ofNxytot covers a much larger range of CAPE values (0–3000 Jkg−1) than the western domain (0– 15
1400 Jkg−1). In addition, there are many days during the fire season lacking convective activity. Therefore, the majority ofNxytot are associated with relatively low CAPE values of less than 200 Jkg−1 (700 Jkg−1) in the western (eastern) domain. The influence of latitudinal location is also evident with a shift toward slightly higher 500 hPa heights in the eastern domain.
20
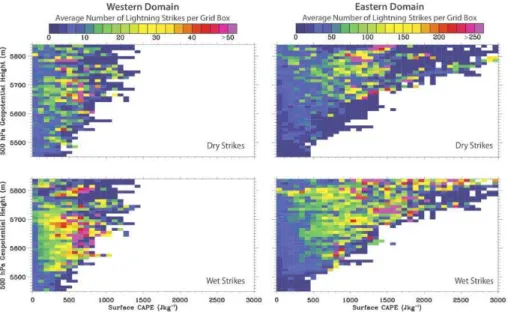
Similar to Nxytot, the data points with dry or wet lightning occurrence are tallied (Ldxy
andLwxy) and the individual dry or wet lightning strikes occurring within the NARR grid boxes ofLdxy andLwxy are summed (Sxyd andSxyw). This allows the average number of dry or wet lightning strikes occurring in a given NARR grid box (Adxy and Awxy) to be computed for each bin box on the mesh:Adxy=Sxyd /Ldxy andAwxy=Sxyw/Lwxy (Fig. 7). As 25
ACPD
10, 8297–8339, 2010Implications for fire weather forecasting
D. Peterson et al.
Title Page
Abstract Introduction
Conclusions References
Tables Figures
◭ ◮
◭ ◮
Back Close
Full Screen / Esc
Printer-friendly Version
Interactive Discussion western and eastern domain, respectively. The corresponding levels of 500 hPa height
are 5600 m and 5700 m in the western domain and eastern domain, respectively. Based on Figs. 6 and 7, the probability of dry and wet lightning occurrence (Pxyd and
Pxyw) is also computed for each bin box: Pxyd =Ldxy/N
tot
xy and Pxyw =Lwxy/N
tot
xy (Fig. 8). In the eastern domain, the highestPxyd (e.g. >50%) is associated with CAPE values 5
greater than 1500 Jkg−1and 500 hPa geopotential heights greater than about 5700 m. In contrast, a high Pxyd in the western domain is observed with much lower levels of CAPE and 500 hPa geopotential heights with minimum values of 300 Jkg−1 and 5450 m, respectively. The lower values are likely a result of the higher latitudinal lo-cation and topographic effects that may allow for localized convergence and enhanced 10
updrafts that would otherwise not produce a thunderstorm. However, even with latitudi-nal and possible topographic influences, the highestPxyd in both domains is only found near the maximum observed range of CAPE values for each corresponding level of 500 hPa geopotential height (grey shading in Fig. 8). Furthermore, the isolated nature of many dry thunderstorm events highlights the potential for a strong capping inversion 15
that must be overcome with only a few updrafts growing strong enough to become a thunderstorm (Flannigan and Wotton, 1991; Rorig and Ferguson, 1999; Hall, 2007). This explains why the highest potential for dry thunderstorm activity is associated with the most extreme values of low-level instability. Therefore, the knowledge of represen-tative CAPE values for each 500 hPa height level in each domain, as shown in Fig. 8, 20
can aid in forecasting these events.
While there are distinct limits on CAPE and 500 hPa height for dry lightning strikes, wet lightning strikes are common in a variety of synoptic and thermodynamic environ-ments in both domains. For example, highPxyw values are found with similar CAPE and 500 hPa height values as Pxyd. However, high Pxyw values also exist with much lower 25
convec-ACPD
10, 8297–8339, 2010Implications for fire weather forecasting
D. Peterson et al.
Title Page
Abstract Introduction
Conclusions References
Tables Figures
◭ ◮
◭ ◮
Back Close
Full Screen / Esc
Printer-friendly Version
Interactive Discussion tive complexes rather than isolated thunderstorm activity thereby, reducing the chance
of fire ignition (Flannigan and Wotton, 1991).
6.2 Meteorological conditions favorable for lightning related fire activity
With an understanding of the conditions associated with dry lightning activity, the me-teorological conditions necessary for dry lightning strikes to actually ignite a fire are 5
scrutinized. To begin, the holdover effect is accounted for by using a 2-day averag-ing period in the western domain and a 3-day averagaverag-ing period in the eastern domain (as suggested in Sect. 5.2). Using a method similar to the joint probability analysis in Fig. 8, the probability of dry lightning-ignited fires occurring in each grid box (Pxyf d) is then computed for all observed values of CAPE and 500 hPa geopotential height 10
in both the eastern and western domains for 2000–2006. However, the probability calculation in this case (Fig. 9a), uses the hit probability (hits and misses) technique described in Sect. 5.2 for each bin box. In this case, CAPE also serves a secondary purpose by affecting the potential for fire ignition to be successful. Previous studies have highlighted the importance of unstable conditions to stronger entrainment of the 15
air near the fires and faster spread rate (e.g. Werth and Ochoa, 1993).
As discovered in the lightning activity analysis (Fig. 8), the representative values for CAPE and the 500 hPa geopotential height necessary to produce dry lightning in the western domain are 300 Jkg−1 and 5450 m respectively. However, the values corre-sponding to a highPxyf d are about 300 Jkg−1and 5700 m respectively (Fig. 9a). There-20
fore, it seems the dry strikes occurring with 500 hPa heights below 5700 m have a very low probability to produce fires in this region. Furthermore, CAPE values greater than 300 Jkg−1and 500 hPa heights above 5700 m result in aPxyf d of 15% to more than 50%. While showing a similar trend, the same association of dry lightning with fire ignition in the eastern domain is not as strong with the maximumPxyf d only reaching above 50% 25
ACPD
10, 8297–8339, 2010Implications for fire weather forecasting
D. Peterson et al.
Title Page
Abstract Introduction
Conclusions References
Tables Figures
◭ ◮
◭ ◮
Back Close
Full Screen / Esc
Printer-friendly Version
Interactive Discussion These values are lower than the CAPE threshold of 1500 Jkg−1and the 500 hPa height
threshold of 5700 m determined earlier for a high probability of dry lightning activity (Fig. 8).
To complete the fire ignition analysis, two additional factors must be considered: (1) the total number of dry strikes necessary for a high chance of fire ignition and (2) fuel 5
moisture. From the large-scale analysis used here (Sect. 4), the number of consecutive dry days stands out as the moisture parameter commonly associated with a large num-ber of fires. To address (1) and (2) the probability analysis is again performed using the total number of dry lightning strikes (subscriptx) and the total number of consecutive dry days (y) in place of CAPE and 500 hPa height, respectively. In this case, the total 10
number of grid boxes with fire occurrence (Fxy) and the total number of available grid boxes (Nxytot) over the seven-year study period are used to compute the probability (Pxy) for each bin:Pxy=Fxy/Nxytot(Fig. 9b).
In both the eastern domain and western domain, the probability of fire ignition within a grid box is highest after 10–15 consecutive dry days and 10–15 dry lightning strikes; 15
this probability approaches∼50% after more than 20 dry days and/or more than 20 dry strikes. It seems that 10 consecutive dry days is an important consideration for fire potential. If there has been less than 10 consecutive dry days, the probability of a fire occurring in a given grid box is very low in both domains. Fauria and Johnson (2006) showed the importance of 500 hPa height anomalies persisting for 10 consecutive days. 20
ACPD
10, 8297–8339, 2010Implications for fire weather forecasting
D. Peterson et al.
Title Page
Abstract Introduction
Conclusions References
Tables Figures
◭ ◮
◭ ◮
Back Close
Full Screen / Esc
Printer-friendly Version
Interactive Discussion
7 Summary and conclusions
This study has provided a quantitative assessment of the meteorological environment favorable to lightning development and its influence on fire variability as observed by MODIS in the boreal forest of North America, using an integrated statistical approach with gridded datasets. Emphasis is on the understanding of meteorological factors 5
such as CAPE and 500 hPa heights favorable for wet and dry lightning to cause fires, although several other fire-related meteorological variables (including: number of dry days, relative humidity, and pre-fire-season precipitation) have also been analyzed to varying levels of detail. The primary step to understanding fire variability begins with the analysis of conditions necessary for dry lightning to occur and the spatial distribution of 10
dry lightning activity across the North American boreal forest belt. While dry lightning is paramount, the results here suggest that wet strikes have an impact, though minor, on fire ignition as well.
Atmospheric instability (CAPE), lightning strikes, and positive anomalies in the 500 hPa geopotential height field were found to explain more than 60% of the interan-15
nual variability in the number of fire counts in Alaska (A) while meteorological influences in the large Canada region (B) are very complex, especially east of the Canadian Rock-ies. At smaller spatial scales, there are clear differences in lightning activity between the mountainous western and the relatively flat eastern boreal forest study domains. For example, there is a greater chance of a lightning strike occurring as a dry strike 20
and a higher chance that the strike will result in a fire for any given grid box in the west-ern domain. Even though the eastwest-ern domain experiences many more lightning strikes per grid box than the western domain, the mechanisms behind lightning occurrence are different, with the western (eastern) domain showing a positive (negative) corre-lation between fires and lightning strikes. Furthermore, the efficiency of dry strikes in 25
producing fires is nearly 50% lower in the eastern domain.
ACPD
10, 8297–8339, 2010Implications for fire weather forecasting
D. Peterson et al.
Title Page
Abstract Introduction
Conclusions References
Tables Figures
◭ ◮
◭ ◮
Back Close
Full Screen / Esc
Printer-friendly Version
Interactive Discussion wildfire ignition and variability. In the western domain, a 15% to more than 50% chance
of a fire being ignited by dry lightning exists for CAPE values greater than 300 Jkg−1and 500 hPa heights above 5700 m. In the eastern domain, the CAPE threshold changes to 800 Jkg−1 and the 500 hPa height threshold actually decreases to 5600 m. The maxi-mum chance of fire ignition is also weaker reflecting the low efficiency values calculated 5
for the eastern domain. Reasons for this discrepancy are currently unclear, but an ex-planation may come from the differences in overall meteorological pattern and/or the biomass itself in this domain. Regardless of location, dry lightning strikes only occur near the maximum observed levels of CAPE for any given value of 500 hPa height. Therefore, as recognized in the Haines index (Haines, 1988), low-level instability is a 10
key factor in fire ignition in the boreal forest.
Following an investigation of many moisture variables and parameters used in fire forecasts across the boreal forest, only the derived number of consecutive dry days stood out when investigating the total number of fires. After 10 dry days occur for any given grid box in either domain, the chance for a fire ignition greatly increases and can 15
reach more than 50% after 20 dry days. Similarly, the probability of fire ignition is low with less than 10 dry lightning strikes per grid box but approaches values of 30–50% as the number of dry strikes per grid box increases. Therefore, in any region of the boreal forest, after a long duration of dry weather, relatively sparse dry lightning activity can easily result in fire ignition, but if the number of dry days is low, a greater number 20
of dry strikes per grid box is required to produce a similar chance for fire ignition. Furthermore, consecutive dry days may be a better measure of fire season variability than 500 hPa heights in the eastern boreal forest because the total number of dry days is not necessarily affected by changes in the synoptic pattern (e.g. dry frontal passages).
25
light-ACPD
10, 8297–8339, 2010Implications for fire weather forecasting
D. Peterson et al.
Title Page
Abstract Introduction
Conclusions References
Tables Figures
◭ ◮
◭ ◮
Back Close
Full Screen / Esc
Printer-friendly Version
Interactive Discussion ning data obtained from future geostationary satellite observations (such as GOES-R,
http://www.goes-r.gov/) could provide valuable constraints in analyzing the timing and localized mechanisms for lightning-induced fires. With climate change becoming a ma-jor issue, it is easy to see that increased low-level instability brought on by warmer temperatures can result in an enhanced potential for lightning activity and a greater 5
chance for fire ignition. Future work will investigate the charge and peak current of each wet or dry lightning strike as it pertains to fire ignition. Furthermore, this study briefly described the influence of pre-season precipitation and other variables on fire in-tensity. Building on that analysis, near-future work will also incorporate ground-based observations of fires for analyzing the variables responsible for changes in the post-10
ignition fire intensity parameters (such as MODIS FRP) across the boreal forest. Acknowledgements. We are all grateful to Environment Canada and The Bureau of Land Man-agement (Alaska) for providing the lightning data used in this study. Early support for this project was provided by the NASA Graduate Student Summer Program (to D. Peterson) fol-lowed by the NASA Earth Science New Investigator Program Award (to J. Wang). The project 15
is currently funded by the NASA Earth and Space Science Fellowship (to D. Peterson).
References
Amiro, B. D., Logan, K. A., Wotton, B. M., Flannigan, M. D., Todd, J. B., Stocks, B. J., and Martell, D. L.: Fire weather index system components for large fires in the Canadian boreal forest, Int. J. Wildland Fire, 13, 391–400, doi:10.1071/wf03066, 2004.
20
Boles, S. H. and Verbyla, D. L.: Comparison of three AVHRR-based fire detection algorithms for interior Alaska, Remote Sens. Environ., 72, 1–16, 2000.
Burgan, R. E., Klaver, R. W., and Klaver, J. M.: Fuel models and fire potential from satellite and surface observations, Int. J. Wildland Fire, 8, 159–170, 1998.
Burrows, W. R., King, P., Lewis, P. J., Kochtubajda, B., Snyder, B., and Turcotte, V.: Light-25
ACPD
10, 8297–8339, 2010Implications for fire weather forecasting
D. Peterson et al.
Title Page
Abstract Introduction
Conclusions References
Tables Figures
◭ ◮
◭ ◮
Back Close
Full Screen / Esc
Printer-friendly Version
Interactive Discussion Cummins, K. L., Krider, E. P., and Malone, M. D.: The US National Lightning Detection Network
(TM) and applications of cloud-to-ground lightning data by electric power utilities, IEEE T. Electromagn. C., 40, 465–480, 1998.
Dissing, D. and Verbyla, D. L.: Spatial patterns of lightning strikes in interior Alaska and their 5
relations to elevation and vegetation, Can. J. Forest Res., 33, 770–782, doi:10.1139/x02-214, 2003.
Ebisuzaki, W.: National Climatic Data Center Data Documentation for NOAA Operational Model Archive and Distribution System (NOMADS) North American Regional Reanalysis, National Climatic Data Center, Ashville, NC, 11 pp., 2004.
10
Fauria, M. M. and Johnson, E. A.: Large-scale climatic patterns control large lightning fire occurrence in Canada and Alaska forest regions, J. Geophys. Res., 111, G04008, doi:10.1029/2006jg000181, 2006.
Flannigan, M. D. and Harrington, J. B.: A Study of the Relation of Meteorological Variables to Monthly Provincial Area Burned by Wildfire in Canada, J. Appl. Meteorol., 27, 441–452, 15
1988.
Flannigan, M. D. and Wotton, B. M.: Lightning-Ignited Forest Fires in Northwestern Ontario, Can. J. Forest Res., 21, 277–287, 1991.
Gao, B. C., Xiong, X. X., Li, R. R., and Wang, D. Y.: Evaluation of the Moderate Resolution Imag-ing Spectrometer special 3.95-mu m fire channel and implications on fire channel selections 20
for future satellite instruments, J. Appl. Remote Sens., 1, 013516, doi:10.1117/1.2757715, 2007.
Giglio, L., Descloitres, J., Justice, C. O., and Kaufman, Y. J.: An enhanced contextual fire detection algorithm for MODIS, Remote Sens. Environ., 87, 273—282, doi:10.1016/s0034-4257(03)00184-6, 2003.
25
Haines, D. A.: A lower atmosphere severity index for wildland fire, National Weather Digest., 13, 23–27, 1988.
Hall, B. L.: Precipitation associated with lightning-ignited wildfires in Arizona and New Mexico, Int. J. Wildland Fire, 16, 242–254, doi:10.1071/wf06075, 2007.
Ichoku, C., Giglio, L., Wooster, M. J., and Remer, L. A.: Global characterization of biomass-30
burning patterns using satellite measurements of fire radiative energy, Remote Sens. Envi-ron., 112, 2950–2962, doi:10.1016/j.rse.2008.02.009, 2008a.
ACPD
10, 8297–8339, 2010Implications for fire weather forecasting
D. Peterson et al.
Title Page
Abstract Introduction
Conclusions References
Tables Figures
◭ ◮
◭ ◮
Back Close
Full Screen / Esc
Printer-friendly Version
Interactive Discussion aerosol emissions, J. Geophys. Res.-Atmos., 113, D14s09, doi:10.1029/2007jd009659,
2008b.
Ichoku, C. and Kaufman, Y. J.: A method to derive smoke emission rates from MODIS fire radiative energy measurements, IEEE T. Geosci. Remote, 43, 2636–2649, doi:10.1109/tgrs.2005.857328, 2005.
5
Jordan, N. S., Ichoku, C., and Hoff, R. M.: Estimating smoke emissions over the US Southern Great Plains using MODIS fire radiative power and aerosol observations, Atmos. Environ., 42, 2007–2022, doi:10.1016/j.atmosenv.2007.12.023, 2008.
Justice, C. O., Giglio, L., Korontzi, S., Owens, J., Morisette, J. T., Roy, D., Descloitres, J., Alleaume, S., Petitcolin, F., and Kaufman, Y.: The MODIS fire products, Remote Sens. Envi-10
ron., 83, 244–262, 2002.
Kaufman, Y. J., Ichoku, C., Giglio, L., Korontzi, S., Chu, D. A., Hao, W. M., Li, R. R., and Justice, C. O.: Fire and smoke observed from the Earth Observing System MODIS instru-ment – products, validation, and operational use, Int. J. Remote Sens., 24, 1765–1781, doi:10.1080/01431160210144741, 2003.
15
Kaufman, Y. J., Justice, C. O., Flynn, L. P., Kendall, J. D., Prins, E. M., Giglio, L., Ward, D. E., Menzel, W. P., and Setzer, A. W.: Potential global fire monitoring from EOS-MODIS, J. Geophys. Res.-Atmos., 103, 32215–32238, 1998a.
Kaufman, Y. J., Kleidman, R. G., and King, M. D.: SCAR-B fires in the tropics: Properties and remote sensing from EOS-MODIS, J. Geophys. Res.-Atmos., 103, 31955–31968, 1998b. 20
Kelha, V., Rauste, Y., Hame, T., Sephton, T., Buongiorno, A., Frauenberger, O., Soini, K., Venalainen, A., San Miguel-Ayanz, J., and Vainio, T.: Combining AVHRR and ATSR satellite sensor data for operational boreal forest fire detection, Int. J. Remote Sens., 24, 1691–1708, doi:10.1080/01431160210144705, 2003.
Mesinger, F., DiMego, G., Kalnay, E., Mitchell, K., Shafran, P. C., Ebisuzaki, W., Jovic, D., 25
Woollen, J., Rogers, E., Berbery, E. H., Ek, M. B., Fan, Y., Grumbine, R., Higgins, W., Li, H., Lin, Y., Manikin, G., Parrish, D., and Shi, W.: North American Regional Reanalysis, B. Am. Meteorol. Soc., 87, 343–360, 2006.
Potter, B. E., Winkler, J. A., Wilhelm, D. F., and Shadbolt, R. P.: Computing the low-elevation variant of the Haines index for fire weather forecasts, Weather Forecast., 23, 159–167, 30
doi:10.1175/2007waf2007025.1, 2008.
ACPD
10, 8297–8339, 2010Implications for fire weather forecasting
D. Peterson et al.
Title Page
Abstract Introduction
Conclusions References
Tables Figures
◭ ◮
◭ ◮
Back Close
Full Screen / Esc
Printer-friendly Version
Interactive Discussion Roberts, G., Wooster, M. J., and Lagoudakis, E.: Annual and diurnal african biomass burning
temporal dynamics, Biogeosciences, 6, 849–866, 2009, http://www.biogeosciences.net/6/849/2009/.
Roberts, G., Wooster, M. J., Perry, G. L. W., Drake, N., Rebelo, L. M., and Dipotso, F.: Re-trieval of biomass combustion rates and totals from fire radiative power observations: Ap-5
plication to southern Africa using geostationary SEVIRI imagery, J. Geophys. Res.-Atmos., 110, D21111, doi:10.1029/2005jd006018, 2005.
Rorig, M. L. and Ferguson, S. A.: Characteristics of Lightning and Wildland Fire Ignition in the Pacific Northwest, J. Appl. Meteorol., 38, 1565–1575, 1999.
Rorig, M. L. and Ferguson, S. A.: The 2000 fire season: Lightning-caused fires, J. Appl. Mete-10
orol., 41, 786–791, 2002.
Skinner, W. R., Flannigan, M. D., Stocks, B. J., Martell, D. L., Wotton, B. M., Todd, J. B., Mason, J. A., Logan, K. A., and Bosch, E. M.: A 500 hPa synoptic wildland fire climatology for large Canadian forest fires, 1959–1996, Theor. Appl. Climatol., 71, 157–169, 2002.
Skinner, W. R., Stocks, B. J., Martell, D. L., Bonsal, B., and Shabbar, A.: The association 15
between circulation anomalies in the mid-troposphere and area burned by wildland fire in Canada, Theor. Appl. Climatol., 63, 89–105, 1999.
Spracklen, D. V., Logan, J. A., Mickley, L. J., Park, R. J., Yevich, R., Westerling, A. L., and Jaffe, D. A.: Wildfires drive interannual variability of organic carbon aerosol in the western US in summer, Geophys. Res. Lett., 34, L16816, doi:10.1029/2007gl030037, 2007.
20
Stocks, B. J., Mason, J. A., Todd, J. B., Bosch, E. M., Wotton, B. M., Amiro, B. D., Flannigan, M. D., Hirsch, K. G., Logan, K. A., Martell, D. L., and Skinner, W. R.: Large forest fires in Canada, 1959–1997, J. Geophys. Res., 108, 8149, doi:10.1029/2001jd000484, 2002. Werth, P. and Ochoa, R.: The evaluation of Idaho wildfire growth using the Haines Index,
Weather Forecast., 8, 223–234, 1993. 25
Wooster, M. J.: Small-scale experimental testing of fire radiative energy for quanti-fying mass combusted in natural vegetation fires, Geophys. Res. Lett., 29, 2027, doi:10.1029/2002gl015487, 2002.
Wooster, M. J., Roberts, G., Perry, G. L. W., and Kaufman, Y. J.: Retrieval of biomass combus-tion rates and totals from fire radiative power observacombus-tions: FRP derivacombus-tion and calibracombus-tion 30
relationships between biomass consumption and fire radiative energy release, J. Geophys. Res.-Atmos., 110, D24311, doi:10.1029/2005jd006318, 2005.