Future Projections of Fire Occurrence in Brazil
Using EC-Earth Climate Model
Patrícia Silva
1, Ana Bastos
2, Carlos C. DaCamara
1, Renata Libonati
31
Instituto Dom Luiz, Faculdade de Ciências, Universidade de Lisboa, Lisboa, Portugal.
2
Laboratoire des Sciences du Climat et de l’Environnement, Universite Paris-Saclay,
Gif-sur-Yvette, France.
3Departamento de Meteorologia, Instituto de Geociências, Universidade Federal do Rio de
Janeiro, Rio de Janeiro, Brazil.
Received: 30/11/2015 - Accepted: 7/5/2016
Abstract
Fire has a fundamental role in the Earth system as it influences global and local ecosystem patterns and processes, such as vegetation distribution and structure, the carbon cycle and climate. Since, in the global context, Brazil is one of the re-gions with higher fire activity, an assessment is here performed of the sensitivity of the wildfire regime in Brazilian sa-vanna and shrubland areas to changes in regional climate during the 21st Century, for an intermediate scenario (RCP4.5) of climate change. The assessment is based on a spatial and temporal analysis of a meteorological fire danger index spe-cifically developed for Brazilian biomes, which was evaluated based on regional climate simulations of temperature, rel-ative humidity and precipitation using the Rossby Centre Regional Climate Model (RCA4) forced by the EC-Earth earth system model. Results show a systematic increase in the extreme levels of fire danger throughout the 21st Century that mainly results from the increase in maximum daily temperature, which rises by about 2 °C between 2005 and 2100. This study provides new insights about projected fire activity in Brazilian woody savannas associated to climate change and is expected to benefit the user community, from governmental policies to land management and climate researches. Keywords:fire danger, Brazil, Earth System Model, climate change.
Projeções Futuras de Ocorrência de Fogo no Brasil
Usando o Modelo EC-Earth
Resumo
O fogo tem um papel fundamental no Sistema Climático na medida em que influencia os padrões e os processos globais e locais dos ecossistemas, o ciclo do carbono e o clima. Tendo em conta que, no contexto global, o Brasil é uma das regiões com atividade de fogo mais elevada, pretende-se, no presente estudo, aferir da sensibilidade da ocorrência de fogo, nas áreas de savana e de vegetação arbustiva, às alterações climáticas durante o século XXI, para um cenário futuro intermédio (RCP4.5) de mudança climática. O estudo tem por bases análises espaço-temporais de um índice de perigo meteorológico de fogo, desenvolvido especificamente para os biomas do Brasil, cuja avaliação se baseou em simulações regionais do clima da temperatura, humidade relativa e precipitação, geradas pelo Modelo Regional (RCA4) do Rossby Centre forçado pelo modelo EC-Earth do sistema terrestre. Os resultados mostram a existência de um aumento sistemático dos níveis extremos de perigo de fogo ao longo do século XXI, o qual resulta principalmente de um crescimento de aproximadamente 2 °C dos valores diários da temperatura máxima entre 2005 e 2100. Este trabalho abre perspetivas para o estudo das projeções da atividade de fogo no cerrado brasileiro, associadas a uma mudança climática, sendo de esperar que dele venham a beneficiar as comunidades de utilizadores, da política governamental à gestão do território e à investigação do clima.
Palavras-chave:risco de fogo, Brasil, Modelo Regional de Clima, mudanças climáticas. Artigo
1. Introduction
Fire has a fundamental role in the Earth system, influ-encing global and local ecosystem patterns and processes, such as vegetation distribution and structure. Fires from hu-man activities or natural causes release every year to the atmosphere about 2-4 PgC of radiatively and photochemi-cally active trace gases and aerosols, an amount that repre-sents roughly 30-50% of human emissions from fossil fuel burning (Bowmanet al., 2009). The anticipated decrease of fuel moisture with higher temperatures and higher fuel loads due to the carbon fertilization effect is expected to in-tensify the frequency and extent of fire, which may lead to further spikes of carbon emissions (Alo and Wang, 2008). According to the Intergovernmental Panel on Climate Change (IPCC), climate change will likely increase the global risk of extreme fire events (IPCC, 2013). Further-more, fire has impacts at the climatological, ecological, so-cial and economic levels, such as those related to changes in the planetary albedo and the global radiative budget, modi-fications in vegetation condition, degradation potential of the soil and landscape value, damages to endangered spe-cies and adverse health effects of smoke haze (DaCamaraet al., 2014).
In this context, Brazil is a key region, being one of the global areas most affected by fire (Bowmanet al., 2009). Several studies focusing on the occurrence of fire in Brazil point out that tropical forests (especially the Amazonian forest), woody savannah (commonly referred to as cer-rado), shrubs and grasslands, present the highest numbers of fire events that mainly relate to fire practices to convert natural vegetation to pasture and agriculture (Davidsonet al., 2012; MCTI, 2013). In particular, the Brazilian woody savannas were pointed out as an endangered biome due to deforestation and fire practices (Speraet al., 2016; Shlisky
et al., 2009; Pivello, 2011). Several studies based on mod-els and observations highlighted South America as particu-larly vulnerable to climate change and have shown that semi-arid regions are an increasingly important driver of inter-annual variability in the carbon cycle, making the study of their future vulnerability to fire occurrence partic-ularly relevant (Hoffmannet al., 2002; Magrinet al., 2007; Poulteret al., 2014).
In general, climate conditions are a fundamental driver of fire spread, and fire patterns are strongly sensitive to regional climate variability and change. For instance, the intra-annual variability of burnt area over the Brazilian woody savannah mostly relates to the seasonal regime of precipitation. There is a marked dry season from May to September, characterized by very low precipitation amounts and, during the dry period, there is a steady dis-placement towards higher values of the median, lower and upper quartiles and extremes of the distributions of mon-thly values of burnt area (Libonatiet al., 2015). This dis-placement is in agreement with the increase in severity of dryness of the surface (Machadoet al., 2014).
In future decades, Brazil is expected to have an in-creased likelihood of extreme weather events, together with an increase from moderate to high wildfire potential, as well as a longer fire season. However most of these conclu-sions derive from studies based on global indices (e.g.Liu et al., 2010), which are not tailored for the specific regional
fire regimes under study.
Global Climate Models (GCMs) are useful tools to assess the evolution of fire behavior induced by future changes in the forcing variables. These models solve math-ematical equations that describe the physical processes tak-ing place in the atmosphere, the ocean, and the land surface. Earth System Models (ESMs) further include the biogeo-chemical processes (IPCC, 2013). These models are, there-fore, useful to help understanding how the Earth’s climate is changing and in anticipating natural and anthropoge-nically-driven variations in the future at the global scale. However, their coarse scale (typically in the order of a few degrees in latitude and longitude), limits the study of finer scale processes, as is the case of fire. In this regard, a great effort has been made by the scientific community in order to provide refined information about future climate using Regional Climate Models (RCMs). The Coordinated Re-gional Climate Downscaling Experiment (CORDEX) con-sists in a coordinated effort to develop a set of RCM experiments following a common protocol over regional domains, similar to the Coupled Model Intercomparison Project Phase 5 (CMIP5) framework for GCMs (Giorgiet al., 2009).
The aim of the present study is to assess the sensitiv-ity of meteorological fire danger in Brazilian savannas and shrublands to changes in climate variables during the 21st Century, using an index of meteorological fire danger sui-ted for the regional fire regime. This exploratory study was performed within the framework of the Brazilian Fire-Land-Atmosphere System (BrFLAS) Project. As a result from an initiative between Brazil and Portugal, Br-FLAS aims at advancing the scientific and technical knowledge regarding vegetation fires in Brazil namely in what con-cerns measuring areal and severity extent, estimating atmo-spheric emissions and transport, determining relations to observed past conditions and inferring possible implica-tions by future climate scenarios (Libonatiet. al., 2015).
main spatial distribution (Menéndezet al., 2010) and
sea-sonal cycle of precipitation over the area (Solmanet al.,
2013).
Here we first evaluate the model ability to reproduce the fire risk and its drivers during the peak fire season. As the model is found to be fit for this study, we then analyze the evolution of fire from the present until the end of the 21st Century. We focus on the future Representative Con-centration Pathway (RCP) 4.5, which corresponds to a me-dium mitigation scenario covering the period 2005-2100 (IPCC, 2013). Fire danger is then assessed based on the so-called Meteorological Fire Danger Index (Sismanoglu and Setzer, 2004), that was developed in CPTEC/INPE, the Brazilian Center for Weather Forecasting and Climate search at the Brazilian National Institute of Space Re-search. The last 30 years of the historical run (1976-2005) will finally be compared against two 30 year-periods of scenario RCP4.5 (2021-2050 and 2071-2100), paying spe-cial attention to changes in extreme classes of meteorologi-cal fire danger, the ones producing more devastating ecolo-gical and socio-economical impacts.
2. Data and Methods
2.1 Area of study
The analysis in the present study will focus on the Brazilian regions of savanna, woody savanna, and open and closed shrublands, where the highest number of fire events takes place (Davidsonet al., 2012). Information on
vegeta-tion types over Brazil, required to assess fire risk, was ob-tained from IGBP’s classification adapted for Brazil by INPE for the year 2005. As shown in Fig. 1, the original map (provided in a 1 km 1 km grid) was resampled to the model resolution (described in the next sub-section) by nearest-neighbor interpolation.
2.2 Meteorological Fire Danger Index (MFDI)
The assessment of fire risk relies on the so-called Me-teorological Fire Danger Index (MFDI), which was inter-nally developed at CPTEC/INPE based on the occurrence of hundreds of thousands of fire events in the main Brazil-ian biomes (Sismanoglu and Setzer, 2004). MFDI is opera-tionally used at CPTEC (http://www.inpe.br/queimadas/) to assess fire danger and the aim of the index is to represent how predisposed vegetation is to be burned on a given day. The rationale is that the longer the time without rain, the higher the risk of vegetation to burn; defoliation (that de-pends on vegetation type), maximum temperature and
min-imum relative humidity are also taken into account. Wind speed is not included because it is a condition for fire spread, not fire ignition.
Computation of MFDI is based on information about vegetation cover and on daily values of the maximum tem-perature (henceforth referred to simply asT), minimum rel-ative humidity (RH) and accumulated precipitation (P). First, the so-called Drought Day (DD) index is evaluated for each day based on the product of 11 precipitation factors that take into account cumulated rainfall over 11 preceding periods:
DD iPi
i
=
-=
Õ
exp( b )1 11
(1)
wherebiandPiare respectively the decay factor and the
ac-cumulated precipitation for periodi. Ranges and values of
the decay factors for each period considered are given in Table 1. Each precipitation factor takes the form of an ex-ponential decay and the aim is to reduce fire danger for higher volumes of rain in specific events and to attenuate the effect of precipitation as it occurs further in the past.
The so-called Base Danger (BD) is then estimated for
each day by combiningDDfor that day with a sinusoidal
curve that represents the effects of the phenology for the different vegetation types:
BD=045 1. { sin[min(+ A DD´ ,180° -) 90°]} (2)
Figure 1- Map of South America showing the study area (dark grey dots)
covering the regions of savanna, woody savanna, and open and closed shrublands of Brazil (dark and light grey dots).
Table 1- Ranges and values of the decay factors for the 11 periods that integrate the Drought Day (DD) index.
Period 1 2 3 4 5 6 7 8 9 10 11
where the argument of the sinus function is in degrees and values of coefficient A are 2.4 for closed savanna and
closed shrubland and 3.0 for savanna and open shrubland. The form of the curve reflects the phenology of vegetation, that tends to follow the sinusoidal variation of intensity and duration of light along the year. The rationale ofBDis that
for the same value ofDD, the fire danger is highere.g.for a
pasture than for a forest.
Effects of relative humidity and air temperature are also taken into account, for each day, by means of the so-called Humidity Factor (HF) and Temperature Factor
(TF), respectively defined as
HF= -0006. ´RH+13. (3)
and
TF =002. ´ +T 04. (4)
Fire danger increases when relative humidity is below 40% and decreases when it is higher, whereas temperature has a linear effect, in which the fire danger increases with temperature values above 30 °C and decreases with lower values.
For each day, the value ofMFDIis finally obtained by
multiplying the Basic Danger by the Humidity and Tem-perature Factors:
MFDI=BD HF´ ´HT (5)
MFDIis dimensionless, and varies between zero and
sligh-tly above unity.MFDI is then stratified into five classes,
from low to critical levels, as specified in Table 2. A more detailed description ofMFDIand its components may be
found in Setzer and Sismanoglu (2012).
For all three study periods (1976-2005, 2021-2050 and 2071-2100), daily values of DD, BD, HF, FT and MFDIwere computed for all pixels over the study area
cov-ering the Brazilian regions of savanna, woody savanna, and open and closed shrublands.
2.3 Fire risk in the present
In order to evaluate the skill of the model in capturing the main patterns associated with fire risk in Brazil, we first analyze the main spatio-temporal patterns of observedT, RHandP, and the corresponding fire risk, calculated as
de-scribed in the previous section. Daily fields ofT,RHandP
were extracted from ERA-Interim Reanalysis (Deeet al.,
2011) at 0.1 degree spatial resolution, for the period 1979-2005, in order to match the last years of the historical simu-lation. All fields were aggregated to the 0.44° rotated grid over South America corresponding to the CORDEX South American (SAM) domain.
2.4 Regional climate model and simulations
Simulations were obtained from the regional down-scaling of the EC-Earth climate model for the CORDEX SAM domain, by the Rossby Centre Regional Climate Model (RCA4) (Jones et al., 2011, Samuelsson et al.,
2011). The EC-Earth uses the Integrated Forecasting Sys-tem (IFS) model to represent the atmosphere, the Nucleus for European Modelling of the Ocean (NEMO) model for the ocean, the Louvain-la-Neuve Sea Ice Model (LIM) model for the sea-ice, the Tiled ECMWF Scheme for Sur-face Exchanges over Land with revised land surSur-face hy-drology (HTESSEL) for the continental surfaces and vege-tation, and the global chemistry Transport Model (TM5) for the atmospheric chemistry (although with no interactive coupling). Details about EC-Earth may be found in Haze-legeret al.(2012) and a detailed description of a previous
version of the RCA model (RCA-3) is provided by Samuelssonet al.(2011). The new version includes
infor-mation about soil properties, a new lake model and an im-proved hydrology (Berg et al., 2013). Vegetation in the
model is used mainly as boundary condition to the atmo-sphere-surface physical exchanges, and is represented in a rather simplistic manner, based on the GLCC dataset de-rived from one year of AVHRR data (Loveland et al.,
2000). Therefore, following the same procedure as in Sec-tion 2.3, we use the IGBP’s map to calculate fire risk, as it is better suited for Brazil. This implies, however, that in the future simulations, vegetation is assumed to remain static, rather than responding to climate change, and thus the changes in fire risk simulated are due to changes in climate only.
Simulations are performed in a 0.44° rotated grid over South America. Daily values of surface temperature, rela-tive humidity and precipitation were extracted and selected for the study area for two simulations:
i) The recent historical period, performed for the years 1956-2005;
ii) The 21st Century (2006-2100), using the pathway RCP4.5, an intermediate mitigation scenario in which radiative forcing stabilizes at 4.5 W/m2in 2100, as-suming that technologies and strategies will be adopted for reducing greenhouse gas emissions (IPCC, 2013). Choice of a moderate scenario is to mit-igate the drawback of using a static vegetation cover, which prevents taking into account the feedbacks of fire events on vegetation cover, that are expected to be much stronger in more severe scenarios such as RCP 8.5.
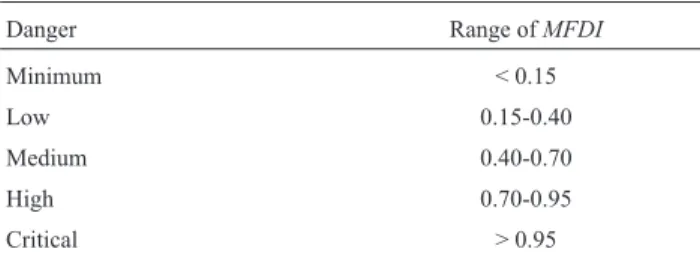
Table 2- Classes of meteorological fire danger and respective ranges of
the Meteorological Fire Danger Index (MFDI).
Danger Range ofMFDI
Minimum < 0.15
Low 0.15-0.40
Medium 0.40-0.70
High 0.70-0.95
On a first step, we analyze the performance of the RCM in reproducing the main spatiotemporal variability patterns of the climate drivers of fire risk during the peak of the fire season. As ERA-Interim is only available from 1979 onwards, and the calculation of fire risk on a given day requires information about precipitation during the pre-ceding months, the comparison of modelled and observed fire risk patterns was performed for the period common to the observations and the historical period,i.e.1980-2005.
To analyze the evolution of fire risk (and its drivers) over the 21st Century, we select three 30-yr long periods, the first one located at the end of the historical period (1976-2005) and the remaining two covering the last 30 years of the first (2021-2050) and the second (2071-2100) halves of the 21st Century.
3. Results and Discussion
3.1 Validation of fire danger simulated by the model The mean annual cycles of temperature, relative hu-midity, cumulated precipitation and fire danger over the study area during the 26-year period 1980-2005 were com-puted both for observed values (as evaluated by ERA-Interim) and for modelled values (as simulated by RCA4-EC-Earth), shown in Fig. 2. First, daily values of each vari-able were spatially averaged over the regions covered by savanna, woody savanna, and open and closed shrublands. Mean values of temperature, relative humidity and fire dan-ger and values of cumulated precipitation were then com-puted for each month and year. Finally, for each month, values of inter-annual mean and of standard deviation were
computed for each variable. All time series present strong seasonality, the austral summer months showing to be asso-ciated with high values of both relative humidity and pre-cipitation (the rainy season) and with very low values of fire danger. The higher values of the latter take place in Au-gust and September (the dry season) and are consistent with the increasingly warmer and drier conditions (Machadoet al., 2014) that occur along that period of highest observed
fire activity and largest recorded values of burned area (Libonatiet al., 2015).
Systematic deviations are worth being noticed be-tween observed and modelled values of all variables, namely a negative bias of about 2 °C along the whole year of both modelled temperature and fire danger relative to the observed ones and a positive bias of both simulated relative humidity and precipitation. This tendency for a rainier modelled annual cycle is consistent with the modelled wet-ter cycle, which in turn is consistent with the colder simu-lated cycle,i.e.with a weaker capacity of the atmosphere to
retain water vapor. Finally, the lower danger for the mod-elled annual cycle is consistent with the colder, wetter and rainier simulated cycles. The modelled cycles also present a weaker inter-annual variability for each month than the ob-served cycles, which translates into lower values of mon-thly standard deviations of the simulated time series.
The month of September is especially conspicuous in terms of agreement between modelled and observed distri-butions of fire danger as well as of relative humidity and precipitation. As this period coincides with the peak in fire risk and in burnt area (Libonatiet al., 2015), our analysis will focus on this month. The spatial distribution of the
dif-Figure 2- Observed (black line) and simulated (grey line) annual cycles of monthly mean temperature (T), relative humidity (RH), cumulated
ference between model and observations in September (not shown) reveals an east/west gradient, with fire risk being underestimated in the east and along the coast, progres-sively increasing towards the north-west of the region. This is largely due to overestimation of precipitation and relative humidity in the eastern areas and along the coastline, the two variables being underestimated in the interior and western areas. Nevertheless, in most pixels the differences are relatively small, with more than two thirds of the pixels showing absolute differences between modelled and ob-served values of fire danger lower than 0.2.
3.2 Evolution of climate variables
To better understand how meteorological drivers of fire are expected to evolve in the coming decades, the monthly mean values of temperature and relative humidity over the study region were calculated for the complete pe-riod of the historical run (1956-2005) and the 21st Century (2006-2100), using the pathway RCP4.5.
As shown in Fig. 3, during the historical period (solid lines) the model estimates a small increasing trend for tem-perature, and more variable patterns of relative humidity, which shows only signs of a persistent decreasing trend af-ter the 1990’s. For RCP4.5 (dashed lines), the model esti-mates a steady increase in temperature of about 2 °C over the Century, accompanied by a decrease of relative humid-ity of about 2%. These results are in agreement with previ-ous works (Grimm and Natori 2006; Marengo,et al., 2010,
Sánchez et al., 2015) that performed evaluations of
re-gional climate models over South America, showing an overall increase of temperature and a decrease of precipita-tion over central and eastern regions of the Amazon and Northeast Brazil. Low values of relative humidity cause fu-els to dry out and become more flammable, and tempera-ture is one of the most important factors when estimating fire risk considering that the higher the temperature the eas-ier to ignite fuel (Pereiraet al., 2013).
3.3 Evolution of meteorological fire danger
Figure 4 compares the seasonal cycle of the Base Danger (BD), the Humidity and the Temperature Factors (HF and TF), and the resulting Meteorological Fire Danger Index (MFDI) for the three study periods of 1976-2005, 2021-2050 and 2071-2100. The cycle of BD (Fig. 4 - bot-tom left panel) for the historical period is consistent with the annual cycle of burned areas as described by Libonatiet al.(2015), with very low values from December to April, increasing from May onwards and peaking in September. When comparing with the seasonal cycles for the two fu-ture projections, there are no distinguishable differences, which points to a negligible contribution of precipitation to possible changes in fire danger.
The HF component (Fig. 4 - upper right panel) pres-ents a marked seasonal cycle, consistent with the dichot-omy wet/dry season, peaking between September and October. When compared with HF, the TF component (Fig-ure 4 - upper left panel) has a weaker seasonal cycle super-imposed on a relatively high annual mean, with lower values during the austral winter (JJA) and increasing until October. A response to the climate forcing is observed for both TF and HF, but considerably higher for TF. While HF presents higher sensitivity to forcing from August to Octo-ber, and a faster increase during the first half of the 21st Century (from 1976-2005 to 2021-2050), TF presents a similar increase of about 0.2 for the entire seasonal cycle and for each of the future periods.
As expected from the seasonal dynamics of the fac-tors that compose the index, the annual cycle of MFDI (Fig. 4 - bottom right panel) presents values close to zero during the wet season (January to April), increasing until the peak in September and decreasing rapidly afterwards. Again, these results are consistent with those achieved by Libonatiet al.(2015). The response to the climate forcing is
registered mainly between July and October, but it is more pronounced in the peak month,i.e.September. Changes in
MFDI regime in this month show an increase of the mean values from 1976-2005 to 2021-2050, and an increase in the mean and standard deviation values from 2021-2050 to 2071-2100 (Table 3).
The spatial distributions over the study area of mean values of MFDI for September are shown in Fig. 5 for the 30-yr study periods: the end of the historical period (1976-2005, left panel), and 2021-2050 (middle panel) and 2071-2100 (right) from the RCP4.5 simulation. For the historical run, a cross-continent region parallel to the Arc of Defores-tation can be identified with mean values of MFDI greater than 0.70,i.e.with above than medium levels of meteoro-logical fire danger (Table 2). The two periods of the RCP4.5 simulation indicate in turn a widespread increase in mean values of MFDI from high to critical levels of meteo-rological fire danger over the above-mentioned region par-allel to the Arc of Deforestation.
Figure 3- Evolution of daily values of temperature (upper panel) and of
It is worth noting that simulated monthly values of MCDI for both 2021-2050 and 2071-2100 indicate that re-gions where a future increase in meteorological fire danger is likely to take place mostly match those regions where
higher levels of MCDI values are also modeled for the his-torical run of 1976-2005. More severe fire seasons are therefore to be expected at the end of the 21st Century. These results are in accordance with Liuet al.(2010), who
Figure 4- Average seasonal cycle over the study area of the Temperature Factor (TF, upper left panel), the Humidity Factor (HF, upper right panel), the
Basic Danger (BD, bottom left panel) and the Meteorological Fire Danger Index (MFDI, bottom right panel). The three curves represented respect to the study period of 1976-2005 (black line) of the historical run and the two study periods of 2021-2050 (dark-grey line) and 2071-2100 (grey line) of the RCP4.5 simulation.
Figure 5- Spatial distribution of monthly means of Meteorological Fire Danger Index (MFDI) in September for the study period of 1976-2005 (left
analyzed trends in global wildfire potential in a changing climate.
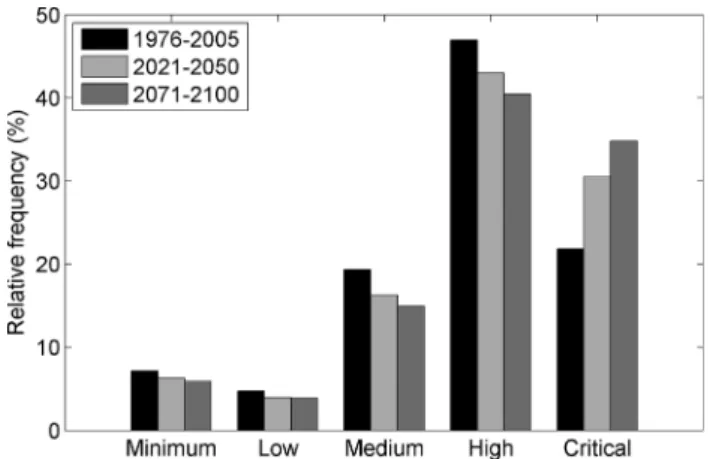
The expected increase in severity of the fire season may be assessed by analyzing changes in the frequencies of occurrence of the five classes of meteorological fire danger (Table 2) paying special attention to changes in classes of higher danger that favor the onset of large fire events. Fig. 6 shows the present of MFDI classes calculated on a pixel-by-pixel basis and their corresponding evolution over the 21st Century. A systematic increase of days of critical fire danger is projected, from about 20% in the present to 28% in 2021-2050 and 32% in 2071-2100. The remaining clas-ses present a decrease over the course of the Century, with the larger decreases observed for the regions that present moderate to high fire risk in the present.
4. Concluding Remarks
This feasibility study intended to evaluate the appli-cability of using outputs from a Regional Climate Model (RCM) combined with a regionally-fit fire index to evalu-ate meteorological fire danger patterns in the Brazilian sa-vannas and shrublands. The RCM (RCA4 forced by EC-Earth) was able to reproduce the main seasonal patterns of fire occurrence in this region, and allowed evaluating the sensitivity of fire danger to the expected changes in the driving climate variables.
In this study, a systematic increase in the critical class of meteorological fire danger is observed in Brazilian
semi-arid biomes throughout the 21st Century, for an inter-mediate scenario of climate change. The higher fire danger expected in the future mainly results from the increase in maximum daily temperature that reaches about 2 °C be-tween 2005 and 2100.
The less marked role of humidity and precipitation may be attributed to the fact that vegetation (i.e.fuel) in these biomes is already quite dry during the fire season, turning the decrease in relative humidity and precipitation less determinant for future fire behavior. This may not be the case for other biomes in Brazil, such as the Amazon for-est.
The simulated spatial distribution patterns of meteo-rological fire danger over the projected future point to-wards an overall increase of danger over a large area along the Arc of Deforestation. This increase together with the in-tensification of occurrence of classes of critical meteoro-logical fire danger supports the likelihood of more severe fire seasons in savanna and shrubland regions in Brazil along the 21st Century.
It is worth noting that, in order to account for possible biases or other error sources, a comparison of fire risk simu-lated by a set of models, rather than one, would allow estimating the uncertainty range of the future fire risk tra-jectories, and their dependence on changes in meteorologi-cal variables. Although the model performs relatively well during the peak fire season, there are important biases in the driving climatic variables, which may affect future projec-tions of fire risk. Furthermore, the vegetation map used in this study was static, which is not realistic because vegeta-tion is also expected to respond to changes in both climate and fire danger. Feedbacks between fire regime changes and vegetation cover have to be taken into account. In fact, fire is known to control the forest/savannah/grassland gra-dient (Staveret al., 2011) and, therefore, an increase of fire
frequency, area or intensity might induce changes in vege-tation composition in these regions. This could be taken into consideration by using dynamical vegetation models forced by future climate conditions, which are able to simu-late changes in fuel structure and dryness and vegetation composition in response to both future climate and fire.
These two aspects are, however, beyond the scope of this work where the main goal was to assess the future changes in potential fire activity that can be expected from changes in climate variables due to human-induced climate change. Future work may include performing a more thor-ough validation/verification of the RCM RCA4-EC-Earth, and expanding the present study to other future scenarios and biomes, particularly the Amazon forest.
ACKNOWLEDGMENTS
Research performed was supported by FAPESP/FCT Project Brazilian Fire-Land-Atmosphere System (BrFLAS) (FAPESP/1389/2014; 2015/01389-4) and by
Figure 6- Relative frequency of occurrence (%) of classes of
meteorolog-ical fire danger for the three study periods of 1976-2005 (histormeteorolog-ical run) and of 2021-2050 and 2071-2100 (RCP4.5 simulations).
Table 3- Mean and standard deviation of MFDI for September over the
study area covering the Brazilian savannas and shrublands, for the three study periods defined in the historical period (1976-2005) and in scenario RCP4.5 (2021-2050 and 2071-2100).
Historical (1976-2005)
RCP4.5 (2021-2050)
RCP4.5 (2071-2100)
Mean 0.74 0.78 0.80
EUMETSAT Satellite Application Facility for Land Sur-face Analysis (LSA SAF).
References
ALO, C.A.; WANG, G. Potential future changes of the terrestrial ecosystem based on climate projections by eight general cir-culation models.Journal of Geophysical Research, v. 113, 2008.
BERG, P.; DÖSCHER, R.; KOENIGK, T. Impacts of using spec-tral nudging on regional climate model RCA4 simulations of the Arctic.Geoscientific Model Development, v. 6, n. 3, p. 849-859, 2013.
BOWMAN, D.M.; BALCH, J.K.; ARTAXO, P.; BOND, W.J.; CARLSON, J.M.;et al.Fire in the earth system.Science, v. 324, p. 481-484, 2009.
DACAMARA, C.C.; CALADO, T.J.; ERMIDA, S.L.; TRIGO, I.F.; AMRAOUI, M.; TURKMAN, K.F. Calibration of the Fire Weather Index over Mediterranean Europe based on fire activity retrieved from MSG satellite imagery. Interna-tional Journal of Wildland Fire, v. 23, n. 7, p. 945-958, 2014.
DAVIDSON, E.A.; DE ARAÚJO, A.C.; ARTAXO, P.; BALCH, J.K.; BROWN, I.F.;et al. The amazon basin in transition. Nature, v. 481, n. 7381, p. 321-328, 2012.
DEE, D.P.; UPPALA, S.M.; SIMMONS, A.J.; BERRISFORD, P.; POLI, P.;et al.. The ERA-Interim reanalysis: Configura-tion and performance of the data assimilaConfigura-tion system. Quar-terly Journal of the Royal Meteorological Society, v. 137(656), p. 553-597, 2011.
GIORGI, F.; JONES, C.; ASRAR, G.R. Addressing climate infor-mation needs at the regional level: the CORDEX frame-work.World Meteorological Organization (WMO) Bul-letin, v. 58, n. 3, p. 175-183, 2009.
GRIMM, A.; NATORI, A. Climate change and interannual vari-ability of precipitation in South America. Geophys Res Lett, v. 33:L19706, 2006.
HAZELEGER, W.; WANG, X.; SEVERIJNS, C.; STEFANES-CU, S.; BINTANJA, R.;et al.EC-Earth V2.2: description and validation of a new seamless earth system prediction model.Climate Dynamics, v. 39, n. 11, p. 2611-2629, 2012. HOFFMANN, W.; SCHROEDER, W.; JACKSON, R. Positive feedbacks of fire, climate, and vegetation and the conversion of tropical savanna.Geophysical Research Letters, v. 29, n. 22, p. 2052, 2002.
INTERGOVERNMENTAL PANEL ON CLIMATE CHANGE. Climate Change 2013: The Physical Science Basis. Contri-bution of Working Group I to the Fifth Assessment Report of the Intergovernmental Panel on Climate Change. Cam-bridge University Press, Cambridge, United Kingdom and New York, NY, USA, 2013. 1535 p.
JONES, C.; GIORGI, F.; ASRAR, G. The Coordinated Regional Downscaling Experiment: CORDEX, An international downscaling link to CMIP5.Clivar Exchanges, v. 16, n. 2, p. 34-40, 2011.
LIBONATI, R.; DACAMARA, C.C.; SETZER, A.W.; MOREL-LI, F.; MELCHIORI, A.E. An Algorithm for Burned Area Detection in the Brazilian Cerrado Using 4mm MODIS Im-agery.Remote Sensing, v. 7, p. 15782-15803, 2015.
LIU, Y.; STANTURF, J.; GOODRICK, S. Trends in global wild-fire potential in a changing climate.Forest Ecology and Management, v. 259, n. 4, p. 685-697, 2010.
LOVELAND, T.R.; REED, B.C.; BROWN, J.F.; OHLEN, D.O.; ZHU, Z.;et al.Development of a global land cover charac-teristics database and IGB6 DISCover from the 1 km AVHRR data.Int. J. Remote Sensing, v. 21, p. 1303-1330, 2000.
MACHADO, N.G.; DA SILVA, F.C.P.; BIUDES, M.S. Efeito das condições meteorológicas sobre o risco de incêndio e o número de queimadas urbanas e focos de calor em Cuiabá-MT, Brasil.Ciência e Natura, Santa Maria, v. 36, n. 3, p. 459-469, 2014.
MAGRIN, G.; GAY GARCÍA, C.; CRUZ CHOQUE, D.; GIMÉ-NEZ, J.C.; MORENO, A.R.;et al.Latin america. Climate
Change 2007: Impacts, Adaptation and Vulnerability. Con-tribution of Working Group II to the Fourth Assessment Re-port of the Intergovernmental Panel on Climate Change. Cambridge University Press, Cambridge, UK, 2007. p. 581-615.
MARENGO, J.A.; AMBRIZZI, T.; DA ROCHA, R.P.; ALVES, L.M.; CUADRA, S.V.;et al.Future change of climate in South America in the late twenty-first Century: intercom-parison of scenarios from three regional climate models. Clim Dyn, v. 35, n. 6, p. 1073-1097, 2010.
MENÉNDEZ, C.G.; DE CASTRO, M.; SORENSSON, A.; BOU-LANGER, J.-P. CLARIS project: towards climate down-scaling in South America.Meteorologische Zeitschrift, E. Schweizerbart’sche Verlagsbuchhandlung, v. 19, p. 357-362, 2010.
Ministério da Ciência, Tecnologia e Inovação (MCTI). Estima-tivas Anuais de Emissões de Gases de Efeito Estufa no Brasil. MCTI, Brasília, 2013. Available on: http://www.mct.gov.br/upd_blob/0226/226591.pdf. Ac-cessed on: 25 nov. 2015.
PEREIRA, M.G.; CALADO, T.J.; DACAMARA, C.C.; CA-LHEIROS, T. Effects of regional climate change on rural fires in Portugal.Climate Research., v. 57, n. 3, p. 187-200, 2013.
PIVELLO, V. The use of fire in the Cerrado and Amazonian rain-forests of Brazil: Past and present.Fire Ecol., v. 7, p. 24-39. 2011.
POULTER, B.; FRANK, D.; CIAIS, P.; MYNENI, R.B.; AN-DELA, N.;et al.Contribution of semi-arid ecosystems to interannual variability of the global carbon cycle.Nature, v. 509, p. 600-603, 2014.
SAMUELSSON, P.; JONES, C.G.; WILLÉN, U.; ULLERSTIG, A.; GOLLVIK, S.;et al.The Rossby Centre Regional
Cli-mate model RCA3: model description and performance. Tellus A, v. 63, n. 1, p. 4-23, 2011.
SÁNCHEZ, E.; SOLMAN, S.; REMEDIO, A.R.C.; BERBERY, H.; SAMUELSSON, P.;et al.Regional climate modelling
in CLARIS-LPB: a concerted approach towards twentyfist Century projections of regional temperature and precipita-tion over South America.Clim Dyn,v. 45, p. 2193-2212, 2015;
http://queimadas.cptec.inpe.br/~rqueimadas/documentos/R iscoFogo_Sucinto.pdf. Accessed on: 25 nov. 2015. SISMANOGLU, R.A.; SETZER, A.W. Risco de fogo para a
vegetação da América do Sul: comparação de duas versões para 2003. In:XIII Congresso Brasileiro de Meteorologia, SBMET, Fortaleza, CE, set. 2004. Available at: http://sigma.cptec.inpe.br/queimadas/documentos/200409_ sismanoglu&setzer_cbmet8_fortaleza_636.pdf. Accessed on: 25 nov. 2015.
SHLISKY, A.; ALENCAR, A.A.C.; NOLASCO, M.M.; CUR-RAN, L.M. Global fire regime conditions, threats, and op-portunities for fire management in the tropics.Tropical Fire Ecology, Part of the series Springer Praxis Books, Heidel-berg, Germany, 2009, pp 65-83.
SOLMAN, S.; SANCHEZ, E.; SAMUELSSON, P.; DA ROCHA, R.; LI, L.;et al. Evaluation of an ensemble of regional cli-mate model simulations over South America driven by the ERA-Interim reanalysis: model performance and uncertain-ties.Climate Dynamics, v. 41, p. 1139-1157, 2013. SPERA, S.A.; GALFORD, G.L.; COE, M.T.; MACEDO, M.N.;
MUSTARD, J.F. Land-Use Change Affects Water Recy-cling in Brazil’s Last Agricultural Frontier.Global Change Biology, doi:10.1111/gcb.13298, 2016.
STAVER, A.C.; ARCHIBALD, S.; LEVIN, S.A. The Global Ex-tent and Determinants of Savanna and Forest as Alternative Biome States.Science, v. 334, n. 6053, p. 230-232, 2011.