International Journal of Development and Sustainability Online ISSN: 2186-8662 – www.isdsnet.com/ijds
Volume 1 Number 2 (2012): Pages 563-580 ISDS Article ID: IJDS12081802
An analysis of intra-city patterns of
residents in Lagos metropolis, Nigeria
Samson Babatunde Osoba
*Department of Transport Management Technology, Federal University of Technology, Minna, Nigeria
Abstract
In urban transportation, the movement of people as they go about their daily activities is of great concern. Urban
travel is not solely on travels alone, but on people’s participation in activities and how this is done. The intra-city
trips for various purposes are done in two categories namely, the weekdays and weekends trips. The four measures of trips characteristics chosen are namely, departure time, arrival time, and mode of transport and trip length for each intra-city journey purposes .The study sample consisted of 2,500 households in the study area. Systematic sampling technique was used to select every tenth building on the identified streets. The data collected were analysed using simple frequency count. There was a significant variation in intra-city trips for various purpose (f-4.1, p<0.01). The distance covered in kilometer for any of the trips (work, business, social, shopping and recreation) averaged 5km radius. Description of residents daily travel characteristics provides considerable insight into the quality of life experienced the event of similarities and variations in their commuting patterns among different area within the Lagos metropolis. Trip purpose analysis is necessary for an in-depth knowledge of the aggregate patterns of intra-city travel. Such analysis will revealed the structure of movement of households and the different land use to which certain proportion of the aggregate journeys are directed.
Keywords:Intra-city, Transport, Travel pattern, Urbanization, Resident
Copyright © 2012 by the Author(s) – Published by ISDS LLC, Japan
International Society for Development and Sustainability (ISDS)
Cite this paper as: Osoba, S.B. , An analysis of intra-city patterns of residents in Lagos
metropolis, Nigeria , International Journal of Development and Sustainability, Vol. 1 No. 2, pp. 563–
580.
1.
Introduction
Cities all over the world are characterized by a set of activities, which actually account for the concentration of people in them. Such activities are distinctively urban and may include those arising from manufacturing, trading and finance, transportation, and tertiary activities. All these combine to generate the spatial configuration of the city because their requirements are sometimes functionally differentiated and also spatially segregated. The spatial segregation of urban land-use types creates spatial imbalances and this necessitates spatial interaction for functional inter-relationship.
In other words, urban areas are associated with complex development and this is accompanied by the growth of intricate patterns of movement (Hoyle and Knowles, 1998; Turton, 1992). In many countries, living accommodation and places of other activities such as work, business, recreation etc are no longer in close proximity. People can now choose to live long distances from their places of work and travel everyday using any of transport modes. The urge or desire to satisfy felt needs arising from the separation of activities may, therefore, be said to constitute a major focus of interest for many studies in geography. These include, for instance, studies on permanent and semi-permanent migrations, trading and marketing activities, transportation and traffic flows and even changes of residence within cities. To these, one could add to other studies concerned with the communication of ideas by telephoning, telegraphing and letter-writing.Human movements made possible by transport, provide vital clues to the understanding of human spatial behaviour in all cities especially in developing countries where measures of telecommunication are not likely to prove of much value, given the low level of technology and the generally poor economic conditions. Transportation is very vital to urban life because it is an absolutely necessary means to an end. It allows people to carry out the diverse range of activities that made up daily life (Filani and Osayinmese, 1979; Filani, 1991; Filani, 1993). According to Hanson (2004) because cities consist of spatially separated, highly specialised land uses such as, food stores, hardware stores, banks, drug stores, hospitals, libraries, schools, post offices and so on, people must travel if they want to obtain necessary goods and services (p. 3).
Worldwide, urban travel takes place when inhabitants of urban centres carry out their different activities in different places whether by necessity or by choice. Studies (Ayeni, 1974; Adeniji, 1981; 1998; Ojo, 1990) have shown that in general, people tend to travel in order to obtain access to a variety of other people, services and facilities that are not available at the origins of their journeys. To what extent, how far and by what means they travel is a result of a complex interaction of socio-economic, political and physical factors (Adeniji, 1991). The nature and degree of influence of these factors however vary from city to city and even within a given urban centre. (Hausa and Schwab, 1987; Gordon et al, 1988; Rimmer, 1986; White, 1990; Garling et.al, 1994; Bhat and Koppelman, 1999).
International Journal of Development and Sustainability Vol.1 No.2 (2012): 563–580
ISDS www.isdsnet.com 565
The root of this dilemma the need for specialized interaction, information, the desire for elbow now and
amenity) is in part the product of temporal and spatial constraints on human behaviour.
Lagos metropolis is being considered as a study area because it has an increasing demand of intra-city travel pattern. This has contributed to the highest rate of traffic congestion in Nigeria. Also, it is the commercial capital of Nigeria. This study examines and analyzes the structure of travel pattern characteristics of urban residents in the Lagos metropolis. The study also assists the urban transport policy makers to understand trip pattern characteristics of urban residents in the Lagos metropolis
2.
Study area and methodology
2.1.
Study area
Nigeria is located in the Western part of Africa, bordering the Gulf of Guinea, lying between latitudes 4o 201
and 140 301 east of Greenwich (Adeleke, 2003). Lagos State lies approximately between longitudes 20 42 E
and 3o 42 E and latitudes 6o22N and 6o52N. The 180 km long Atlantic coastline forms the Southern boundary
of the state while its Northern and Eastern boundaries are shared with Ogun State. On the Western side, the Republic of Benin borders the boundary (Balogun et al., 1999)
Lagos Metropolis occupies 2,910sq.km out of the 3,577 sq. km land area of Lagos Metropolitan Area. The local governments are – Agege, Alimosho, Apapa, Amuwo-Odofin, Eti-Osa, Ikeja, Ifako-Ijaiye, Kosofe, Lagos Island, Lagos Mainland, surulere, Mushin, Oshodi-Isolo, Ojo and Somolu (Lagos State 2003 digest). 5.7 million peope or 6.4 percent of the population of Nigeria (88.5 million people in 1991) live in Lagos State (Nigeria National Population Census, 1991). In 1997, Lagos State population was estimated at 6.9 million out of which Lagos Metropolitan Area has 5.2 million (Nigeria National Population Commission, 1997). By projection the population of Lagos Metropolitan Area was estimated to be 12.9 million by 2000 and 24.5 million by 2015 (UN, 1996).
Transportation and communication facilities are poorly developed in Lagos metropolis. According to the metropolitan Lagos Master Plan, year 2000, the transportation land areas occupy 3202 hectares (18.6%). The figure alone can be traced to the beginning of transportation problem in the metropolis. An ideal transportation land use areas should be 25% of the total land use area (Lagos Master Plan, 2000).
16 – 22, 2001). The working hypothesis postulated for testing is that, the usage of GSM in metropolitan Lagos is a function of socio-economic characteristics of residents.
2.2.
Methodology
Data were collected from primary and secondary sources. Systematic sampling technique was used to select every tenth building on the identified streets. In a multi-family dwelling, random sampling was used to select one household. The data collected were analyzed using simple frequency count.
3.
Results and discussion
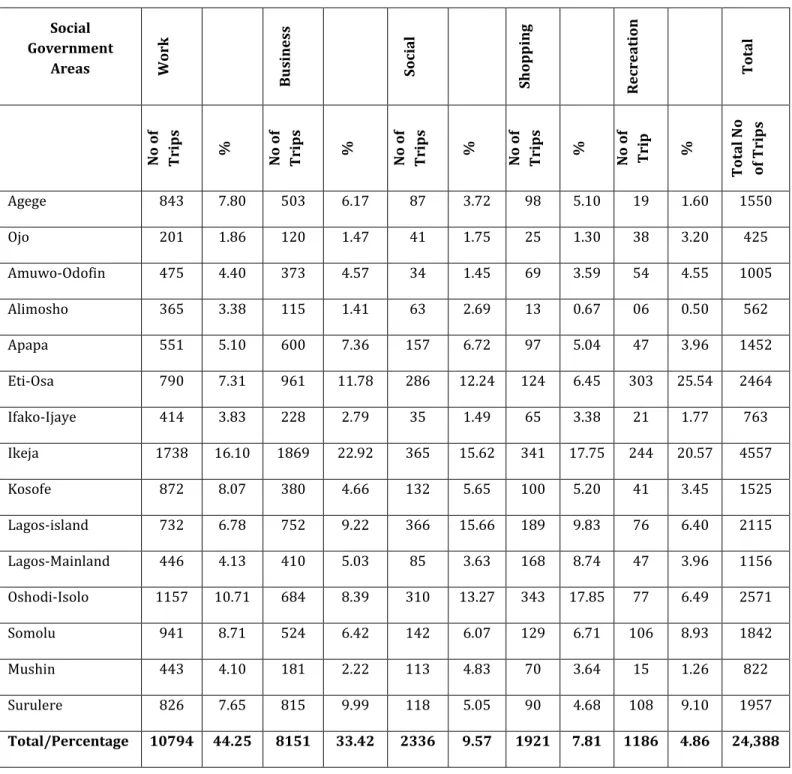
This section examines the intra-city patterns of residents in Lagos metropolis. Table 1 shows the intra-city generated trips by purpose in Lagos metropolis. The total number of trips made in the entire Lagos metropolis during the survey period was 24,388. With these, trips to work accounted for 44.3% while those to business activities constituted 33.4%. Thus, journeys to work places and business activities dominated all the trips in the area, accounting for more than two thirds of all trips.
These two were followed by social activities (9.6%), shopping activities (7.9%) and recreation activities which accounted for about (4.9%). The dominant position of journey to work places and business activities among the various trip purposes is perhaps due to the fact that office work and business activities are the major activities in the urban centres in each of the fifteen Local Government areas that constituted the Lagos metropolis.
From Table 1, further analysis reveals that, it was earlier shown that in the intra-city trip generated by purpose in the Lagos metropolis, work and business trips accounted for the substantial proportion of trips generated. However, the proportion varied in each of the fifteen local Government areas that constituted the Lagos metropolis.
The pattern of urban trips for work in Lagos metropolis suggests that all the major towns have high proportion of work trips and highest proportion of trips are made in Ikeja (16%) followed by Oshodi-Isolo (10%), Somolu (8%), Kosofe (8%), Agege (7%), Surulere (7%), Eti-Osa (7%), Lagos-Island (6%), and Apapa (5%) while the remaining Local Government areas such as Amuwo-Odofin recorded a low proportion of (4%), Lagos-Island (4%), Mushin (4%) Ifako-Ijaye (3%), Alimosho (3%), and Ojo (1%) of work trips.
From the above, it could be inferred that the local Government areas with substantial proportion of work trips have high level of number of industrial and commercial activities and also serve as the administrative headquarters which necessitated more trips within and from other local Government areas while the local Government areas with the low proportion of work trips have least level of industrial and commercial activities.
International Journal of Development and Sustainability Vol.1 No.2 (2012): 563–580
ISDS www.isdsnet.com 567
Mainland (5%), while the remaining local Government areas such as Kosofe (4%), Amuwo-Odofin (4%), Ifako-Ijaye (2%), Mushin (2%), Ojo (1%) and Alimosho (1%) have relatively low proportion of business trips.
Table 1. Intra-city trips generated by purpose in Lagos-metropolis (Source: Author’s field survey, )
Social Government
Areas Wor
k
Bu
sin
es
s
S
ocia
l
S
h
opp
ing
Recre
a
ti
on
To
ta
l
N
o
of
Tr
ip
s
%
N
o
of
Tr
ip
s
%
N
o
of
Tr
ip
s
%
N
o
of
Tr
ip
s
%
N
o
of
Tr
ip
%
To
ta
l
N
o
of
T
rip
s
Agege 843 7.80 503 6.17 87 3.72 98 5.10 19 1.60 1550
Ojo 201 1.86 120 1.47 41 1.75 25 1.30 38 3.20 425
Amuwo-Odofin 475 4.40 373 4.57 34 1.45 69 3.59 54 4.55 1005
Alimosho 365 3.38 115 1.41 63 2.69 13 0.67 06 0.50 562
Apapa 551 5.10 600 7.36 157 6.72 97 5.04 47 3.96 1452
Eti-Osa 790 7.31 961 11.78 286 12.24 124 6.45 303 25.54 2464
Ifako-Ijaye 414 3.83 228 2.79 35 1.49 65 3.38 21 1.77 763
Ikeja 1738 16.10 1869 22.92 365 15.62 341 17.75 244 20.57 4557
Kosofe 872 8.07 380 4.66 132 5.65 100 5.20 41 3.45 1525
Lagos-island 732 6.78 752 9.22 366 15.66 189 9.83 76 6.40 2115
Lagos-Mainland 446 4.13 410 5.03 85 3.63 168 8.74 47 3.96 1156
Oshodi-Isolo 1157 10.71 684 8.39 310 13.27 343 17.85 77 6.49 2571
Somolu 941 8.71 524 6.42 142 6.07 129 6.71 106 8.93 1842
Mushin 443 4.10 181 2.22 113 4.83 70 3.64 15 1.26 822
Surulere 826 7.65 815 9.99 118 5.05 90 4.68 108 9.10 1957
Total/Percentage 10794 44.25 8151 33.42 2336 9.57 1921 7.81 1186 4.86 24,388
The above analysis can be explained, by the fact that the local Government areas with high proportion of business trips have substantial level of commercial activities which necessitated more trips by the residents while the areas with low proportion of business trips have relatively low level of commercial activities in the areas. Furthermore, business transactions and related activities more often than not involve face-to-face contact requiring travel between the spatially located points.
The pattern of urban social trips in Lagos metropolis suggests that all the major cities have high proportion of social activities and the highest proportion of trips are made in Lagos-Island (15%) and Ikeja (15%), followed by Oshodi-Isolo (13%), Eti-Osa (12%), Apapa (6%), Somolu (6%), Kosofe (5%) and Surulere (5%) while the remaining Local Government Areas such as Mushin (4%), Agege (3%), Lagos-mainland (3%), Alimosho (2%), Ojo (1%), Ifako-Ijaye (1%) and Amuwo-Odofin (1%) have relatively low proportion of social trips.
This could be explained by the fact that the local Government areas with higher proportion of social trips have more social activities such as burials, wedding and house warming which necessitated physical contact or face to face contact among the residents while the local Government areas with low level of social trips have low level of social activities in the area.
Shopping trip is the fourth dominant trip in the Lagos metropolis after work, business and social trips. Oshodi-Isolo and Ikeja accounted for the highest proportion (17%) of Shopping trips respectively, followed by Lagos-Island (9%), Lagos-Mainland (8%), Somolu (6%), Eti-Osa, (6%), Kosofe (5%), Agege (5%) and Apapa (5%) while the remaining local Government areas such as Surulere (4%), Mushin (3%), Amuwo-Odofin (3%), Ifako-Ijaye (3%), Ojo (1%) and Alimosho (0%) have low proportion of shopping trips.
From the above, it could be inferred that the local Governments areas with high proportion of shopping trips have substantial level of commercial activities which are dominated by local traditional markets and frontage retail shops in residential areas. These constitute the focal points for everyday buying and selling by the residents of Lagos metropolis while the areas with low proportion of shopping trips have least level of commercial activities in the area.
Recreational trips are generally low, except Eti-Osa and Ikeja that have the substantial proportion (25% and 20% respectively) for shopping trips, followed by Surulere (9%), Somolu (8%), Oshodi-Isolo (6%), Island (6%). The remaining local government areas such as Amuwo-Odofin (4%), Apapa (3%), Lagos-Mainland (3%), Kosofe (3%), Ojo (3%), Ifako-Ijaye (1%), Agege (1%), Mushin (1%) and Alimosho (0%) have relative proportion of recreational trips.
From the above, it could be deduced that the generally low proportion of recreational trips is necessitated by the low level of recreation activities among the residents of the Lagos metropolis. It is also a reflection of
the residents’ desire not to recreate after much time has been spent on their daily activities. This finding
Int e rn a ti on a l J our n a l of D ev el opm en t a n d Sus ta in a b il ity Vol .1 N o.2 (2012 ): 5 63 – 580 ISDS w ww .isds n e t.c om 569
3
.1
.
C
har
act
eristi
c of
in
tra
-cit
y
j
our
ne
y
s of
r
esi
d
en
ts
Ta b le 2 . C ha ra cte ristic s of in tr a -c ity w o rk tr ips i n L a gos me tr opo lis ( Sour ce : Auth or ’s fie ld su rve y, ) Departure Time Arrival time Mode of Transport Distance in km Respondents in Percentage Respondent in Percentage Respondents in Percentage Respondents in Percentage LO C A L GO V E R N M E N T A R E A S Before 5.00am 5.01-6am 6.01-7am 7.01-8am 8.01-9am9.01 and later
3.1.1.work
Table 2 shows the characteristics of intra-city work trips in Lagos metropolis. In examining the Table, the emphasis was on the similarities and variations in departure and arrival time, modal split and length of trips of workers in all the fifteen Local Government Areas that constitute Lagos metropolis. From Table 2, the residents who are workers in all the fifteen Local Government Areas that constitute Lagos metropolis have substantial proportions of work trips peak between 6.01 am and 6.30 am. High proportion of work trips peak period are made in Somolu (74%) followed by Kosofe (73%), Oshodi-Isolo (72%), Eti-Osa (72%), Alimosho (71%), Mushin (70%), Agege (70%), Surulere (69%), Ifako-Ijaye (69%), Apapa (69%), Amuwo-Odofin (66%), Ojo (63%), Ikeja (62%), Lagos-Island (61%) and Lagos-Mainland (60%).
This may be because the earlier take-off of workers in all the fifteen Local Government areas might not be unconnected with the chaotic traffic situation in Lagos metropolis and their bid to get to work on time. Similarly, where there was low proportion of workers set-out between 6.01 and 9 am or beyond, we have workers who are made up of traders and other workers in the informal sector with no definite time for commencing their daily activities.
The after-work journey, Table 2 shows that residents who are workers in all the fifteen Local Government Areas that constitute Lagos metropolis account for 80% of workers who return home late between 6.31 pm and 9.30 pm every working day while the remaining 20% account for workers who return home early between 3.30 pm and 6.30 pm every working day.
From the above, it is very clear that the variation in the nature of residents’ job, especially with those who
work in the private sector makes it imperative for them to arrive home late while those who work in the public sector (especially civil servants) return home earlier.
From the Table, it is generally observed that the reason for returning home late by the residents may be as a result of the delay necessitated by the chaotic traffic situation in Lagos metropolis.
The modal split for work trips, in order of importance, across the Lagos metropolis are: commercial vehicles, private vehicles, official vehicles, motorcycles, Rail and Ferry. Table 2 above shows that the highest proportion (between 32% and 61%) of workers in all fifteen Local Government Areas that constitute Lagos metropolis made use of commercial vehicles, followed by private vehicles (between 17% and 36%) of workers; official vehicles (between 13% and 26%); motorcycles (between 1% and 19%) of workers while the Rail and Ferry have the lowest proportion of (between 1% and 3%) of workers and (between 0 and 2%) of workers respectively.
Int e rn a ti on a l J our n a l of D ev el opm en t a n d Sus ta in a b il ity Vol .1 N o.2 (2012 ): 5 63 – 580 ISDS w ww .isds n e t.c om 571 Ta b le 3 . c ha ra cte ristic s of in tr a -c ity b us in e ss tr ips in L a gos me tr o pol is ( Sou rc e : Au th or ’s fie ld surve y, ) Departure Time Arrival Time Mode of Transport Distance in Kilometers Respondents in Percentage Respondents in Percentage Respondents in Percentage Respondents in Percentage LO C A L GOV ERN MEN T A REA S
Before 6.00 am
6.01 to 7 am
7.01 to 8 am
8.01-9 am
9.01 and later
4.31-5.30 pm
5.31 to 6.30 pm
6.31-7.30 pm 7.31-8.30 pm 8.31-9.30 Private vehicle Commercial vehicle Motor Cycle Ferry Rail
Below 5 km
5.1-10 km
10 to 15 km
15.1-20 km
20.1-25 km
25.1 to 30 km
The above can be explained by the proximity of the commercial centres and industries to the workers in the Lagos metropolis.
3.1.2.Business trip
Table 3 shows the characteristics of intra-city business trips in Lagos metropolis. From the Table, the emphasis was on the similarities and variations in departure and arrival time, modal split and length of trips of workers in different urban centres of Lagos metropolis. From the Table 3, in the same manner, the highest proportion of workers in all the fifteen Local Government Areas of Lagos metropolis make their trips in the peak period between 6.01 am and 6.30 am of every working day and such workers are in the Local Government Area such as Somolu with the highest proportion (78%), followed by Oshodi-Isolo (75%), Mushin (73%), Ifako-Ijaye (73%), Surulere (71%) Alimosho (71%) Kosofe (71%) Lagos-Island (70%), Eti-Osa (70%), Lagos Main Land (69%), Amuwo-Odofin (69%), Agege (69%), Apapa (69%), Ojo (65%) and Ikeja (64%).
This could be attributed to the fact that residents in the business category in Lagos metropolis leave home early as a result of the delays usually encountered on their way due to traffic congestion. The relative proportion of residents within the business category that set-out between 7.01 and 9 am or later could be explained by the proximity of their business activities to their homes.
In the same manner, like work trips, business trips show that 80% of residents who engage in business activities arrive home late between 6.31 pm and 9.30 pm or thereafter on every business day while the remaining 20% belongs to those who return home earlier between 4.31 pm and 6.30 pm on every business day.
The above could be attributed to the type of business activities being engaged in by the residents. The study further shows that those who arrive home late must have done so as a result of traffic hold up which occur on daily basis in every part of Lagos metropolis.
The modal split for business activities in the Lagos metropolis reveals the use of Commercial vehicles, private vehicles, motorcycles, rail and ferry in the order of importance in the various urban centres. The study further shows that commercial vehicles and private vehicles carry substantial proportion of over 80% or residents who engage in business activities in each of the fifteen Local Government areas that constitute the Lagos metropolis.
The distance in Kilometer for business trips reveals that 70% of residents who engage in business activities in each of the fifteen Local Government Areas that constitute Lagos metropolis do not travel over a long distance, like the case of work trips, whose travel distance is between 5 and 20 km. The remaining 30% of residents who engage in business activities do travel a long distance, between 20.1 to 30 km or beyond.
Int e rn a ti on a l J our n a l of D ev el opm en t a n d Sus ta in a b il ity Vol .1 N o.2 (2012 ): 5 63 – 580 ISDS w ww .isds n e t.c om 573 Ta b le 4 . C ha ra cte ristic s of in tr a -c ity soc ia l tr ips in L a gos me tr opo lis ( Sour ce : Auth or ’s fie ld su rve y, ) Departure Time Arrival Time Mode of Transport Distance in Kilometers Respondents in Percentage Respondent in Percentage Respondents in Percentage Respondent in Percentage L OCAL G OV E R NM E NT AR E AS 8-12 noon
12.01 -5 pm
5.01 pm and later
8- 12 noon
12.01 -5 pm
5.01 pm and later Private Vehicle Commercial Vehicle Motor Cycle Ferry Rail
Below 5 km
5.1-10 km
10.1 to 15 km
15.1-20 km
20.1-25 km
25.1 to 30 km
3.1.3.Social trip
On the other hand, in comparison with other trips earlier discussed, (that is the work and business trips), the Table 4 for social trip shows that the residents in each of the fifteen Local Government Areas that constitute the Lagos metropolis engage in social travels at different times of the day. However, the Table reveals that 80% of the residents in each of the Local Government Areas engage in social trips between 8 am and 12 noon and 12.01 pm to 5 pm while the remaining 20% of residents in each of the fifteen Local Governments Areas made their social trips between 5 pm and late in the day.
The after-social trip journey shows that low proportion (less than 25%) returns home earlier than 5.01 pm every day in each of the fifteen local Government areas while the largest proportion (over 70%) returns home later between 5.01 pm and late in the night from their social trips.
The modal split for social travel is similar to other journey purposes with use of commercial vehicles, private vehicles, motorcycles, Rail and Ferry in order of importance in the various urban centres of Lagos metropolis. In the same manner, the study reveals that commercial and private vehicles carry substantial proportion (over 80%) of residents who engage in social trips while the remaining low proportion (20%) of residents who engage in social trips make use of other modes (motorcycle, Rail, and Ferry) in each of the fifteen Local Government Areas.
The distance in kilometers of social trips reveals that residents in each of the fifteen Local Government Areas engage in social travels at different distances each day. However, as shown in Table 4, high proportion (over 75%) of residents travels between 5 and 20 km each day while the remaining low proportion (less than 25%) of residents travels between 20.1 and 30 km everyday in each of the fifteen Local Government Areas of Lagos metropolis.
3.1.4.Shopping trip
Int e rn a ti on a l J our n a l of D ev el opm en t a n d Sus ta in a b il ity Vol .1 N o.2 (2012 ): 5 63 – 580 ISDS w ww .isds n e t.c om 575 Ta b le 5 C ha ra cte ristic s of in tr a -c ity sh opp in g tr ips in L a gos me tr o pol is ( Sou rc e : Au th or ’s fie ld surve y, ) Departure Time Arrival Time Mode of Transport Distance in Kilometers Respondents in Percentage Respondent in Percentage Respondents in Percentage Respondent in Percentage L OCAL G OV E R NM E NT AR E AS
Before 12 noon
12.01 to 4 pm
4.01 pm and later
Before 12 noon
12.01 to 4 pm
4.01 pm and later
Private Vehicle Official Vehicle Commercial Vehicle Motor Cycle Ferry Rail
Below 5 km
5.1-10 km
10to 15 Km
15.1-20 km
20.1-25 km
25.1 to 30 Km
In the same manner, Table 5 reveals that the modal split for shopping journeys is not different from other journey purposes with the use of commercial vehicles, private vehicles, official vehicles, motorcycles, Rail and Ferry in order of importance in each of the fifteen local Government areas. The study reveals that commercial and private vehicles carry substantial proportion (over 70%) of residents who engage in shopping trips while the remaining low proportion (less than 30%) of residents who engage in shopping travels in each of the fifteen Local Government Areas is carried by rail and ferry.
The distance in kilometers of shopping travels in each of the fifteen local Government areas shows the desire of the substantial proportion (over 70%) of residents to do shopping activities within 15km radius of their residences while the remaining low proportion (less than 30%) of residents who desire to do shopping activities extend their travels beyond the 20 km radius.
3.1.5.Recreation trip
The analysis of recreation trips characteristics reveals that like shopping trips, there is a level of uniformity in the departure time for this journey purpose in each of the fifteen local Government areas. However, the study shows that higher proportion (over 60%) of residents engage early in recreational trips between 11 am and 4 pm each day while the relative proportion (less than 30%) of residents engage in recreational trips late between 4.01 pm and later in the day in each of the fifteen Local Government Areas of Lagos metropolis. The return journey of recreational trips shows that 80% of residents who engage in recreation activities travel home late between 4.01 and late in the day while the relative proportion of 20% of residents who engage in recreation trips returns home early in the day in each of the fifteen Local Government Areas.
The study reveals that the modal split for recreational trips is not different from other journey purposes with the use of commercial vehicles, private vehicles, official vehicles, motorcycles, Rail and Ferry. The Table 6 shows that higher proportion (over 75%) of residents make use of commercial and private vehicles for recreational trips while relatively proportion (less than 25%) of residents make use of official vehicles, motorcycles, Rail and Ferry in each of the Local Government Areas that constitute Lagos metropolis.
Table 6 shows that recreation trips take place at varying distances from homes in each of the local Government areas. However, the study reveals that substantial proportion (over 70%) of residents travel a distance of less than 15 kilometer radius of their residences while relatively proportion (less than 30%) of residents engage in recreational trips of distances of over 20 kilometers radius of their residences in each of the fifteen local Government areas that constitute Lagos metropolis.
4.
Conclusion
Int e rn a ti on a l J our n a l of D ev el opm en t a n d Sus ta in a b il ity Vol .1 N o.2 (2012 ): 5 63 – 580 ISDS w ww .isds n e t.c om 577 Ta b le 6 . C ha ra cte ristic s of in tr a -c ity r e cr e a tion tr ips i n L a gos me tr o pol is ( Sou rc e : Au thor ’s fi eld surv ey, ) Departure Time Arrival Time Mode of Transport Distance in Kilometers Respondents in Percentage Respondent in Percentage Respondents in Percentage Respondent in Percentage LO CA L G O V ERN M ENT AR EAS
Before 12 noon
12.01 to 4 pm
4.01 pm and later
Before 12 noon
12.01 to 4pm
4.01pm and later
Private vehicle Official vehicle Commercial vehicle Motorcycle Ferry Rail Below 5km 5.1-10 km
10 to 15 km
15.1-20 km
20.1-25 km
25.1to 30 km
The study shows that 6.01 am – 6.30 am and 6.31 pm -8.30 pm constitute the morning and afternoon peak periods respectively for the work and business trips in each of the fifteen Local Government areas that constitute the Lagos metropolis.
However, the regular pattern of journeys for shopping, and recreational trips reveals a different pattern of trips. The study shows that the residents travel for shopping and recreational activities before 12 noon and return later after 5pm every day while the residents depart for social activities at 8 am and return home later after 5pm every day.
In the area of the modal split, the study reveals that the majority of residents in each of the fifteen local Government areas make use of similar modes of transport which are commercial vehicles, private vehicles, official vehicles, motorcycles, rail and ferry to their various trip purposes. However, it is observed that more than 95% of residents depend on the road while relative proportion (less than 5%) of residents depends on other modes (i.e. Rail and Ferry) of transport. The implication of this situation is the presence of too many vehicular traffic on the roads during the peak periods leading to congestion and loss of valuable man-hours in the Lagos metropolis.
The study reveals that there is variation in distance in kilometers traveled by residents to the various journeys of purpose in each of the fifteen Local Government Areas in Lagos metropolis. The distance in kilometers traveled by residents depends on the proximity of the area to their various journeys purpose within the Lagos metropolis. The distance in kilometers for residents that make work and business trip travels amount up to 15-25 kilometers radius to their residence while those for social, shopping and recreational trips travel less than 15 kilometers radius to their residence.
References
Adeniyi, K. (1985), Urban Transportation System in Nigeria , ODU: A Journal of West African Studies, Vol. 28, pp. 81-97.
Adeniji, K. (1991), Urban Mobility Crisis, where do we go from here? , Paper delivered at Ogun State Public Service Forum Gateway Hotel, Abeokuta.
Adeniji, S.A. (1981), Public Transportation and Urban Development strategy in Nigeria , Unpublished Ph.D Thesis, university of Wales, Pontain.
Axhausen, K.W. and Garling T. (1992), Activity Based Approach to Travel Analysis Conceptual Framework, Models and Research Problem, Transport Reviews, Vo. 12 No. 4, pp. 323-341.
Ayeni, B (1979), Concepts and Techniques in Urban Analysis Croom Helm Ltd, London.
Ayeni, M.A.O. (1974), Predictive Modelling of Urban Spatial Structure: the example of Jos, Benue-Plateau State, Nigeria, Unpublished Ph.D. Thesis, University of Ibadan.
International Journal of Development and Sustainability Vol.1 No.2 (2012): 563–580
ISDS www.isdsnet.com 579
Bhat C.B. and Koppelman, F.S. (1999), A retrospective and prospective survey of time use research ,
Transportation, Vol. 26, pp.119-139.
Federal Ministry of Communications (1999): National Policy on Telecommunications. Main Document, F.M.C. Abuja.
Federal Government of Nigeria (1991), Nigerian National Population Census Abuja, Nigerian National Population CSN mission.
Federal Government of Nigeria (1997), Nigerian National Population Census Abuja, Nigerian National Population CSN mission.
Filani, M.O. and Osayinmese, I.Z. (1979), )ntra-city Traffic Flow Problems in Nigeria The Nigerian
Geographical Journal, Vol. 22 No.1, pp.17-31.
Filani, M.O. (1991), Mobility Crisis in Nigeria Federal Government’s Mass Transit Programme , Annals of the
Social Science Council of Nigeria, No. 3, pp.13-30.
Filani, M.O. (1993), Transport and Rural Development in Nigeria , Journal of Transport Geography, Vol. 1 No.4, pp. 248-254.
Garling T. K. and Golledge R.G. (1994), Computational Process Modelling ofhousehold activity scheduling ,
Transportation Research, Vol. 28B No. 5, pp. 355-364.
Gordon P., Kumaar, A. and Ricahrdson, H.W. (1988), Beyond The Journey to work , Transportation Research, Vol. A 22, pp. 419-426.
Hanson, S. and Schwab, M. (1987), Accessibility and Intra urban travel, Environment and Planning, pp. 735-748.
Hanson, S. (2004), The Context of Urban Travel Concepts and Recent Trends , in
Hanson, S. and Giuliano, G. (Ed.), The Geography of Urban Transportation, 3rd edition, Guilford, New York, pp
3-29.
Hoyle, B.S. and Knowles, R.D. (1998), Transport Geography an )ntroduction , in Hoyles, B.S. and Knowles, R.D. (Ed.), Modern Transport Geography, John Wiley and Sons, pp. 1-12.
Janelle, D.G. (2004), Impact of information Technology , in Hanson, S. and Giuliano, G. (Ed), The Geography of
Urban Transportation, 3rd edition, Guilford, New York, pp. 3-29.
Lagos State Government (2003), Lagos State 2003, Digest, Ikeja, Ministry of Economic Planning and Budget, Central Office of Statistics.
Ojo, O.E. (1990), Urban Travel-activity Pattern: A Case Study of Ibadan, Nigeria Unpublished Ph.D. Thesis, University of Ibadan.
Osoba, S.B. (2010), )nfluence of Global system for Mobile communication on )ntra-city Travel in Lagos, Nigeria, Unpublished Ph.D Thesis, University of Ibadan.
Rimmer P.J. (1986), Rikisha to rapid transit: Urban Public Transport Systems and Policy in South East Asia
Sydney, Pentagon.
Turton B. (1992), Urban Transport Patterns , in Hoyle B.S. and Knowles, R.O. (Ed.) Modern Transport
Geography, Belhaven press, pp. 67-80.
White P.R. (1990), )nadequacies of Urban public transport systems , in Dimitriou H.T. (Ed.), Transport