ALDY FERNANDES DA SILVA [email protected]
Professor at Programa de Mestrado em Ciências Contábeis, Fundação Escola de Comércio Álvares Penteado, São Paulo, SP – Brazil
ELIONOR FARAH JREIGE WEFFORT [email protected]
Professor at Programa de Mestrado em Ciências Contábeis, Fundação Escola de Comércio Álvares Penteado, São Paulo, SP – Brazil
EDUARDO DA SILVA FLORES [email protected] Professor at Fundação Escola de Comércio Álvares Penteado, São Paulo, SP – Brazil
GLAUCO PERES DA SILVA [email protected] Researcher at Faculdade de Filosoia, Letras e Ciências Humanas, Universidade de São Paulo, SP – Brazil
ARTICLES
Submitted 08.26.2012. Approved 03.27.2013
Evaluated by double blind review. Scientiic Editor: Ricardo Ratner Rochman
EARNINGS MANAGEMENT AND ECONOMIC
CRISES IN THE BRAZILIAN CAPITAL MARKET
Gerenciamento de resultados e crises econômicas no mercado de capitais brasileiro
Gestión de resultados y crisis económica en lo mercado de capitales brasileño
ABSTRACT
The 2008 economic crisis challenged accounting, either demanding recognition and measurement criteria well adjusted to this scenario or even questioning its ability to inform appropriately entities’ inancial situation before the crisis occurred. So, our purpose was to verify if during economic crises listed companies in the Brazilian capital market tended to adopt earnings management (EM) practic-es. Our sample consisted in 3,772 irm-years observations, in 13 years – 1997 to 2009. We developed regression models considering discretionary accruals as EM proxy (dependent variable), crisis as a macroeconomic factor (dummy variable of interest), ROA, market-to-book, size, leverage, foreign di-rect investment (FDI) and sector as control variables. Diferent for previous EM studies two approach-es were used in data panel regrapproach-ession models and multiple crisapproach-es were observed simultaneously. Statistics tests revealed a signiicant relation between economic crisis and EM practices concerning listed companies in Brazil in both approaches used.
KEY WORDS |Earnings management, macroeconomic factors, economic crises, emerging capital markets, Brazil.
RESUMO
A crise econômica de 2008 desaiou a contabilidade, demandando critérios de reconhecimento e men-suração ajustados a esse cenário, ou mesmo questionando a sua capacidade de informar adequada-mente a situação econômico-inanceira das entidades antes de sua ocorrência. Nesse trabalho verii-camos se durante crises econômicas as empresas listadas no mercado de capitais brasileiro tendiam a adotar práticas de gerenciamento de resultados (GR). A amostra consistiu de 3.772 observações empre-sas por ano, de 1997 a 2009. Desenvolvemos modelos de regressão com dados em painel, consideran-do accruals discricionários como uma proxy de GR, crise como um fator macroeconômico (variável de interesse), e ROA, market-to-book, tamanho, alavancagem, investimento estrangeiro direto e setor como variáveis de controle. Diferentemente de estudos anteriores sobre GR, duas abordagens foram utilizadas na construção dos modelos e múltiplas crises foram observadas simultaneamente. Os testes estatísticos revelaram, em ambas as abordagens, uma relação signiicativa entre crise e as práticas de GR.
PALAVRAS-CHAVE | Gerenciamento de resultados, fatores macroeconômicos, crises econômicas, mer-cado de capitais emergente, Brasil.
RESUMEN
La crisis económica de 2008 ha desaiado a la contabilidad, exigiendo criterios de reconocimiento y evaluación apropiadamente ajustados a ese escenario, o incluso cuestionando su capacidad de in-formar adecuadamente sobre la situación económico-inanciera de las entidades antes del comienzo de la crisis. Nuestro objetivo ha sido comprobar si durante las crisis económicas las empresas que cotizan en el mercado de capitales brasileño se inclinan a adoptar prácticas de gestión de resultados (GR). La muestra está formada por 3.772 observaciones por empresa/año, durante 13 años (de 1997 a 2009). Desarrollamos modelos de regresión, considerando los ajustes discrecionales (discretionary accruals) como proxy de GR (variable dependiente), la crisis como un factor macroeconómico (variable de interés), ROA, market-to-book, tamaño, impulso, inversión extranjera directa y sector como varia-bles de control. Al contrario de los estudios anteriores sobre gestión de resultados, se han utilizado dos enfoques en los modelos de regresión de datos en panel y se observaron distintos escenarios de crisis simultáneamente. Las pruebas estadísticas revelaron, en ambos enfoques utilizados, una rela-ción signiicativa entre la crisis y las practicas de GR en las compañías presentes en Brasil.
PALABRAS CLAVE | Gestión de resultados, condiciones macroeconómicas, crisis económicas, merca-dos de capital emergentes, Brasil.
INTRODUCTION
During the 90s, the Brazilian economy, through a series of gov-ernment measures, consolidated its pillars. The inlation con-trol, currency stability, and GDP growth, among other factors, corroborated for the development and leverage of the Brazilian capital market.
The Brazilian Stock Exchange BM&FBovespa (formerly Bovespa) grew by 505% (from $255,478.0 million to $1,545,565.7 million) in domestic market capitalization from 1997 to 2010, while the New York Stock Exchange (NYSE, USA) and Tokyo Stock Exchange (TSE, Japan), the irst and second in market capital-ization in 1997 had, respectively, a 51% (from $8,879,630.6 mil-lion to $13,394,081.8 milmil-lion) and a 77% (from $2,160,584.8 million to $3,827,774.2 million) increase over the same period. In December 2010, the BM&FBovespa reached the irst position in Latin America, with a domestic market capitalization great-er than the sum of the othgreat-ers (Argentina, Colombia, Pgreat-eru, Chile, Bermuda and Mexico markets capitalization sum $1,173,438.1 million) and 11th in the world (WFE, 2011).
With the expansion of this form of inancing, accounting information for external users plays (or should play) a relevant role in reducing information asymmetry and thus make more ef-icient the present and future contracts.
Accounting practices for recognition, measurement and disclosure are sensitive to the environment in which they are applied, responding to stimuli arising from the legal systems, political and economic characteristics of users and preparers of inancial statements, cultural values, and other sources.
Derived from this relationship, it was observed that during (and even after) economic crises, accounting has been questioned either by its ability to use instruments capable of recognizing and timely measuring the impact of crisis in the i-nancial position of the entity and, whether by the omission (in-tentional or not) of irms’ relevant information which could allow users to better investment evaluation (e.g. Barth & Landsman, 2010; Hopwood, 2009; Arnold, 2009).
Managers’ opportunistic behaviour can afect negative-ly the quality of accounting information disclosed for external users. When there is a legally permitted range for discretion in choosing the practices for recognition and measurement of accounting elements, managers could deliberately choose the most favourable to their interests at the expense of the one that would represent a closer representation of the econom-ic event.
Earnings management is usually characterized as an op-portunistic manager’s practice that aims to deceive the external user (non-controlling shareholders and stakeholders in
gener-al), using the permissibility in selecting accounting principles for recognition and measurement of elements (assets, liabili-ties, and revenues and expenses) within the limits of the rules, in order to deliberately inform misleading results.
Endogenous and exogenous factors can motivate pos-itive or negative EM practices. Among the internal factors are corporate governance framework and mechanisms (e.g. su-pervisory board, audit committee, compensation policy, inter-nal controls); organizatiointer-nal culture; internatiointer-nalization; size; among others. Previous studies have also identiied several exogenous factors that might afect the EM behavior, such as human and economic development, economic freedom (Ria-hi-Belkaoui, 2004); legal system, including the rules and their enforcement (Leuz, Nanda & Wysocki, 2003); cultural values
(Han, Kang, Salter, & Yoo, 2010) and; audit quality (Tendeloo & Vanstraelen, 2008).
It is expected in that context that economic crises afect the EM behavior. An economic crisis can either stimulate or in-hibit EM practices, depending on the intended purpose. The economic crisis motivates the EM when, for example, it is used as an “excuse” to drop losses from bad past management prac-tices, thereby obscuring the poor performance of the manag-er that could lead to his dismissal; or even when to avoid any “political sanctions” (higher taxes, stricter regulation and su-pervision, withdrawal of incentives), proits that would be sub-stantially larger than those of other companies and/or sectors of the economy are purposely reduced to an “acceptable” level. In companies heavily dependent on the stock market, in turn, it could be a motivation for EM in the post-crisis period, seeking to present positive results and encourage the return or perma-nence of the investor after a period of “bad news”.
On the other hand, the crisis might inhibit the EM, es-pecially when accounting practices were perceived as facilita-tors, as occurred in the post-Enron and subprime crises. For example, the recognition and measurement of revenues, de-rivatives, provisions and related party transactions contribut-ed to cover up the real inancial position, giving more “breath” not only to those companies, but mainly ensuring the perma-nence of their managers despite the poor performance. Con-sequently, to regain market conidence and achieve stability, severe measures were taken, reducing the room for value judg-ment on accounting choices, attributing greater responsibility to managers and boards, overseeing and punishing more rig-orous undesirable behaviors, which leads to creating an unfa-vorable environment to EM.
We justiied, therefore, the present study by: a) social rel-evance of economic crises and the need for research in account-ing on the subject, b) lack of previous studies investigataccount-ing the relationship between economic crises (macroeconomic factors) and earnings management with the approach proposed here (longitudinal data analysis allowing the simultaneous observa-tion of multiple crises), c) diferences in statistical treatment of data compared with previous studies of earnings management.
The paper is organized as follows: review of previous studies and hypothesis development (section 2); methodolog-ical procedure description, including variables, models and sample (section 3); main results with corresponding statistical tests and analysis (section 4); and summary, conclusions and suggestions for future research (section 5).
LITERATURE REVIEW AND HYPOTHESIS
DEVELOPMENT
Earnings management (EM) can be understood as the use of (le-gally allowed) discretion by managers in the selection practic-es of recognition and measurement of accounting elements to deliberately manipulate earnings – to increase or decrease – depending on their interests (e.g. Healy, 1985, Sweeney, 1994, Jones, 1991, Dechow & Skinner, 2000, Healy & Wahlen, 1999).
Since incentives to earnings management practices derive mainly from the environment in which managers operate – capi-tal markets, contracts and political or regulatory costs (Healy & Wahlen, 1999; Watts & Zimmerman, 1978), it is expected that events afecting the environment, would change the conditions / incentives for EM practices. This is the case of economic crises.
Several previous studies have addressed the relationship between accounting (standards and/or practices) and econom-ic crises, either questioning the role of accounting on detect-ing crises in advance (e.g. Barth & Landsman, 2010; Bezemer, 2010; Arnold, 2009) or; investigating changes in accounting in-formation quality, the explanatory power of earnings (e.g. Da-vis-Friday & Gordon, 2005; Graham, King, and Bailes, 2000) and conservatism (e.g. Herrmann, Pornupatham, & Vichitsarawong, 2008) during and after crises, or even the impact of regulations on inancial crises (e.g. Masood, Aktan, & Pariente, 2010).
Some trends in research can be explained by speciic characteristics of crises. The 2007-2008 crisis, for example, giv-en its origin in the credit crisis and the profound social impact of the resulting recession, encouraged the questioning of ac-counting role (e.g. Arnold, 2009; Hopwood, 2009), accounting predictive power (e.g. Bezemer, 2010), the adoption of fair val-ue as measurement basis (e.g. Barth & Landsman, 2010; Boyer,
2007) and the alleged improvement in the information quality with IFRS – International Financial Reporting Standards adop-tion (Bhimani, 2008).
When questioning the role of accounting and its predictive power, the criticism usually ‘spill over’ academics and regula-tors. In this sense, Bezemer (2010, p. 686) argues that there is a
“discrepancy between oicial assessments and reality before and during the 2007–2008 credit crisis and ensuing recession […] the sense of surprise at the credit crisis among academics and poli-cymakers, giving rise to the view that ‘no one saw this coming’”.
Currency crises originating from signiicant currency de-valuation – as occurred in Mexico in 1994 (Davis-Friday & Gor-don, 2005) and Thailand in 1997 (Graham, King, & Bailes, 2000)
justify research about the relevance of accounting information. Previous research also addressed earnings management prac-tices and economic crises. Like the other studies mentioned in this section, a crisis is usually chosen to analyze the relation-ship with accounting practices.
In the oil crises that occurred in the Gulf in the 90s, Han and Wang (1998) observed that the political costs were the main incentive for the practice of EM, seeking an earnings reduction.
Johl, Jubb, and Houghton (2003), as well as Choi, Kim and Lee (2011) focused on the Asian crisis of 1997-1998, but with difer-ent approaches and scopes. Johl, Jubb, and Houghton (2003)
evaluated the audit quality and the EM practices of irms list-ed in Malaysia; while Choi, Kim and Lee (2011) extended their sample to other Asian countries and, after observing the EM be-haviour of listed irms, sought explanations for the results in weakness/strength of institutions in the analyzed countries. These studies used discretionary accruals as EM proxies (dis-cussed in section 3 of this paper).
A change is expected in EM behaviour in crisis period be-cause, as noted earlier, the crisis would afect the incentives for managers – pertaining to market incentives, contracts and po-litical or regulatory costs in this direction.
Considering the analysis of previous studies in this sec-tion and, in particular, the results of the research by Han and Wang (1998) and Johl, Jubb, and Houghton (2003), which ob-served changes in earnings management behaviour in the oil crises of the 90s and the Asian crisis of 1997, respectively, the following research hypotheses, corresponding to the two crises scenarios were proposed for test:
H2: There is a statistically signiicant diference in discretion-ary accruals (used as proxies for earnings management be-haviour) of companies listed in the Brazilian Stock Exchange in periods of economic crisis (1997-1999, 2002 and 2008) in relation to non-crisis (2000, 2003, 2004-2007) periods.
According to the theory of business cycles (e.g. Baner-ji & Dua, 2011; Chauvet, 2002; Burns & Mitchell, 1946, Mitch-ell, 1927), we considered that 1997, 1998, 1999, 2003 and 2008 were years of crisis in the Brazilian economy. Consistently with this criterion, years in which the Brazilian economy moved away from its historical trend of growth were treated as ‘crisis year’.
It was also noticed, among the selected years, that 2003 features distinguished it from the others, which can be ex-plained by the earlier turbulence in 2002. In 2002, due to the expectation of opposition victory in presidential election (Lula – Luis Inácio Lula da Silva was the opposition candidate), fear of economic change and concerns about the ability (and will-ingness) of the future government to honour its commitments largely afected the inancial market. This led us to build a sec-ond scenario replacing 2003 by 2002, in which there a situation closer to the other selected periods was found. The two scenar-ios were included – as the ‘crisis’ variable – in the models and statistical tests.
The next section presents the models, variables, data collection and other methodological choices to test the pro-posed hypotheses.
RESEARCH DESIGN
In this section, we present the methodological procedures for the development of the research. Initially we present the op-erational deinition of the variables, followed by the models of earnings management used and the sample selection.
Operational deinition of variables
In order to develop our models and establish the sample selec-tion criteria, we irst deined the operaselec-tional variables in three groups: dependent variable (earnings management), explana-tory variables: interest (crisis) and control.
Earnings management proxies – dependent
variable
Because the discretion in the choice of practices for recognition and measurement of accounting elements is almost always in-cluded in the EM concept, most of the research on earnings
man-agement has been associated with accruals. The use of accruals is also justiied as a proxy for the diiculty in practice to reliable classifying a practice (normally permitted under law) as EM.
The most common ways to identify EM practices through accruals are: (i) technique of frequency distributions (e.g. McNichols & Wilson, 1988), (ii) analysis of speciic accruals (e.g. Petroni, 1992; Marquardt & Wiedman, 2004), (iii) models for ag-gregate accruals.
In the technique of frequency distribution – the simplest of the three – an analysis of cross-sectional data is used to ob-serve variations in the results considering a speciic event (e.g. a regulatory change). The analysis of speciic accumulations, in turn, has been employed to evaluate practices of EM in the recognition and measurement of speciic items and restricted by sectors (e.g. claim loss reserves in insurance companies –
Petroni, 1992).
The analysis of accruals aggregate seeks to identify the EM behaviour by obtaining the accruals totals and their sub-sequent segregation between discretionary and nondiscre-tionary, the latter considered a proxy of EM. For our study we chose the latter approach because: a) our sample covers 19 dif-ferent sectors; b) it is not possible to reliably identify speciic accounts more prone to EM, c) evaluation of the aggregates al-lows to better deal with the efects of speciic events (as regu-lation). The irst models known for identiication of EM through discretionary accruals (accrual total – accruals non-discretion-ary) are DeAngelo (1986) and Healy (1985), which might explain the prominence of positivist theory (Watts & Zimmerman, 1986)
during this period. However, it was in the 90s that EM studies of with this approach proliferated, highlighting the models pro-posed by Jones (1991); Dechow, Sloan, and Sweeney (1995),
known as Jones (1991) modiied; and Kang and Sivaramakrish-nan (1995).
Since the proposition of these models, several stud-ies have adopted them to identify EM practices and/or moti-vational factors associated to them in, diferent countries or groups of countries, especially: (i) Jones (1991) model – e.g.
Beneish (1997); Erickson and Wang (1999); (ii) Jones modi-ied model by Dechow, Sloan, and Sweeney (1995) – e.g. Mo-nen (2003); Gill-de-Albornoz and Illueca (2005); (iii) Kang and Sivaramakrishnan (1995) model – e.g. Yoon and Miller (2002);
and (iv) two or three of them compared – e.g. McNichols (2000); Kothari, Leone, and Wasley (2005). Several also the proposed modiications to these models, mostly with the inclusion of vari-ables in the model originally proposed by Jones (1991) and mod-iied by Dechow, Sloan, and Sweeney (1995).
ac-cruals (and therefore EM evidence) are not subject to direct ob-servation and, therefore, are estimated by regressions. In these regressions, the discretionary accruals are the portion “unex-plained” (error) of total accruals. In its abundant replication in subsequent studies, several changes were proposed in these models, especially with regard to “purify” the portion associated with discretionary accruals with the inclusion of control variables.
To test the hypotheses of our study, we developed mod-els based on Jones (1991) modiied model proposed by Dechow, Sloan, and Sweeney (1995), with adjustments to include the ex-planatory variables of crisis (in the interest of research) and con-trol variables. A detailed analysis of models and their changes are made in sections 3.1.3 and 3.2.
Economic crisis proxies – explanatory
variables of interest
In the scope of economic science, we can say that the theme ‘eco-nomic crisis’ is closely linked to the existence of eco‘eco-nomic cycles. These cycles were determined originally by the luctuating pro-duction levels of a given economy over time. The literature that is currently designated for business cycles goes back to very re-mote periods in the literature of economics. A seminal work in this area is due to Mitchell (1927) who observed the luctuations of the U.S. economy. Other economists like Kuznets (1926) and Schumpeter (1982) also dedicated themselves to understand the oscillation movements of production levels. Currently, as shown by Banerji and Dua (2011), consideration should be given to a set of macroeconomic variables in order to identify the formation of economic cycles and not just the production level as a way to identify variations in aggregate economic activity.
The most widely used deinition of business cycles dates back to the seminal work of Mitchell. According to Burns and Mitchell (1946):
Business cycles are a type of luctuation found in the aggregate economic activity of nations that organize their work mainly in business enterpris-es: a cycle consists of expansions occurring at about the same time in many economic activities, followed by similarly general recessions, contrac-tions and revivals that merge into the expansion phase of the next cycle; this sequence of changes is recurrent but not periodic.
This deinition has been widely used since then. Even more contemporary deinitions – like that of Lucas Jr. (1977), which de-ined the economic cycle as deviations of aggregate real product from its tendency – are similar to the original vision. In this
con-text, one can consider that periods of crisis would be the times of recession of product level generated in a given economy. The de-termination of these periods considers, therefore, empirical eval-uation criteria, basically analysis of time series, in which the luc-tuations are observed but, this assessment is not trivial.
In the evaluations made for Brazil, there were long peri-ods where there is a product growth. This movement occurred primarily to the mid-70s of last century. In contrast, the two inal decades of the century show a reversal of this cycle. They are pe-riods when the national product has short cycles of growth fol-lowed by larger cycles of decline. Chauvet (2002) adopted NBER (National Bureau of Economic Research) deinition of recessions that correspond to general reductions in various economic sec-tors lasting at least 6 months, in order to avoid the inluence of short-term events.
According to Chauvet (2002), between 1997 and 1999, there were moments of descent in the Brazilian business cycle. In 2001 and 2003 there was also a decrease of activity in Brazil
(Chauvet & Morais, 2010). Thus, for the purposes intended here, these were identiied as years of crisis in the Brazilian economy. Since studies mentioned in this section do not consider the year 2008 in their research, this was not initially marked ini-tially as a year of crisis. However, due to the extent of the crisis around the world, we decided to consider it a crisis year.
Accordingly to our hypotheses, the explanatory variables of interest are the crisis variables, deined as dummy. The vari-able CRISESI denotes a dummy varivari-able which equals 1 for years deined as a crisis (1997-1999, 2001, 2003 and 2008), and 0 for non-crisis years (2000, 2002, 2004-2007 and 2009).
As explained in introduction (section 1), since 2003 pres-ents some diferent characteristics from the other ‘crisis pe-riods’, we constructed another scenario, replacing 2003 for 2002, which is justiied by the strong economic turbulence in a pre-election period. This second scenario demanded anoth-er crisis variable: CRISESII which equals 1 for years deined as a crisis (1997-1999, 2001, 2002 and 2008), and 0 for non-crisis years (2000, 2003, 2004-2007 and 2009).
Control explanatory variables
Previous studies (Othman & Zeghal, 2006; Stubben, 2010; Han, Kang Salter, & Yoo, 2010) also suggested that large irms tend to exercise less discretion in accounting results, due to stronger monitoring by the stock market. Thus, the natural logarithm of total assets (divided by one billion) in the current year was used as a control variable for irm size (SIZE). This pro-cedure allowed the variable to be used with the same scale of measurement of model variables.
Other studies pointed out that measures of discretionary accruals are misspeciied for irms with extreme levels of perfor-mance (e.g. Dechow, Sloan, & Sweeney, 1995; McNichols, 2000; Larcker & Richardson, 2004; Kothari, Leone, & Wasley, 2005). We used the term return on assets (ROA) to control irm perfor-mance. This variable was obtained by the database Economati-ca® and represent the ratio of the net income over total assets, following the recommended by McNichols (2000), Kothari, Le-one, and Wasley (2005), and Jones, Krishnan, and Melendrez (2008). Furthermore, according to McNichols (2000), Larcker and Richardson (2004), Burgstahler, Hail, and Leuz (2006) and
Othman and Zeghal (2006), companies presenting growth in their operations, tend to have large values of accruals. So, the market-to-book (MTB) variable, calculated by the market capitalization at the end of the iscal year divided by the book value of common equity and obtained at the database Economatica®, was chosen as a proxy for growth opportunity of the company’s operations.
We also included the leverage as a control variable, ob-tained as the ratio of loans and inancing over total assets. The leverage variable was used in logarithmic scale (denoted by LEV) in order to linearize its relation with the accruals. It is appropriate to include this variable in the models because the leverage of the company might encourage managers to manip-ulate earnings, for example, to prevent the violation of debt covenants (e.g. Sweeney, 1994; Dichev & Skinner, 2002) or to maintain/raise a good credit rating in order to achieve more fa-vourable conditions from creditors (e.g. Charitou, Lambertides, & Trigeorgis, 2007; DeAngelo, DeAngelo, & Skinner, 1994). How-ever, the presence of creditors could be important for inhibiting opportunistic behaviour of managers, as noted Jensen (1986). Thus, some studies have found a tendency for earnings man-agement practices in irms with low levels of leverage (Dechow & Skinner, 2000; Jelinek, 2007).
Finally, a control variable for foreign direct investment (FDI) was inserted to address, at least partially, the irms’ de-pendence of foreign funding and, consequently, their exposure
to the economic crises, accordingly to their origin (external or internal) and extent. Moreover, as observed in previous studies
(e.g. Nobes, 1998; Zarzeski, 1996), the sources of inancing can afect the accounting practices.
Earnings management models
The models most commonly used in earnings management pre-vious studies (as mentioned in section 3.1.1) are based on mea-sures of aggregate total accruals, where discretionary accruals are used as a proxy for EM (Jones, 1991; Dechow, Sloan, & Swee-ney, 1995; McNichols, 2000).
In our estimated models, the dependent variables used were the total accruals (TA) in the current period delated by to-tal assets in the previous period (A). Total accruals were calculat-ed as the diference between the change in current assets and the change in cash and cash equivalents, less the diference between the change in current liabilities and the variation in provision for IRPJ and CSLL (both income taxes to which Brazilian companies are subject), less depreciation and amortization. So, we use as explanatory variables in developing the total accruals model the following variables: a) the inverse of the total assets (INVAT); b) the diference between the change in gross revenues and the change in accounts receivable (ΔREVC) and; c) ixed assets (PPE).
In this study, we adjusted Dechow, Sloan, and Sweeney (1995) EM model, also known as Jones modiied model, includ-ing more partitioninclud-ing variables such as proposed in previous studies (e.g. McNichols, 2000; Kothari, Leone, & Wasley, 2005; Han, Kang, Salter, & Yoo, 2010; Choi, Kim, & Lee, 2011), in or-der to make it more robust for testing the research hypotheses. Thus, to study the efect of crises in discretionary accruals, we use this adjusted model through two distinct approaches, here referred to: (i) two-step (partitioning variables), irst estimat-ing discretionary accruals (earnestimat-ings management) controlled by performance (ROA) and then testing its relation with crisis vari-able and the remaining control varivari-ables; (ii) one-step, using an unique model to estimate discretionary accruals including both crisis variable and the control variables.
Two-step approach
The model used in the irst approach (two-step) considered the decomposition of total accruals (TA) in non-discretionary accru-als (NDAC) and discretionary accruals (DAC) as:
��
���
��−1=
�
0+
� �����
��+
�
2∆����
���
��−1+
�
3���
���
��−1Where TAit represents total accruals of irm i in year t, de-lated by total assets in year t – 1; represents the total assets of irm i in year t – 1, and INVAT, ΔREVC
it, PPEit and ROAit , repre-sent, respectively, for irm i in year t, the inverse of total assets, the diference between the change in gross revenues and the change in accounts receivable (ΔREVit – ΔRECit), the ixed assets and the return on assets (ROA, as a proxy for the control vari-able, irm performance).
Using the model (1), the discretionary accruals (DACit) are estimated by residuals , where they are the diference be-tween total accruals and the estimated mean of non-discretion-ary accruals (NDACit). In this case, the efect crisis variable in discretionary accruals is estimated by the regression between discretionary accruals DACit and the crisis variables (CRISESI e
CRISESII), previously deined in section 3.1.2; considering the assumption of control variables, i.e.,
This approach is commonly adopted in earnings management studies (e.g. Defond & Subramanyam, 1998; McNichols, 2000;
Lacker & Richardson, 2004; Kothari, Leone, & Wasley, 2005; Othman and Zeghal, 2006; Han, Kang, Salter, & Yoo, 2010).
One-step approach
The model used in the second approach (one-step) considered that the efect of crisis variables on discretionary accruals can be directly estimated by the relation between total accruals and crisis variables (e.g. Han & Wang, 1998). Thus, when the control variables were added, the regression model was given by:
��
���
��−1=
�
0+
�
1�����
��+
�
2∆����
���
��−1+
�
3���
���
��−1+
�
4���
��+
�
5���
��+
�
6����
��+
�
7���
��+
�
8���
��+
�
�
�������
�� 27�=9
+
�
28�����
��+
�
��. (3)
���
��=
�
0+
�
1���
��+
�
2����
��+
�
3���
��+
�
4���
��+
�
�
�������
�� 23�=5
+
�
24������
��+
�
��. (2)
In model (3), we added control variables MTB, SIZE, LEV,
FDI and SECTOR – which represent, respectively, market-to-book, company size, leverage, foreign direct investment and sector of business activity – to previous total accruals model (1). Therefore, the hypotheses of diference in discretionary ac-cruals due to the occurrence of crisis can be tested by the inclu-sion of crisis variables (CRISESI and CRISESII) previously deined in section 3.1.2. The efect of crisis variable can be estimated by the coeicient β28 associated with the variable CRISESit.
The models (1 and 2) and (3) were estimated using the re-gression methodology for panel data, according to Wooldridge (2002) and Othman and Zeghal (2006).
Sample selection and data
In order to evaluate and validate the research hypotheses, we considered a sample of 445 companies listed on Brazilian stock exchange – BM&FBOVESPA during the period 1997 to 2009, which consisted initially of a panel with 3,941 irm-years obser-vations in the study period (13 years).
Companies’ data, i.e. all the variables required for the construction of empirical models of aggregate accruals, beyond the control variables described in section 3.1.2, were extracted from Economatica® database.
From the initial sample, we excluded companies: i) that did not have data on at least four years in the series; ii) with missing data for depreciation and amortization, assets and lia-bilities, due to their impact on aggregate accruals measure; iii) with missing data for ixed assets PPE. To mitigate the efects of outliers in the sample, we winsorized the variables: total accru-als (TA), INVAT, DREVC, PPE, ROA, MTB and LEV, using percen-tiles of 0.5% and 99.5%. The inal sample consisted of the un-balanced panel, therefore of 3,772 of irm-years observations.
RESULTS
regres-sion models with panel data (unbalanced data) used to evaluate the hypotheses of discretionary accruals in periods of crisis are pre-sented. Finally, we perform inferences with discretionary accruals estimates based on models (1) and (2), described in section 3.2, to assess how they behave in relation to crisis variables.
Descriptive statistics
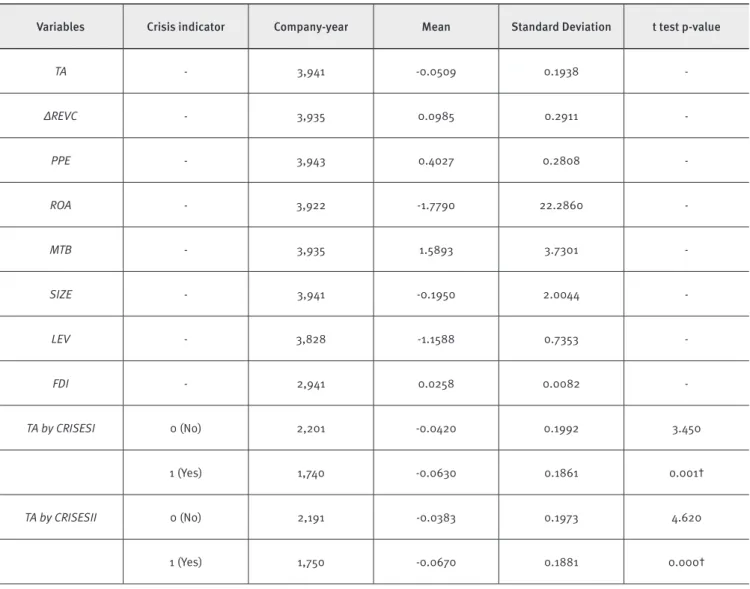
Table 1 shows the descriptive statistics of total accruals (TA) for the total sample and by crisis variables (CRISESI and CRISESII). Re-sults indicate an average value of -0.0509 for total accruals besides a high variability (0.1938). It is noticed that total accruals aver-ages by crisis variables are lower in periods of crisis when compared to non-crisis periods. The t test indicates that, statistically, the
TA average in periods of crisis is lower than the TA average in non-crisis periods (p-value <0.01) when considering both crisis vari-ables (CRISESI and CRISESII).
TABLE 1.
Descriptive statistics of total accruals, explanatory and control variables.
Variables Crisis indicator Company-year Mean Standard Deviation t test p-value
TA - 3,941 -0.0509 0.1938
-ΔREVC - 3,935 0.0985 0.2911
-PPE - 3,943 0.4027 0.2808
-ROA - 3,922 -1.7790 22.2860
-MTB - 3,935 1.5893 3.7301
-SIZE - 3,941 -0.1950 2.0044
-LEV - 3,828 -1.1588 0.7353
-FDI - 2,941 0.0258 0.0082
-TA by CRISESI 0 (No) 2,201 -0.0420 0.1992 3.450
1 (Yes) 1,740 -0.0630 0.1861 0.001†
TA by CRISESII 0 (No) 2,191 -0.0383 0.1973 4.620
1 (Yes) 1,750 -0.0670 0.1881 0.000†
Levels of signiicance: ‘ ** ‘ 10% ‘ * ‘ 5% ‘ † ‘ 1%.
TABLE 2.
Spearman correlation matrix between models’ variables.
Variables TA INVAT DREVC PPE ROA MTB SIZE LEV
INVAT -0.030
*0.059
-ΔREVC 0.002
0.923
-0.010
0.528
-PPE -0.222
†0.000
-0.074 †0.000
0.161
†0.000
-ROA 0.261
†0.000
-0.228 †0.000
0.211 †0.000
-0.093
†0.000
-MTB 0.047
†0.003
-0.348 †0,000
0.138 †0.000
-0.065 †0.000
0.331
†0.000
-SIZE 0.022
0.172
-0.988 †0.000
0.051 †0.002
0.094 †0.000
0.248 †0.000
0.367 †0.000
LEV -0.216
†0.000
-0.128 †0.000
-0.038 *0.0190
-0.333 †0.000
-0.305 †0.000
-0.060 †0.001
-0.135 †0.000
FDI -0.009
0.579
-0.044 †0.005
-0.029 0.073
-0.023 0.143
0.045 †0.005
0.113 †0.000
0.056 †0.000
-0.063 †0.000
Levels of signiicance: ‘ * ‘ 5% ‘ † ‘ 1%.
Results of regression
The models in section 3.2 were developed under the regression approach (longitudinal) for panel data, according to Wooldridge (2002). The models were adjusted using the R® software (version 2.13). In order to adjust the models we used the methodology of models with random efects for two reasons: a) the test results of Breusch-Pagan Lagrange multiplier (Wooldridge, 2002), which indicated the presence of unobserved heterogeneity (therefore, the use of panel regression technique is appropriate), b) the exis-tence and inclusion of control variables that do not vary over time (SECTOR).
Initially, we developed the model described in (1) according to the so-called two-step approach here. The results are presented in Table 3.
TABLE 3.
Panel data regression with random efects for TA.
Model – Dechow, Sloan, and Sweeney (1995) extended model:
��
���
��−1=
�
0+
�
1�����
��+
�
2∆����
���
��−1+
�
3���
���
��−1+
�
4���
��+
�
��.
Variables Coeicient standard error t value p-value
Constant 0.0091 0.0063 1.4481 0.1477
INVAT -345.6200 291.7400 -1.1847 0.2362
ΔREVC -0.0340 0.0159 -2.1304 0.0332 *
PPE -0.1230 0.0144 -8.5627 < 0.0000 †
ROA 0.0026 0.0006 3.4281 < 0.0000 †
N = 3,772 R² adjust. = 0.1095
F-statistic 115.9850 < 0.0000 †
The results exposed in Table 3 corroborate those found in literature, since the variables, ΔREVC e PPE showed statistical signiicance. In addition, the ROA variable was highly signiicant (p-value <0.01), like McNichols (2000) and Kothari, Leone, and Wasley (2005). Inclusion of the variable ROA strongly altered the coeicients of the variables INVAT (-345.6200 and 291.7400) and DREVC (-0.0340 and 0.0159) when compared with the coef-icients of the model obtained from Dechow, Sloan, and Swee-ney (1995) model – INVAT (-992.2000 and 326.0700) and ΔREVC
(-0.0146 and 0.0173). In addition, the adjusted R2 of the model was equal to 10.95%, compared to the adjusted R2 of 4.05% ob-tained from Dechow, Sloan, and Sweeney (1995) model, indicat-ing the relevance of variable ROA to control the efect of the per-formance of companies in the discretionary accruals.
The efect of crisis in accruals was tested by adjusting the models (1) and (2), described in section 3.2. After adjusting the
model (1), Table 3, the discretionary accruals (DACit) were ob-tained for each irm-year. Thus, the efect of crisis variables in discretionary accruals was estimated by the regression between discretionary accruals (DACit) and the crisis variables (CRISESI
and CRISESII) previously deined in section 3.1.2, considering the existence of control variables.
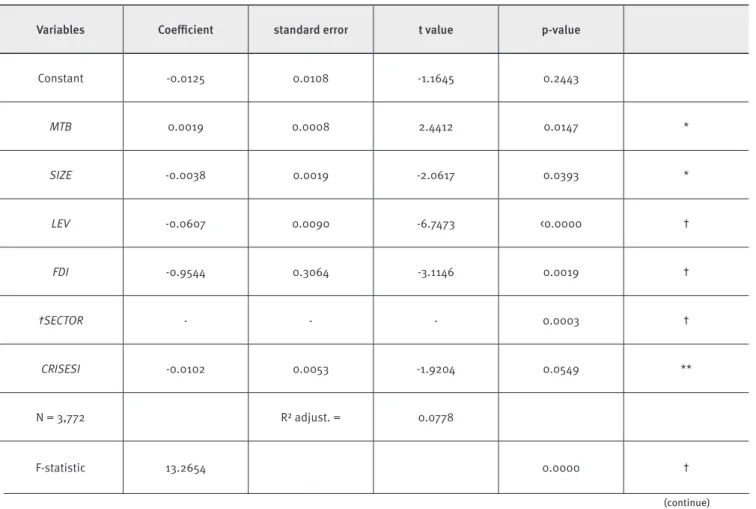
Table 4 presents the results of the adjustment in the re-gression model with panel data (random efects) for the discre-tionary accruals, where MTB, SIZE, LEV, FDI and SECTOR were considered as control variables. Table 5 presents the results of itting the model (2), where besides the inclusion of ROA con-trol variable, we added MTB, SIZE, LEV, FDI and SECTOR. Thus, the hypothesis of diference in discretionary accruals due to the occurrence of crises has been tested by the inclusion of crisis variables (CRISESI and CRISESII) directly in the regression of to-tal accruals.
TABLE 4.
Regressions of discretionary accruals
DAC
, estimated by
two-step
approach with crisis variables
(
CRISESI
and
CRISESII
).
P anel A :
����� =�0+�1�����+�2������+�3�����+�4�����+∑23�=5����������+�24���������+���.
Variables Coeicient standard error t value p-value
Constant -0.0125 0.0108 -1.1645 0.2443
MTB 0.0019 0.0008 2.4412 0.0147 *
SIZE -0.0038 0.0019 -2.0617 0.0393 *
LEV -0.0607 0.0090 -6.7473 <0.0000 †
FDI -0.9544 0.3064 -3.1146 0.0019 †
†SECTOR - - - 0.0003 †
CRISESI -0.0102 0.0053 -1.9204 0.0549 **
N = 3,772 R² adjust. = 0.0778
F-statistic 13.2654 0.0000 †
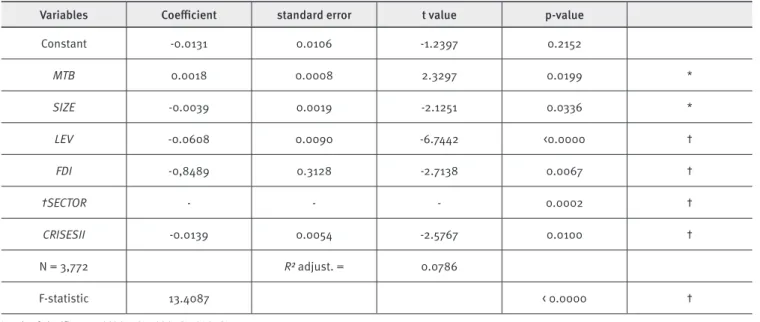
TABLE 4.
Regressions of discretionary accruals
DAC
, estimated by
two-step
approach with crisis variables
(
CRISESI
and
CRISESII
).
P anel B :
����� =�0+�1�����+�2������+�3�����+�4�����+∑23�=5����������+�24����������+���.
Variables Coeicient standard error t value p-value
Constant -0.0131 0.0106 -1.2397 0.2152
MTB 0.0018 0.0008 2.3297 0.0199 *
SIZE -0.0039 0.0019 -2.1251 0.0336 *
LEV -0.0608 0.0090 -6.7442 <0.0000 †
FDI -0,8489 0.3128 -2.7138 0.0067 †
†SECTOR - - - 0.0002 †
CRISESII -0.0139 0.0054 -2.5767 0.0100 †
N = 3,772 R² adjust. = 0.0786
F-statistic 13.4087 < 0.0000 †
Levels of signiicance: ‘ ** ‘ 10% ‘ * ‘ 5% ‘ † ‘ 1%.
† Variable SECTOR (19 sectors) signiicance was evaluated by a sequential F-test.
TABLE 5.
Regressions of total accruals (
TA
) with crisis variables (
CRISESI
and
CRISESII
) and control variables using
the
one-step approach
.
P anel A : ����
��� −1=�0+�1������� +�2
∆������ ��� −1 +�3
�����
��� −1+�4�����+�5����� +�6������ + �7����� +�8����� + ∑27 ����������
�=9 +�28���������+���.
Variables Coeicient standard error t value p-value
Constant -0.0183 0.0125 -1.4636 0.1434
INVAT -334.9900 330.2100 -1.0145 0.3104
ΔREVC -0.0187 0.0154 -1.2114 0.2258
PPE -0.1325 0.0191 -6.9510 < 0.0000 †
ROA 0.0016 0.0005 3.2361 0.0012 †
MTB 0.0020 0.0007 2.6633 0.0078 †
SIZE -0.0021 0.0026 -0.8090 0.4186
LEV -0.0842 0.0118 -7.1668 < 0.0000 †
FDI -0.9886 0.3018 -3.2758 0.0011 †
†SECTOR - - - 0.0129 *
CRISESI -0.0120 0.0053 -2.2527 0.0243 *
N = 3,772 R² adjust. = 0.1970
F-statistic 33.1131 < 0.0000 †
(conclusion)
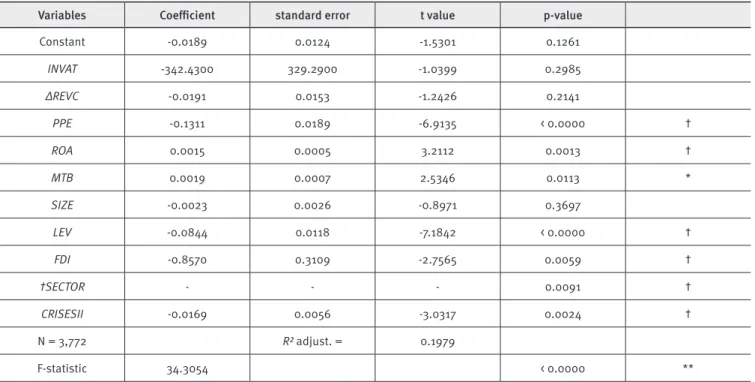
TABLE 5.
Regressions of total accruals (
TA
) with crisis variables (
CRISESI
and
CRISESII
) and control variables
using the one-step approach.
P anel B : ����
��� −1
=�0+�1������� +�2∆������
��� −1
+�3�����
��� −1
+�4�����+�5����� +�6������ +
�7����� +�8����� + ∑�27=9���������� +�28���������� +���.
Variables Coeicient standard error t value p-value
Constant -0.0189 0.0124 -1.5301 0.1261
INVAT -342.4300 329.2900 -1.0399 0.2985
ΔREVC -0.0191 0.0153 -1.2426 0.2141
PPE -0.1311 0.0189 -6.9135 < 0.0000 †
ROA 0.0015 0.0005 3.2112 0.0013 †
MTB 0.0019 0.0007 2.5346 0.0113 *
SIZE -0.0023 0.0026 -0.8971 0.3697
LEV -0.0844 0.0118 -7.1842 < 0.0000 †
FDI -0.8570 0.3109 -2.7565 0.0059 †
†SECTOR - - - 0.0091 †
CRISESII -0.0169 0.0056 -3.0317 0.0024 †
N = 3,772 R² adjust. = 0.1979
F-statistic 34.3054 < 0.0000 **
Levels of signiicance: ‘ ** ‘ 10% ‘ * ‘ 5% ‘ † ‘ 1%.
† Variable SECTOR (19 sectors) signiicance was evaluated by a sequential F-test.
The results presented in Tables 4 and 5 indicate the difer-ence in discretionary accruals in periods of crisis and non-crisis. Some previous studies (e.g., Othman & Zeghal, 2006) revealed that variables ROA, MTB, SIZE, LEV and SECTOR were statistical-ly signiicant. In our study, the control variables ROA, MTB, LEV,
FDI and SECTOR were also statistically signiicant, which did not occur with the SIZE in the model using the one-step approach. The statistical signiicance of the SECTOR variable was tested using a sequential F-test, where the interest was to evaluate changes in accruals behaviour across diferent sectors (Econo-maticaÒ sectors classiication was used).
Regarding the signiicance of the control variables, the variable ROA showed positive signal indicating that irms with extreme performance tend to manage more their results (in line with McNichols, 2000; Kothari, Leone, & Wasley, 2005). The positive sign of the variable MTB indicates that companies with higher growth expectations tend to manage more results (in ac-cordance with Othman & Zeghal, 2006; Arnedo, Lizarraga, & Sánchez, 2007). The negative sign of LEV observed in the mod-els indicates that companies with higher leverage tend to man-age less their results, as noticed before by Dechow and
Skin-ner (2000), Jelinek (2007) and Han, Kang, Salter, & Yoo (2010). As noted in Nobes (1998) and Zarzeski (1996), the sources of i-nancing can afect the accounting practices. In our study, this relationship indicated that companies with greater reliance on foreign investment are less likely to manage their results.
Finally, the results showed in Table 4 indicated that large irms (variable SIZE) tend to exercise less discretion in accounting results as observed in Othman and Zeghal (2006), Stubben (2010) and Han, Kang, Salter, & Yoo (2010). However, this result was not observed in Table 5 (one-step approach). This is due to the fact that in the irst approach (two-step), the statistical signiicance of crisis variables and control variables were assessed by the regression of discretionary accruals DACit, (unobservable), which might have in-troduced a bias to the results of the models in Table 4.
Table 4 show the statistical signiicance of the variables of crisis (CRISESI signiicant at 10% and CRISESII signiicant at 1%). The crisis scenario deined by the variable CRISESII report-ed higher discretionary accruals than CRISESI. Still considering the results of the models presented in Table 4, we observe an adjustment of the models (Panel A and B) with adjusted R2equal to 7.78% and 7.86% respectively.
In Table 5, the statistical signiicance of crisis variables was assessed directly in the models of total accruals (one-step approach) using a panel data regression of total accruals as a function of crisis variables, considering the control variables
ROA, MTB, SIZE, LEV, FDI and SECTOR. The models presented, respectively, adjusted R2 equal to 19.70% and 19.76%. Results obtained by the models (Panel A and B) when using this ap-proach are identical to the models presented in Table 4 ( two-step approach), when we analyze the statistical signiicance of crisis variables.
In summary, the signiicance of the crisis variable in the models indicates that, as expected on the basis of the literature review conducted, this is a motivating factor for EM practices could aim either to reduce or increase the earnings. In the irst case, such a practice might be used, for example, to “dump” poor results from prior periods or even to avoid government sanctions (e.g. withdrawal of subsidies), covering a higher than expected performance. In the second, such a practice could be adopted especially to bring “good news”, retaining or attracting fearful investors.
The estimated models (two-step and one-step approach) did not fulil the basic assumptions imposed by a statistical technique of regression (homogeneity and normality of errors), which requires precaution in the results analyzed. However, the results obtained in all models showed stable coeicients and statistical signiicance for all control variables (with the excep-tion of the SIZE variable in the model using one-step approach), which is consistent with previous studies.
Inference on discretionary accruals
To complete the studies on the behaviour of accruals in relation to crisis variables, inferences were made about the discretion-ary accruals DACit (unobservable) estimated by: (i) the Dechow, Sloan, and Sweeney (1995) model with extension (McNichols, 2000; Kothari, Leone, & Wasley, 2005; Han, Kang, Salter & Yoo, 2010), using the two-step approach and; (ii) the model (2) – one-step approach (both described in section 3.2).
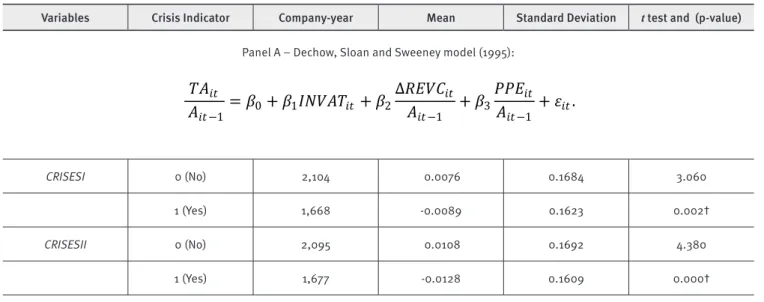
In each of these models, as shown in Table 6, discretion-ary accruals DACit were estimated without the presence of crisis variables. Then a t test was conducted to evaluate the diference in discretionary accruals for periods of crisis and non-crisis.
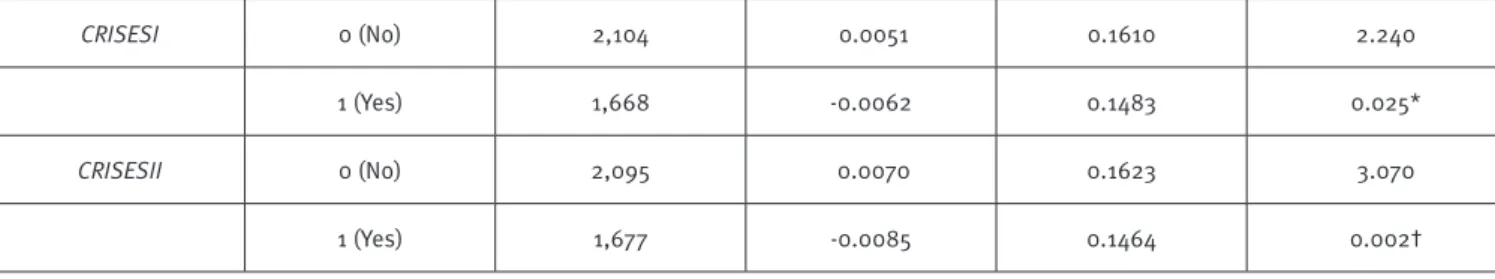
The results in Table 6 indicate that, regardless of the ap-proach (and model) used, there is a change in discretionary accrual behaviour when we consider the periods of crisis and non-crisis, i.e., the average discretionary accruals in periods of crisis is statistically diferent from the average in non-crisis pe-riods. We also observed that the signiicance is greater in the model corresponding to Panel A, when discretionary accruals were estimated with no regard to irm performance (control vari-able ROA). When the efect of control variables ROA and ROA,
MTB, SIZE, LEV, FDI and SECTOR was considered, respective-ly, in models of Panels B and C, we assume that we are getting “more pure” discretionary accruals, which could alter the sta-tistical signiicance of crisis variables of crisis, i.e., the discre-tionary accrual behaviour when we analyze according to the pe-riods of crisis.
In fact, this efect occurs, but without compromising the statistical signiicance of crisis variables. Again, we observed a greater signiicance when using the crisis scenario CRISESII.
TABLE 6.
Inference in discretionary accruals according to the variables of crises.
Variables Crisis Indicator Company-year Mean Standard Deviation t test and (p-value)
Panel A – Dechow, Sloan and Sweeney model (1995):
��
���
��−1=
�
0+
�
1�����
��+
�
2∆����
���
��−1+
�
3���
���
��−1+
�
��.
CRISESI 0 (No) 2,104 0.0076 0.1684 3.060
1 (Yes) 1,668 -0.0089 0.1623 0.002†
CRISESII 0 (No) 2,095 0.0108 0.1692 4.380
1 (Yes) 1,677 -0.0128 0.1609 0.000†
TABLE 6.
Inference in discretionary accruals according to the variables of crises.
Variables Crisis Indicator Company-year Mean Standard Deviation t test and (p-value)
Panel B – Dechow, Sloan and Sweeney (1995) extended model:
��
���
��−1=
�
0+
�
1�����
��+
�
2∆����
���
��−1+
�
3���
���
��−1+
�
4���
��+
�
��.
CRISESI 0 (No) 2,104 0.0052 0.1665 2.170
1 (Yes) 1,668 -0.0064 0.1592 0.030*
CRISESII 0 (No) 2,095 0.0074 0.1681 3.110
1 (Yes) 1,677 -0.0091 0.1568 0.002†
P anel C :
������� −1
=
�
0+
�
1�����
��+
�
2∆��������� −1
+
�
3�������� −1
+
�
4���
��+
�
5���
��+
�
6����
��+
�
7���
��+
�
8���
��+
∑
27�=9�
�������
��+
�
��.
CRISESI 0 (No) 2,104 0.0051 0.1610 2.240
1 (Yes) 1,668 -0.0062 0.1483 0.025*
CRISESII 0 (No) 2,095 0.0070 0.1623 3.070
1 (Yes) 1,677 -0.0085 0.1464 0.002†
Levels of signiicance: ‘ ** ‘ 10% ‘ * ‘ 5% ‘ † ‘ 1%.
SUMMARY AND CONCLUSIONS
Our purpose was to verify if during economic crises listed, com-panies in Brazilian stock exchange tended to adopt earnings management practices. To achieve our goal, a 3,772 irm-years observation sample was selected from 1997 to 2009 and tested with regression models, diferent approaches (one and two-step statistical tests) and two diverse scenarios for crises (consider-ing the theory of business cycles).
After a descriptive analysis to observe variable be-haviour, we ran the regression analysis using both the two-step approach – estimating discretionary accruals (EM proxy) con-trolled by performance (ROA) before testing its relation with cri-sis variable and the remaining control variables and the one-step approach – an unique model including discretionary accruals, both the crisis variable and the control variables – for the two crises scenarios (CRISESI and CRISESII) in order to test the proposed hypotheses – i.e. there is a statistically signiicant
diference in discretionary accruals (used as proxies for earn-ings management behaviour) of companies listed in the Brazil-ian stock exchange in periods of economic crisis in relation to non-crisis periods.
The results obtained revealed that crisis variables were signiicant in accruals models developed. Furthermore statis-tical tests on discretionary accruals identiied statisstatis-tically sig-niicant diferences between the means comparing crisis and non-crisis periods, despite the models tested (two-step and
one-step approaches) for estimating these accruals. These dif-ferences were observed in both planned scenarios. For the irst scenario, crisis deinition was based strictly on economic con-cepts of business cycles theory. On the second scenario, an eco-nomic environment of instability in Brazil was also considered due to the 2002 political process. Thus, it is appropriate to in-fer that managers’ behaviour changed during economic crises periods. Explanations for such changes were not covered by our models.
Although, as mentioned before, the inherent subjectivi-ty implied in earnings management concept and the limitations of using discretionary accruals as proxy (e.g. they cannot be ob-served directly) alert us to be cautious about the implications of our results and it can be said, at least, that regulators should be more alert to managers’ manipulations on accounting numbers during crises. In this sense, our study can be useful for inves-tors and crediinves-tors. This is particularly relevant for capital mar-kets that presented rapidly growth in the past ten years and are trying to gain domestic and foreigner investors’ conidence. This is the case of Brazil, our focus, but it can also be applied in oth-er markets, eithoth-er emoth-erging or developed.
REFERENCES
Arnedo, L., Lizarraga, F., & Sánchez, S. (2007). Does public/private sta-tus afect the level of earnings management in code-law contexts out-side the United States? A study based on the Spanish case. The Interna-tional Journal of Accounting, 42(3), 305–328.
Arnold, P. J. (2009). Global inancial crisis: the challenge to accounting research. Accounting, Organizations and Society, 34(6–7), 803–809.
Banerji, A., & Dua, P. (2011). Predicting recessions and slowdowns: a ro-bust approach. Working paper 202. Centre for Development Economics. Delhi School of Economics.
Barth, M., & Landsman, W. R. (2010). How did inancial reporting con-tribute to the inancial crisis? European Accounting Review, 19(3), 399-423.
Bezemer, D. J. (2010). Understanding inancial crisis through accounting models. Accounting, Organizations and Society, 35(7), 676-688.
Bhimani, A. (2008). The role of a crisis in reshaping the role of account-ing. Journal of Accounting Public Policy, 27(6), 444-454.
Boyer, R. (2007). Assessing the impact of fair value upon inancial cri-ses. Socio-Economic Review, 5(4), 779–807.
Burgstahler, D., Hail, L., & Leuz, C. (2006). The importance of reporting incentives: earnings management in European private and public irms. The Accounting Review, 81(5), 983-1016.
Burns, A. F., & Mitchell, W. C. (1946). Measuring Business Cycles. NBER Book Series Studies in Business Cycles. Cambridge: NBER.
Charitou, A., Lambertides, N., & Trigeorgis, L. (2007). Earnings be-haviour of inancially distressed irms: the role of institutional owner-ship. Abacus, 43(3), 271-296.
Chauvet, M. (2002). The Brazilian business and growth cycles. Revista Brasileira Economia, 561, 75-106.
Chauvet, M., & Morais, I. (2010). Predicting Recessions in Brazil. 6th Col-loquium on Modern Tools for Business Cycle Analysis: the Lessons from Global Economic Crisis. Eurostat, Luxembourg, September.
Choi, J., Kim, J., & Lee, J. J. (2011). Value relevance of discretionary accru-als in the Asian inancial crisis of 1997-1998. Journal of Accounting and Public Policy, 30(2), 166-187.
Davis-Friday, P., & Gordon, E. A. (2005). Relative valuation roles of eq-uity book value, net income, and cash lows during a macroeconomic shock: the case of Mexico and the 1994 currency crisis. Journal of Inter-national Accounting Research, 4(1), 1-21.
DeAngelo, L. E. (1986). Accounting numbers as market valuation sub-stitutes: A study of management buyouts of public stockholders. The Accounting Review, 61(3), 400-420.
DeAngelo, H., DeAngelo, L., & Skinner, D. (1994). Accounting choice in troubled companies. Journal of Accounting and Economics, 17(1-2), 113-143.
Dechow, P. M., & Skinner, D. J. (2000). Earnings management: reconcil-ing the views of accountreconcil-ing academics, practitioners, and regulators. Accounting Horizons, 14(2), 235-250.
Dechow, P. M., Sloan, R. G., & Sweeney, A. P. (1995). Detecting earnings management. The Accounting Review, 70(2), 193-225.
DeFond, M. L., & Subramanyam, K. R. (1998). Auditor changes and dis-cretionary accruals. Journal of Accounting and Economics, 25(1), 35-67.
Dichev, I., & Skinner, D. (2002). Large-sample evidence on the debt cov-enant hypothesis. Journal of Accounting Research, 40(4), 1091-1123.
Erickson, M., & Wang, S. (1999). Earnings management by acquiring irms in stock for stock mergers. Journal of Accounting and Economics, 27(2), 149-176.
Gill-de-Albornoz, B. G., & Illueca, M. (2005). Earnings management un-der price regulation: empirical evidence from the Spanish electricity in-dustry. Energy Economics, 27(2), 279-304.
Graham, R., King, R., & Bailes, J. (2000). The value relevance of account-ing information duraccount-ing a inancial crisis: Thailand and the 1997 decline in the value of the baht. Journal of International Financial Management & Accounting, 11(2), 84-107.
Han, J. C. Y., & Wang, S. (1998). Political costs and earnings manage-ment of oil companies during the 1990 Persian Gulf crisis. The account-ing Review, 73(1), 103-117.
Han, S., Kang T., Salter, S., & Yoo, Y. K. (2010). A cross-country study on the efects of national culture on earnings management. Journal of International Business Studies, 41(1), 123-141.
Healy, P. M., & Wahlen, J. M. (1999). A review of the earnings manage-ment literature and its implications for standard setting. Accounting Horizons, 13(4), 365-383.
Healy, P. M. (1985). The efect of bonus schemes of accounting deci-sions. Journal of Accounting and Economics, 7(1-3), 85-107.
Herrmann, D. R, Pornupatham, S., & Vichitsarawong, T. (2008). The im-pact of the Asian inancial crisis on auditors’ conservatism. Journal of International Accounting Research, 7(2), 43-63.
Hopwood, A. (2009). The economic crisis and accounting: implications for the research community. Accounting, Organizations and Society, 34(6) 797-802.
Jelinek, K. (2007). The efect of leverage increases on earnings manage-ment. Journal of Business & Economic Studies, 13(2), 24-46.
Jensen, M. C. (1986). Agency costs of free cash low, corporate inance, and takeovers. American Economic Review, 76(2), 323-329.
Jones, J. (1991). Earnings management during import relief investiga-tions. Journal of Accounting Research, 29(2), 193-228.
Jones, K., L., Krishnan, G. V., & Melendrez, K. D. (2008). Do models of discretionary accruals detect actual cases of fraudulent and restated earnings? An empirical analysis. Contemporary Accounting Research, 25(2), 499-531.
Kang, S., & Sivaramakrishnan, K. (1995). Issues in testing earnings man-agement and an instrumental variable approach. Journal of Accounting Research, 33(2), 353-367.
Kothari, S. P., Leone, A. J., & Wasley, C. E. (2005). Performance matched discretionary accrual measures. Journal of Accounting and Economics, 39(1), 163-197.
Kuznets, S. S. (1926). Cyclical luctuations: retail and whole-sale trade. New York: Adelphi.
Larcker, D. F., & Richardson, S. A. (2004). Fees paid to audit irms, accru-al choices, and corporate governance. Journaccru-al of Accounting Research, 42(3), 625-658.
Leuz, C., Nanda D., & Wysocki, P. D. (2003). Earnings management and investor protection: an international comparison. Journal of Financial Economics, 69(3), 505-527.
Lucas Jr., R. E. (1977). Understanding business cycles. Carnegie-Roches-ter Conference Series on Public Policy, 5, 7-29.
Marquardt, C. A., & Wiedman, C. I. (2004). How are earnings managed? An examination of speciic accruals. Contemporary Accounting Re-search, 21(2), 461-491.
Masood, O., Aktan, B., & Pariente, G. (2010). A discussion of inancial regulations’ impact on the subprime crisis: implications for inancial markets. International Journal of Business, 15(1), 51-69.
McNichols, M. (2000). Research design issues in earnings management studies. Journal of Accounting and Public Policy, 19(4-5), 313-345.
McNichols, M., & Wilson, G. P. (1988). Evidence of earnings manage-ment from the provision for bad debts. Journal of Accounting Research, 26(Supplement), 1-31.
Mitchell, W. C. (1927). Business cycles: the problem and its setting. New York: National Bureau of Economic Research.
Nobes, C. (1998). Towards a general model of the reasons for interna-tional diferences in inancial reporting. Abacus, 34(2), 162-187.
Othman, H. B., & Zeghal, D. (2006). A study of earnings management motives in the Anglo-American and Euro-Continental accounting mod-els: the Canadian and French cases. The International Journal of Ac-counting, 41(4), 406-435.
Petroni, K. R. (1992). Optimistic reporting in the property casualty in-surance industry. Journal of Accounting and Economics, 15(4), 485-508.
Riahi-Belkaoui, A. (2004). Is earnings management afected by human development and economic freedom? Review of Accounting and Fi-nance, 3(1), 115-127.
Schumpeter, J. (1982). The theory of economic development: an inquiry into proits, capital, credit, interest and the business cycle (Social Sci-ence Classics Series). Piscataway, NJ: Transaction Publishers.
Stubben, S. (2010). Discretionary revenues as a measure of earnings management. The Accounting Review, 85(2), 695-717.
Sweeney, A. (1994). Debt-covenant violation and managers’ accounting responses. Journal of Accounting and Economics, 17(3), 281-308.
Tendeloo, B. V., & Vanstraelen, A. (2008). Earnings management and au-dit quality in Europe: evidence from the private client segment market. European Accounting Review. 17(3), 447-469.
Watts, R. L., & Zimmermam, J. L. (1978). Towards a positive theory of the determination of accounting standards. The Accounting Review, 53(1), 112-134.
WFE – World Federation of exchanges. (2011). WFE database. Retrieved on 02 Nov. 2011 from http:www.wordexchanges.org/statistics.
Wooldridge, J. M. (2002). Econometric analysis of cross section and panel data. Cambridge, Massachusetts: MIT Press.
Yoon, S. S., Miller, G. (2002). Earnings management of seasoned equity ofering irms in Korea. The International of Accounting, 37(1), 57-78.