SHAPE PARAMETERS USED IN
GROWTH ESTIMATION OF TUMORS
USING MAMMOGRAPHY
SONALI BHADORIA
Assistant Prof,Electronics Dept,MAE,Alandi, Pune University, Pune, Maharashtra, India
[email protected] http://maepune.ac.in
Dr. C.G. DETHE
Principal,PIET,NagpurUniversity, Nagpur,Maharashtra, India
[email protected] http://www.piet.ltjss.net Abstract :
Analysis of tumor size is very important input for the doctors in deciding the stage of the cancer and surgical approach. Various parameters gives different information about the tumor. This affects treatment decisions, and hence plays a significant role. This paper proposes the effective methodology for analysis of shape and size of the tumors present in the breast using mammograms. It gives detail study of each tumor present in the mammogram and predicts the growth rate. It is a powerful tools to assist the doctors in the treatment related to breast cancer.
Keywords: Mammogram; Thresholding; Area, Roughness
1. Introduction
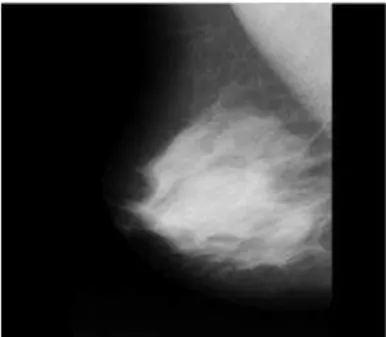
Breast cancer is the leading cause of cancer deaths among women in many countries. Breast cancer incidence and death rates generally increases with age according to studies.. During 2000-2004, 95% of new cases and 97% of breast cancer deaths occurred in women aged 40 and older [1],[2]. Amongst the many imaging techniques available for breast cancer detection mammography is considered as the most effective method. Breast tumors can be very easily extracted from these mammograms and can be further used for analysis. Fig 1 shows an example of a mammogram which is the x-ray image of the breast.
Most of the research done related to mammograms aims towards the computer aided detection of mammogram tumors which gives the classification of mammograms. In addition of this better knowledge of size and shape of the tumor tumor growth will benefit the evaluation of screening programs [3], as well as the interpretation of
clinical trials and epidemiological studies. It has been observed that The mean time a tumor needed to grow from 10 mm to 20 mm in diameter was estimated as 1.7 years, increasing with age.[4]
2. Significance of Size and Shape in Medical Terms
To stage cancer, the American Joint Committee on Cancer first places the cancer in a letter category using the tumor, nodes, metastasis (TNM) classification system. Here we concentrate on T that indicates tumor size. The stage of a breast cancer describes its size and the extent to which it has spread. The letter T is followed by a number from 0 to 4, which describes the size of the tumor and whether it has spread to the skin or chest wall under the breast. Higher T numbers indicate a larger tumor and/or more extensive spread to tissues surrounding the breast.
Stage I : early stage breast cancer where the tumor is less that 2 cm, and hasn't spread beyond the breast(T1)
Stage II : early stage breast cancer in which the tumor is either less than 2 cm across and has spread to the lymph nodes under the arm; or the tumor is between 2 and 5 cm (with or without spread to the lymph nodes under the arm); or the tumor is greater than 5 cm and hasn't spread outside the breast(T2)
Stage III : locally advanced breast cancer in which the tumor is greater than 5 cm across and has spread to the lymph nodes under the arm; or the cancer is extensive in the underarm lymph nodes; or the cancer has spread to lymph nodes near the breastbone or to other tissues near the breast(T3)
Stage IV : metastatic breast cancer in which the cancer has spread outside the breast to other organs in the body(T4).
Various shape features of the images gives the information of malignancy ex smoothness, solidity etc. It not only helps us in finding the stage but also we can predict the type as well.
3. Methodology
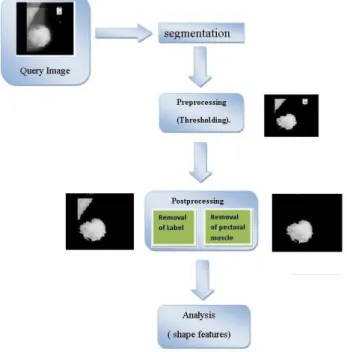
We have done the experimentation on MAIS data base. Entire work flow is show in in the fig 2.
Initially mammogram image was segmented in two stages: a) Preprocessing which is thresholding the image to remove normal breast tissue b) Postprocessing which involves removing of unwanted part like pectoral muscles and other labeling.
In second stage we find no of tumors present in the mammogram and extracts various shape feature to analyze the properties of the tumors.
3.1. Image Segmentation
Image segmentation is a very first step in processing the mammogram image for further analysis. [5]. Segmentation of mammograms can be done in two basic steps. In the first step we aim to remove the unwanted breast part and in the second we try to remove the pectoral muscles. This gives us the exact ROI. It is required to segment the mammography images into various texture regions representing different tissue types. The main objective behind the segmentation of the medical image is to separate the tumor from the background. [6]. The increase in size of medical image database, has led to the use of computers in facilitating their processing and analysis. Estimation of the volume of the whole organ, parts of the organ and/or objects within an organ i.e. tumors is important step in the analysis of medical image [7]. There are various problems which we face during the segmentation as mentioned here. Raw digital mammograms are medical images that are difficult to interpret [8]. Lesser radiation dose of mammography images degrades the contrast and the overall visibility of the micro calcifications and tumorous mass regions from the surrounding tissue. Due to presence of edges of low signal-to-noise ratio and complicated structured background, detection of a subtle mass on a mammogram is a difficult task [9]. There is a problem in segmentation of mammogram to a simple fatty and non-fatty set of regions due to large differences in parenchymal type appearances and variability of image acquisition parameters [10]. Pectoral muscle detection is a challenging task because it is not very well differenced from the surrounding breast tissue. There is very small intensity variation of the pectoral muscle and the tumor tissue for each mammogram images. Due to the presence of pectoral muscle detection procedures gets biased , and hence should be removed during mammogram pre-processing [11]
3.1.1 Preprocessing
The preprocessing phase aims at locating the region containing tumor and eliminating the normal breast tissue from the mammogram.[12] In this way, the size of the image to be segmented is reduced, and the complexity of the Post- segmentation phase is decreased. that intensity ranges of pectoral muscles also falls in the range of tumor so that part cant be removed in this stage. There are various ways to achieve preprocessing
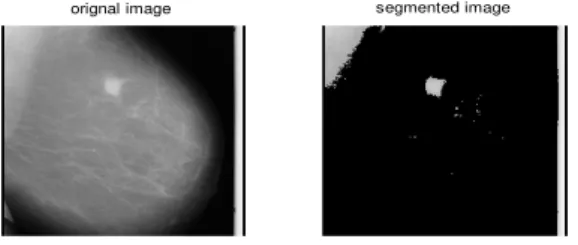
i)Thresholding :- There is a significant intensity difference in normal breast tissue(background) and tumor
(foreground). Perfect threshold can easily separate foreground from background and can be calculated from Otsu’s method or mean max method. [13] This is one of the very simple way segmentation however it cant give us the accurate results. Fig 3 shows the result of thresolding .
Fig 3: a) Orignal Image b) Thresholded image
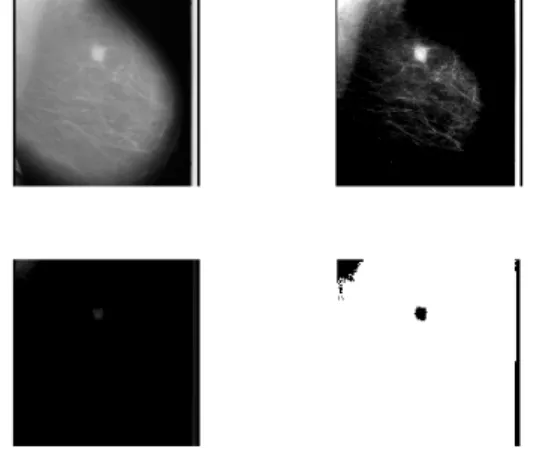
ii) Contrast Stretching:- Contrast stretching is the simplest method used for enhancement. In this we adjust
the histogram to achieve a greater separation between the foreground and background gray-level distributions. [14] Accurate intensity used can give very good results. Here contrast is adjusted as
shown in fig 4(b) and then subtracted from the original image as show in in fig 4 (c). Complement is of the result is shown in fig 4(d).
Fig 4:- Contrast Enhancement
iii) K mean Clustering:- K-mean clustering is one of the method for post processing which forms a cluster
of equal intensity region. Outputis shown in figure 5
Fig 5 Output of Kmeans clustering
3.1.2 Post processing
This phased aims to extract the exact ROI by removing pectoral muscles and otherlabeling. Pectoral muscles are the regions in mammograms that contain brightest pixels. These regions must be removed before detecting the tumor cells so that mass detection can be done efficiently. Pectoral muscles lie on the left or right top corner depending on the view of the image. We must detect the position of the pectoral muscles (left top corner or right top corner) before removing it [15]. Extracting the pectoral muscle [16, 17, 18] is particularly important in automated mammogram image assessment. Segmentation of the pectoral muscle is a non-trivial, complex and demanding task. It is also complicated due to a number of factors. Firstly, the muscle edge is not a straight line, but can be convex, concave or a mixture of both. Secondly, muscle edge though may appear to be visually continuous; the edge exhibits variations in texture and sharpness [19].
We propose a method of region labeling to remove the unwanted region. Binary form of output of preprocessing can be given to the input of post processing unit to get the different labeled regions. We can get lot many regions which are not of use. For this we need to use the filters which give the regions of significant area. Fig 6(c) shows the different labeled regions. ROI is tumor so we can select this manually using GUI or
we can use some filters. Area based filter may work on some images but when nodule size is very small it will not work. Here we get the exact ROI as shown in 6(d).
Fig 6 mdb002 (a) Orignal Image (b) Preprocessed Image (c) Region separated Image (d)ROI
3.2. Analysis.
Once we get this ROI various shape features can be extracted from the images. We can even find out number of nodules present in the image and there size. For 10 sample images having single tumor normal features were extracted. From that special features were calculated. We can divide them in some classes which is very useful during the analysis.
Circle class:- It indicates how a tumor is closed like a circle. Sphericity, Circularity, Roundness, and
compactness are the major feature explaining this class.
Holes removed
(a)
(b)
(c)
Noncircle Class:- It indicates the deviation from circle class towards other class. Indicates how the shape diverges from a circle in overall form. This class includes Aspect Ratio, Elongation and orientation. As the shape changes the aspect ratio will change. This becomes especially apparent as the particle shape becomes more elongated.
Roughness Class: Indicates how the shape of the tumor diverges from a smooth surface. This class
Includes Convexity, Solidity, and Concavity. This class is important class to decide the malignancy in the tumors as malignant tumors tend to be rough.
Table no. 1 shows the feature comparison of 10 tumor images having a single tumor.
Table1. Special Features
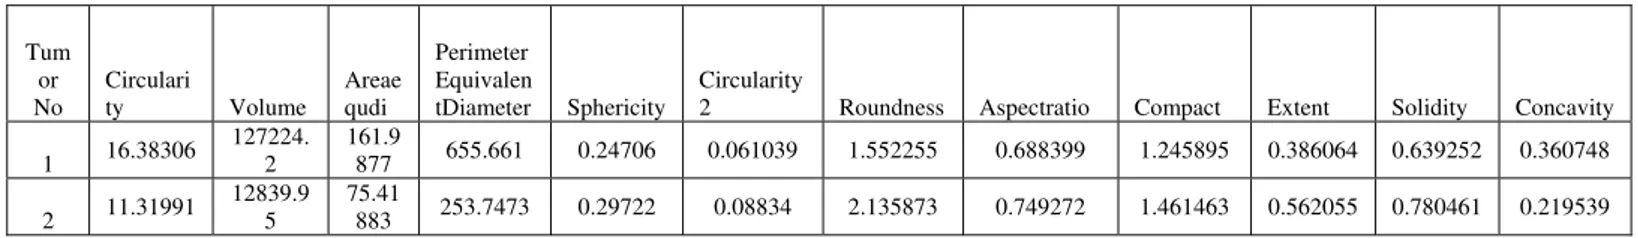
However we can have the images with more that one tumors. Each tumor can be separately located and features of that tumors can be separately find out for the further study as shown in fig 7 and table 2.
(a)
(b)
(c)
(d) (e)
Fig 7 (a) Original image with tumor and calcinations ( b) Thresholded Image (c) Post processed image (d) and (e) Calcinations and tumor
Table 2 Comparison of tumors in the same image Image Circularity Volume Areaequdi
Perimeter Equivalent
Diameter Sphericity Circularity2 Roundness Aspectratio Compact Concavity
1 0.774169 1.6E+08 123.7969 108.925 1.136533 1.291707 0.094136 0.77038 0.306816 0.179788
2 2.136824 44887.18 44.0935 64.45534 0.684094 0.467984 0.699437 0.739406 0.836323 0.156354
3 56.2478 1907413 399.4296 2995.663 0.133336 0.017778 1.544687 0.632583 1.242855 0.352321
4 32.86627 1911072 399.6849 2291.358 0.174431 0.030426 1.212821 0.489252 1.101281 0.356996
5 2.159781 220300.4 61.26989 90.04342 0.680448 0.46301 0.318354 0.436864 0.564229 0.202464
6 7.713685 38899.86 42.03875 116.7564 0.360055 0.12964 0.190828 0.352797 0.436839 0.506927
7 3.455488 40764.14 42.69987 79.37454 0.537954 0.289395 0.352559 0.390355 0.593766 0.28827
8 0.118675 5.6E+08 39.06373 13.45716 2.902822 8.426373 0.010836 0.573258 0.104097 0.205944
9 5.461176 10265649 269.6472 630.1429 0.427914 0.183111 0.463249 0.483568 0.680624 0.202753
10 0.252536 2.35E+09 66.88135 33.60984 1.989934 3.959836 0.014216 0.755353 0.119233 0.219528
Tum or No Circulari ty Volume Areae qudi Perimeter Equivalen tDiameter Sphericity Circularity
2 Roundness Aspectratio Compact Extent Solidity Concavity
1 16.38306
127224. 2
161.9
877 655.661 0.24706 0.061039 1.552255 0.688399 1.245895 0.386064 0.639252 0.360748
2 11.31991
12839.9 5
75.41
883 253.7473 0.29722 0.08834 2.135873 0.749272 1.461463 0.562055 0.780461 0.219539
regnprp
3.3 Growth and location of the tumor
Very minute change in the shape or size can not be easily seen by the human eyes and some important
information may get loss. Using this growth rate of the tumor in same patient after multiple screening during the treatment can be calculated. This can give the instant result of the treatment. Using this input they can decide or change the mode of treatment if needed.
Tumor spread is very important information for the doctors. We can easily do that job by finding the centroid of the tumor , elongation and orientation in previous screening and the latest one.
Growth = (Area1-Area2)*100/Area1………..(1)
Where Area1 is the Area calculated in previous screening and Area2 is Area calculated in latest screening.
Fig 8 (a) Area comparison (b)Orientation Comparison
Fig 10 shows the comparison graph of some features for different tumors. Similarly it can be calculated for the same patient to closely monitor the changes occurred.
References
[1] American Cancer Society,Breast Cancer Facts and Figures 2007-2008,Atlanta,Georgia:American Cancer Society ,Inc.2007.
[2] Jaya Sharma & Sujeet Sharma,”Mammogram Image Segmentation using Watershed”, International Journal of Information Technology and Knowledge anagement.
[3] Berry DA, Cronin KA, Plevritis SK, Fryback DG, Clarke L, Zelen M, Mandelblatt JS, Yakovlev AY, Habbema JD, Feuer EJ: Effect of screening and adjuvant therapy on mortality from breast cancer. N Engl J Med 2005, 353:1784-1792.
[4] Harald Weedon-Fekjær, Bo H Lindqvist, Lars J Vatten, Odd O Aalen and Steinar Tret,’Breast Cancer Tumor Growth Estimated Through Mammography Screening Data’, Breast Cancer Research 2008, 10:R41 doi:10.1186/bcr2092
[5] Byung-Woo Hong and Michael Brady,” Segmentation of Mammograms in Topographic Approach”, Medical Vision Laboratory, University of Oxford, U.K.
[6] Sonali Bhadoria, Preeti Agrawwal, CG Dethe, Renu Vig,’ Role of Segmentation in Medical Imaging: A Comparative Study ‘,International Journal of Computer Applications (0975 – 8887)’
[7] H.B.Kekre and Saylee Gharge “ Texture Based Segmentation using Statistical Properties for Mammographic Images”,(IJACSA) International Journal of Advanced Computer Scirnce and Apllications,Vol, 1,No.5,November 2010.
[8] Moti Melloul and Leo Joskowicz,”Segmentation of microcalcification in X-ray mammograms using entropy thresholding”,School of Computer Science and Engineering.
[9] Indra Kanta Maitra,Sanjay Nag and Samir K.Bandyopadhyay,”Dtection of Abnormal Masses using Divide and Conquer Algorithm Digital Mammogram”,Dept. of Computer Science & Engineering, University of Calcutta, 92 A.P.C. Road,Kolkata-700009,West Bengal,India.
[10] Dr.H.B.Kekre1, Saylee M. Gharge2 and Tanuja K. Sarode3,”Image Segmentation of Mammographic Images Using Kekre’S Proportionate Error Technique on Probability Images”, International Journal of Computer and Electrical Engineering, Vol.2, No.6, December, 2010 1793-8163.
[11] STYLIANI PETROUDI AND MICHAEL BRADY,”BREAST DENSITY SEGMENTATION USING TEXTURE”,WOLFSON MEDICAL VISION
LABORATORY ,OXFORD UNIVERSITY,OXFORD,OX@7DD,UNITED KINGDOM.
[12] Claudio Marrocco, Mario Molinara, Ciro D’Elia, Francesco Tortorella,’ A computer-aided detection system for clustered microcalcifications’, Artificial Intelligence in Medicine 50 (2010) 23–32
[13] Sonali Bhadoria, Yash bharwani, Anikta Pati,’ Removal Of Pectoral Muscle In Mammograms Using Statistical Parameters’, IJCA,April 2011
[14] H.D. Cheng∗, Xiaopeng Cai, Xiaowei Chen, Liming Hu, Xueling Lou,’ Computer-aided detection and classi"cation of microcalci"cations in mammograms: a survey, Pattern Recognition 36 (2003) 2967 – 2991
[16] T.S.Subhashini,V.Ramalingam &S.Palanivel, “Pectoral Muscle removal and Detection of masses in Digital Mammogram using CCL”,IJCA(0975-8887) Volume 1-No.6.
[17] K. Thangavel, And M.Karnan,”Computer Aided Diagnosis in Digital Mammograms: Detection of microcalcifications by Meta Heuristic Algorithms”, GVIP Journal,Volume 5,Issue 7 July 2005
[18] S.M Kwok,R chandrashekar, and Y.Attikiouzel,”Automatic Pectoral Muscle Segmentation on Mammograms by Straight Line Estimation and Cliff Detection”,7th Australian and New Zealand Intelligent Information Systems Conference 18-21 November 2001,Perth,Western Australia.