Abstract—In the present work, bananas of cvs. Musa nana and Musa Cavendish were dehydrated by hot air drying at 50 ºC and 70 ºC. The purpose of this work was to fit the kinetic data to different thin layer models found in the literature to describe the drying rates of bananas, in order to find out which model better describes the drying kinetics of these two varieties of bananas. The selection of the appropriate drying model was based on their coefficients of determination, which were predicted by non-linear regression analysis using the Sigma Plot program. From the obtained results it was possible to conclude that the drying of both banana varieties had a similar kinetic behaviour, regardless of the operating conditions. As to the influence of the drying temperature on the process, it was observed that increasing the drying temperature from 50 ºC to 70 ºC leads to a diminishing of approximately 34 % and 49 % in the drying time to Musa cavendish and Musa nana, respectively. Furthermore, based on the standard deviation results, as well as on the additional statistical information, the two parameter models such as the Page and modified Page models as well as the Wang & Singh model were the best to describe the drying kinetics of these two kinds of banana varieties.
Keywords—Banana, drying, kinetic model.
I. INTRODUCTION
ANANA is one of the most commonly consumed fruits in several countries, mainly due to its sensory characteristics. It is a calorific food, rich in carbohydrates, minerals, and vitamin E [1].
However, ripe banana is perishable and deteriorates rapidly after harvesting, due to its relatively high moisture content and degradable enzymes such as those that accelerate non-enzymatic browning reactions [2]. Thus, it is of paramount importance to use an appropriate postharvest process to prolong the shelf life of the fruit. The drying process is one of the most popular methods to accomplish such task since it reduces water activity of the material to a level which prevents deterioration. In addition, the banana is dried not only for preservation purposes but also for modification of the taste flavor and texture to meet consumer preferences and to increase the market value of the product [3].
There are many drying techniques available to dry banana, such as sun and solar drying, microwave drying, osmotic
Maria João Barroca is with the CERNAS/ISEC, Polytechnic Institute of Coimbra, Rua Pedro Nunes-Quinta da Nora, 3030-199 Coimbra, Portugal (phone: +351-239-790200; fax: +351-239-790201; e-mail: mjbarroca@ gmail.com).
Raquel P. F. Guiné is with the Research Centre CI&DET, Polytechnic
dehydration, freeze drying, and convective air drying [4]. However, the most common technique used to preserve banana is hot air drying [5-7].
Drying is a complicated process involving simultaneous heat and mass transfer. The drying kinetics of materials may be completely described using their transport properties together with the drying medium. In the case of food drying, the drying constant k is used instead of transport properties. This drying constant combines all the transport properties and may be defined by the thin layer equation [8]. Such equations describe the drying phenomena in a unified way, independently of the controlling mechanism. They have been used to estimate drying times of several products and to generalise drying curves. In the case of agricultural products, the moisture content of the material at any time is generally measured and correlated to the drying parameters under both constant relative humidity and temperature conditions.
Several thin layer equations have been used in the literature to explain drying of several agricultural products and by different methods. For instance, in the case of banana, Smitabhind et al. (2008) [9] developed a mathematical model for optimal design of a solar-assisted drying system, and Swasdisevi et al. (2009) [10] used a combined far-infrared radiation (FIR) and vacuum drying.
The present work aimed to study the effect of temperature on banana drying and to analyze the applicability of several thin layer models described in literature for fitting convective drying data of two banana varieties into the most suitable model through statistical analyses procedures.
II. EXPERIMENTAL PROCEDURE
A. Sampling
The fresh bananas were obtained from a local supermarket. Prior to the start of the experiments, each banana was peeled and sliced by a knife to disks with a thickness of 5 mm. The initial moisture content of fresh banana was 2.06 and 2.61g/g (d.b.) to Musa nana and Musa cavendish varieties, respectively.
B. Methods
The convective drying was made in an electrical FD 155 Binder drying chamber with ventilation (air flow of 0.5 m/s), operated at a constant temperature of 50 ºC and 70 ºC. The sliced samples were placed on a perforated tray inside the chamber and the samples were dried until reaching a final
Drying Kinetics of Banana Slices
(cvs. Musa nana and Musa Cavendish)
Maria João Barroca and Raquel P. F. Guiné
good preservation characteristics as well as good final physical and chemical properties [11].
The moisture content of the samples in all different states (fresh and air dried) was evaluated via a HG53 Halogen Moisture Analyzer from Mettler Toledo with the following operating parameters: temperature = 130ºC and speed set to medium = 3 (in a scale from 1 = very fast to 5 = very slow).
The experimental data obtained for the two temperatures studied were plotted in the form of moisture ratio (MR) versus
time, being MR defined as follows: MR = (W-We)/(W0-We), where W, We, and W0 are, respectively, the moisture content
at time t, the equilibrium moisture content, and the initial moisture content, all expressed in a dry basis (g water/ g dry solids). The equilibrium moisture content was determined from the drying curve, taken for a higher time, assuming no more moisture was exchanged from the samples to the surrounding atmosphere of the chamber.
The software program Sigma Plot (Version 11.0) was used to perform all statistical calculations.
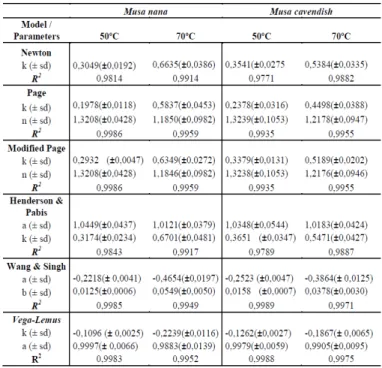
The experimental sets of (MR, t) were fitted to different empirical models well-known in the literature [12], namely Newton, Page, modified Page, Henderson & Pabis, Wang & Singh and Vega-Lemus. The layer drying models are summarized in Table I.
TABLEI
THIN LAYER DRYING CURVES MODELS
Model name Equation
Newton
MR
=
exp(
−
kt)
PageMR
=
exp(
−
kt
n)
Modified Page( )
nkt)
(
exp
MR=
Henderson & Pabis
MR
=
a
exp(
−
kt)
Wang & Singh 2
bt
at
1
MR
=
+
+
Vega-Lemus(
)
2kt
a
MR
=
+
The determination coefficient, R2, was used to access the quality of each model tested.
III. RESULTS AND DISCUSSION
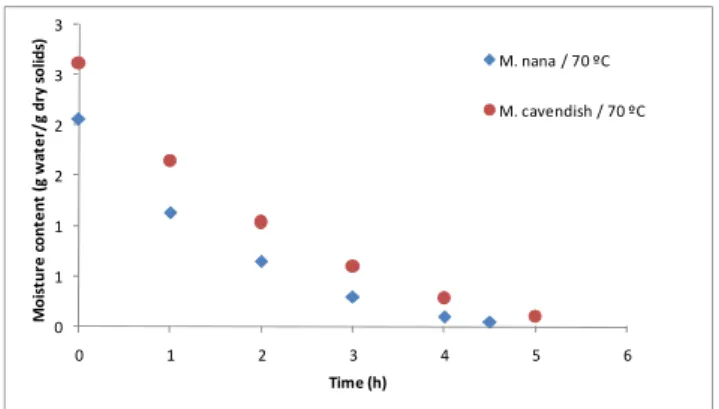
Drying curves of Musa nana and Musa cavendish banana slices performed at hot air drying at 50 ºC and 70 ºC are illustrated in Fig. 1 and Fig. 2, respectively. Due to differences in the initial moisture content of both varieties, the moisture content is expressed in a dry basis.
0 1 1 2 2 3 3 0 1 2 3 4 5 6 7 8 9 10 Mo is tu re co n te n t (g wa te r/ g dr y so lid s) Time (h) M. nana / 50 ºC M. cavendish / 50 ºC
Fig. 1 Profile of moisture content at 50 ºC to Musa nana and Musa cavendish 0 1 1 2 2 3 3 0 1 2 3 4 5 6 Mo is tu re co n te n t (g wa te r/ g dr y so lid s) Time (h) M. nana / 70 ºC M. cavendish / 70 ºC
Fig. 2 Profile of moisture content at 70 ºC to Musa nana and Musa cavendish
From Fig. 1 and 2 it was possible to conclude that the drying of both banana varieties had a similar kinetic behaviour, regardless of the operating conditions. As expected, the influence of temperature on drying rate is clearly evident, that increasing the temperature resulted in a significant improvement of the mass loss rate, especially the initial rate.
The moisture content reduction increased with an augment in the drying temperature from 50 ºC to 70 ºC, because of the major temperature difference between the drying product and the surrounding as well as to the increased moisture diffusivity.
The drying time of Musa nana increased from 4.5 h to 8.75 h when the temperature decreased from 70 ºC to 50 ºC, while the same variable increased from 5 h to 7.5 h for the Musa cavendish variety at the same reduction of temperature.
Moreover, in the initial period of drying the temperature of 70 ºC shows a much faster decrease of moisture content as compared to the temperature of 50 ºC, particularly for Musa nana.
The profile of moisture ratio of Musa nana and Musa cavendish at temperature of 50 ºC and 70ºC, is shown, respectively, in Fig. 3 and 4.
Time (h) 0 2 4 6 8 10 M R = (W - W e )/ (W o - W e ) 0,0 0,2 0,4 0,6 0,8 1,0 1,2 Musa Nana Musa Cavendish
Fig. 3 Moisture ratio of Musa nana and Musa cavendish at temperature of 50 ºC
At the temperature of 50 ºC, it was observed (Fig. 3), that the moisture ratio of Musa nana variety is higher, at any drying time, than the corresponding one observed for the Musa cavendish. This behaviour can, eventually, be attributed to the different initial moisture contents of both varieties that led to significantly different initial drying rates, and thus the drying time [13].
However, when the temperature increased to 70 ºC it was observed the opposite behaviour. At these higher temperatures other factors such as the change of the shrinkage and density along the drying of both varieties and the corresponding effect on the diffusivity, could predominate in the process.
Time (h) 0 1 2 3 4 5 6 MR = (W W e )/ (W o - W e ) 0,0 0,2 0,4 0,6 0,8 1,0 1,2 Musa nana Musa cavendish
Fig. 4 Moisture ratio of Musa nana and Musa cavendish at temperature of 70 ºC
Based on the obtained results to the estimated parameters with the corresponding standard deviation (Table II) as well as the determination coefficient, which characterizes each fitting, it was possible to conclude that generally all the models have a good performance. However, the best models for the case under study are the Page, modified Page and Wang & Singh
2
obtained for the aforementioned models are presented in Table II.
The k value of the models denotes the drying rate constant, a measure of moisture transfer rate from the material [14]. Hence, augmenting the temperature from 50 ºC to 70 ºC allows an increase of the k value of both Page and modified Page models to the two banana varieties. As a result of the important effect of temperature on the drying process, this parameter triplicates in Musa nana and duplicates in Musa cavendish for Page model when the temperature was increased from 50 ºC to 70 ºC. Dandamrongrak et al. (2002) [14] determined a k value of 0.1507 to Page model and dried banana (cavendish variety) in a drying chamber of the heat pump dehumidifier dyer at temperature of 50 ºC and air velocity of 3.1 m/s. The parameter (n) has a lower dependence of this operational condition.
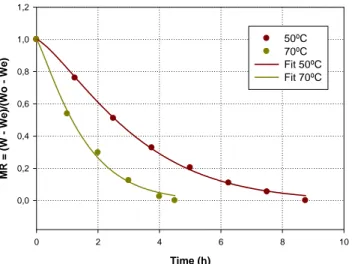
Since all three models reveal a good agreement between the experimental and fitted data, Figs. 5 and 6 illustrate the predictions obtained for both varieties using the Page model at different temperatures.
TABLE II
Time (h) 0 2 4 6 8 10 MR = ( W - W e )/ (W o W e ) 0,0 0,2 0,4 0,6 0,8 1,0 1,2 50ºC 70ºC Fit 50ºC Fit 70ºC
Fig. 5 Fitting the moisture ratio with de Page model to Musa nana at different temperatures Time (h) 0 2 4 6 8 M R = (W - We) /( W o We) 0,0 0,2 0,4 0,6 0,8 1,0 1,2 50ºC 70ºC Fit 50ºC Fit 70ºC
Fig. 6 Fitting the moisture ratio with de Page model to Musa cavendish at different temperatures
As it can be seen, the Page model proved to give good fits for the two varieties of banana and different drying temperatures.
IV. CONCLUSION
The results showed that moisture curves for the drying of banana at 50 ºC and 70 ºC followed a shape characteristic of the drying processes, and gave evidence of a reduction in drying time with the increase in temperature.
The drying kinetics data expressed in the form of moisture ratio versus time, was fitted to different models available in the literature and a good agreement was observed between the experimental and predicted values of the models under study.
However, according to the statistical indicators, the Page, modified Page and Wang & Singh models were the best ones to describe these drying kinetics of convective air banana.
ACKNOWLEDGMENT
The authors thank CI&DETS (Research Centre of the Polytechnic Institute of Viseu) and FCT (Foundation for Science and Technology) for financial support through project PEst-OE/CED/UI4016/2011.
REFERENCES
[1] M. M. Wall, “Ascorbic acid, vitamin A, and mineral composition of banana (Musa sp.) and papaya (Carica papaya) cultivars grown in Hawaii,” J. Food Compos. Anal. Vol. 19, pp. 434–445, 2006.
[2] F. A. N. Fernandes, S. Rodrigues, O. C. P. Gaspareto, E. L. Oliveira, “Optimization of osmotic dehydration of bananas followed by air-drying,” J. Food Eng., vol. 77, 188–193, 2006.
[3] S. Janjai, N. Lamlert, P. Intawee, B. Mahayothee, B. K. Bala, M. Nagle, J. Muller, “Experimental and simulated performance of a PV-ventilated solar greenhouse dryer for drying of peeled longan and banana,” Solar Energy, vol. 83, pp. 1550–1565, 2009.
[4] R. P. F. Guiné, M. J. Barroca (2007) Dried Banana, in Hui YH, Chandan RC, Clark S, Cross N, Dobbs J, Hurst WJ, Nollet LML, Shimori E, Sinha N, Smith EB, Surapat S, Titchenal A, Toldrá F (Eds), Handbook of Food Products Manufacturing: Principles, Bakery, Beverages, Cereals, Cheese, Confectionary, Fats, Fruits and Functional Foods. Chapter 38, pp. 867-878, John Wiley & Sons, Inc., New Jersey, USA. [5] D. Demirel, M. Turhan, “Air-drying behavior of Dwarf Cavendish and
Gros Michel banana slices,” Journal of Food Engineering, vol. 59, pp. 1-11, 2003.
[6] M. A. Karim, M. N. A. Hawlader, “Drying characteristics of banana: theoretical modeling and experimental validation,” Journal of Food Engineering, vol. 70, pp.35–45, 2005.
[7] M. N. Nguyen, W. E. Price, “Air-drying of banana: influence of experimental parameters, slab thickness, banana maturity and harvesting season,” Journal of Food Engineering, vol. 79, pp. 200–207, 2007. [8] I. T. Togrul, D. Pehlivan, “Modelling of thin layer drying kinetics of
some fruits under open-air sun drying process,” Journal of Food Engineering, vol. 65, pp. 413–425, 2004.
[9] R. Smitabhindu, S. Janjai, V. Chankong, “Optimization of a solar-assisted drying system for drying bananas,” Renewable Energy, vol. 33, pp. 1523–1531, 2008.
[10] T. Swasdisevi, S. Devahastin, P. Sa-Adchom, S. Soponronnarit, “Mathematical modeling of combined far-infrared and vacuum drying banana slice,” Journal of Food Engineering, vol. 92, pp.100–106, 2009. [11] M. J. Barroca, R. P. F. Guiné, A. Pinto, F. M. Golçalves, D.M.S.
Ferreira, “Chemical and microbiological characterization of Portuguese varieties of pears,” Food Bioprod. Process., vol. 84, pp. 109–113, June 2006.
[12] E. K. Akpinar “Determination of suitable thin layer drying curve model for some vegetables and fruits,” Journal of Food Engineering, vol. 73, pp. 75–84, 2006.
[13] M. Nguyen, W. E. Price, “Air-drying of banana: Influence of experimental parameters, slab thickness, banana maturity and harvesting season,” Journal of Food Engineering, vol. 79, pp. 200–207, 2007. [14] R. Dandamrongrak, G. Young, R. Mason, “ Evaluation of various
pre-treatments for the dehydration of banana and selection of suitable drying models,” Journal of Food Engineering, vol. 55, pp. 139-146, 2002.