Zone, Portugal). Contributes from machine learning methods
Conference Paper · September 2019CITATIONS
0
READS
14
5 authors, including:
Some of the authors of this publication are also working on these related projects: ArqueometriaView project
ZOM3D: Modelos Metalogénicos 3D de Recursos Minerais da Zona de Ossa MorenaView project Pedro M. Nogueira Universidade de Évora 61PUBLICATIONS 76CITATIONS SEE PROFILE Sandro Vicente Universidade de Évora 13PUBLICATIONS 2CITATIONS SEE PROFILE Miguel Maia Universidade de Évora 26PUBLICATIONS 2CITATIONS SEE PROFILE José Roseiro Universidade de Évora 12PUBLICATIONS 2CITATIONS SEE PROFILE
251
Mapeamento geoquímico de alta resolução na mina de Mociços (Zona de
Ossa-Morena, Portugal). Contributos de métodos de aprendizagem
máquina.
High resolution geochemical mapping in the Mociços mine (Ossa-Morena
Zone, Portugal). Contributes from machine learning methods.
Nogueira, P. 1,2*, Vicente, S.2, Maia, M.2 , Roseiro, J.2, Matos, J.X.3
1 Departamento de Geociências da Escola de Ciências e Tecnologia da Universidade de Évora. Apartado 94, 7000 Évora,
Portugal.
2 Instituto de Ciências da Terra. Apartado 94, 7000 Évora, Portugal.
3 Laboratório Nacional de Energia e Geologia (LNEG), Campus de Aljustrel; Bairro da Vale d´oca 14, 7601-909 Aljustrel
Resumo: A mina de Mociços foi explorada para cobre no início do século XX. Uma campanha recente
de geoquímica de solos com um equipamento portátil de fluorescência de raios-X permitiu mapear com alta definição o envolvente desta antiga exploração. A análise dos resultados com recurso a métodos de aprendizagem máquina, nomeadamente, análise de componentes principais, aglomeração hierárquica e k-média e respetivo mapeamento das observações permite melhor entender o comportamento geoquímico dos elementos.
A análise de componentes principais e o método de k-média tem resultados semelhantes e permitem definir a zona da mineralização e de rochas filonianas ácidas aflorantes. O método de aglomeração hierárquica permite agrupar, além das zonas mineralizadas, os materiais das escombreiras. Através do mapeamento espacial foi possível identificar as regiões marcadas pelo comportamento geoquímico do cobre e do zinco assim como encontrar relações entre o filão mineralizado e rochas ácidas aflorantes na região.
Palavras-chave: Mina dos Mociços, Cobre, Análise de componentes principais, Aglomeração
hierárquica, k-média
Abstract: The Mociços mine was exploited for copper in the early twentieth century. A recent soil
geochemistry campaign with portable X-ray fluorescence equipment permited to map the surroundings of this ancient mine with high resolution. The analysis of the results using machine learning methods, namely, principal component analysis, hierarchical and k-mean clustering, and the mapping of the observations, allows a better understanding of the geochemical behavior of the elements.
The principal component analysis and the k-means method have comparable results and allow to define the zone of mineralization and the outcropping of a dyke of acid rocks. The hierarchical agglomeration method allows to group the mineralized zones with the mine waste sites. Using the spatial mapping of the clusters it was possible to identify the regions marked by the geochemical behaviour of copper and zinc as well as to find relationships between the mineralized vein and outcropping acid rocks in the region.
1. Introduction
Mociços mine operated between 1919 and 1934 and exploited the oxidized zone of a quartz-carbonate vein mineralized with copper carbonates and sulphides with minor amounts of galena and sphalerite. Previous work (Vicente et al. 2018) allowed to understand the element behaviour around the Mociços mine and to highlight
the usefulness of portable X-ray
fluorescence (p-XRF) equipment in
geochemical exploration campaigns. This study applies unsupervised machine
learning techniques to deepen the
knowledge of the behaviour of the elements and to better understand their spatial
distribution. These methods include
dimension reduction using principal
components analysis (PCA) and clustering approaches, namely, the hierarchical clustering (hclust) and k-means methods.
2. Data preparation
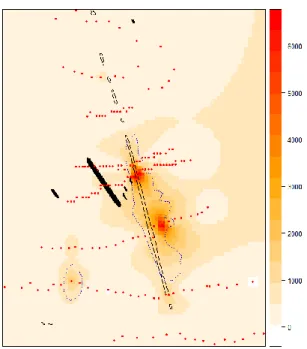
To characterize the distribution of the elements in the vicinity of the main lode, eight profiles approximately perpendicular to the vein strike (N10W) were carried out, with a total of 177 soil analysis by p-XRF (Fig. 1).
Fig. 1 – Analysis mesh (red dots) around the Mociços main vein. Background colours represent
the copper distribution around the quartz veins (open) and acidic dyke-like rocks (dark). Dotted line
represents mine waste. Values in ppm.
The p-XRF analysis detected a total of
fifteen elements: Ti, Mn, Fe2O3, Cd, Sb, V,
Cr, Co, Ni, Cu, Zn, As, Se, Pb and Hg. This
extended amount of data (177×15
observations) could not be used in its totality due to the constrains imposed by the methods applied, namely the detection limits of the P-XRF.
Hg was excluded from the analysis due to the high number of values bellow detection limit. Strongly correlated variables tend to bias the results in multivariate analysis, hence, correlation matrixes were calculated and the variables that present a correlation higher than 0.85 were excluded.
The final list of elements used in this research is: Mn, Ni, Cu, Zn, As, Se and Pb. The methods of data clustering are dependent on the absolute values of the data, that is, values with similar magnitude tend to group together. To avoid this problem all the values were scaled to conform with a mean of zero and a standard deviation of one.
All the calculations and maps were produced using the software R.
3. Principal components analysis
PCA is a common tool for dimension reduction of data, providing insights on the behaviour of the different variables and observations (e.g. Chen et al. 2015). For the study area more than 80% of the variability in the data can be explain by the first three PCAs (Tab. 1).
Tab. 1 – Variability and elements assigned to the first three components (PC1, PC2 and PC3).
Component Variability (%) Elements
PC1 50.5 Cu, As, Mn, Ni, Pb
PC2 16.2 Zn, Se
PC3 14.1 Se
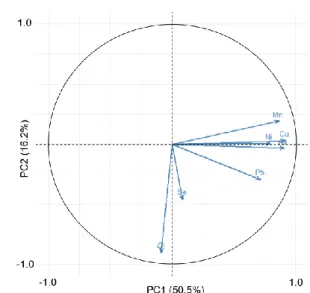
The elements responsible for the first component (Cu, As, Mn, Ni and Pb) all plot in the positive part of the PC1 axis whereas the elements that compose the second component (Zn and Se) plot in the negative part of this component (cf. Fig. 2).
253
Fig. 2 – Plot of the two first components.
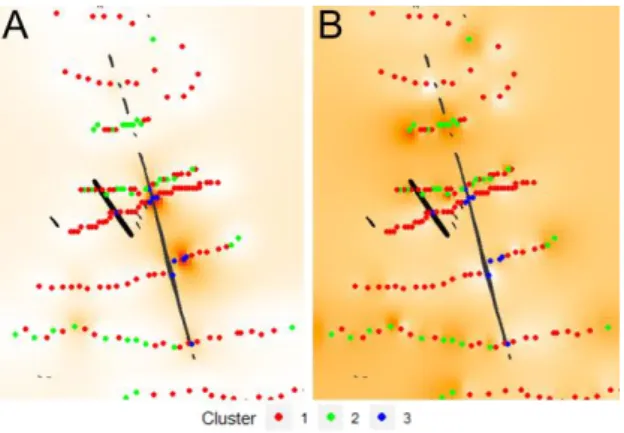
The spatial distribution of the different components is especially useful for the PC1 component that maps with good precision not only the quartz vein but also the acidic rocks in its vicinity (Fig. 3A). PC2 maps essentially the distribution of Zn in the vicinity of the mine (Fig. 3B).
Fig. 3- (A) PC1 with cooper values in background; (B) PC2 with Zn values in background. Red dots represent negative values and blue dots positive
values.
The maps display the relation between PC1 positive values (blue dots in Fig. 3A) and the Cu higher concentrations. Also, it can be highlighted the good correlation between PC2 negative values (red dots in Fig. 3B) and Zn high concentrations. The use of PCA maping allowed the correct identification of the anomalous copper values, related with the lode and point to the possibility that the mineralization is related with this acidic rock as they belong to the same group. The zinc distribution in soils demonstrates a higher mobility than
the copper, being the observations related with this element far from the vein.
4. Hierarchical mapping
Hierarchical clustering (hclust) is an unsupervised learning method to classify the data. This method uses distances between clusters to define the belonging of each observation to a cluster. The “Canberra” method to calculate the distance, was used, combined with the “ward.d2” agglomeration to separate the groups (Murtagh and Legendre 2014). The application of a three clusters approach allowed the clustering in table 2.
Tab. 2 – Hclust for three clusters.
Cluster Elements
1 Cu, Mn, As
2 Pb, Ni
3 Zn, Se
The maping of each observation to a specific cluster defines diferent different zones of influence for each one (Fig. 4).
Fig. 4- (A) Cu values in background; (B) Zn values in background. Red dots represent cluster 1 (Cu), green dots cluster 2 (Pb) and blue dots the cluster 3
(Zn).
With the three clusters it is possible to identify the points that are related with cluster 1 (copper dominated), identifying the vein, the main zone of mine waste (immediately to the east of the main vein), a mine waste site southeast of the vein and again the relation of the acidic rocks with this cluster. The cluster 2 related with Pb is always present in the vicinity of the copper samples whereas the zinc related cluster is further away from the veins.
254
5. K-means clustering
For this study an alternative method of unsupervised learning was tested.
K-means finds the centroids of
multidimensional data, assigning each observation to the nearest centroid (Hartigan and Wong, 1979). The number of
centroids is pre-determined and
corresponds to the number of clusters. The application of this method, for three clusters, divided the data in the groups presented in table 3.
Table 3 – K-means for three clusters.
Cluster Elements
1 Se
2 Zn
3 Mn, Ni, Cu, As, Pb
The mapping of the data (Fig. 5) provides an excellent agreement between the high copper grades and the cluster 3 (Fig. 5A); the cluster 2 is related with high zinc grades (Fig. 5B).
Fig. 5 – (A) Cu values in background; (B) Zn values in background. Red dots represent cluster 1 (Se), green dots cluster 2 (Zn) and blue dots the cluster 3
(Cu related).
The Se is often related with the presence of sulfur but this cluster is congregating the observations that are not related with none of the previous groups, that is all the observations that are not related with the copper or zin cluster.
6. Conclusions
All the methods applied can separate the observations that relate with copper and zinc, the most important metal elements present in these deposits. Consequently, any of these methods can be used to
identify anomalous zones in a geochemical campaign.
The results obtained with the k-means method are somewhat identical to the results obtained using PCA analysis,
admitting the identification of the
observations that are related with the copper anomaly and the behaviour of zinc in this type of environment.
Hierarchical clustering allowed the
identification not only of the copper anomaly but of other zones that are anomalous in copper and were not readily identified in the interpolation of the different elements.
The relation between the acidic rocks and the veins stands in all the analysis providing insights to the possible relation between these intrusions and the mineralization. Acknowledgments
This work is a contribution to the project ZOM3D: ALT20-03-0145-FEDER-000028, funded by Alentejo 2020 through the FEDER/FSE/FEEI. The authors also acknowledge the funding provided to Institute of
Earth Sciences through the contracts
UID/GEO/04683/2013 with FCT and COMPETE POCI-01-0145-FEDER-007690.
References
Chen, S., Grunsky, E.C., Hattori, K., and Liu, Y.,
2015. Principal Component Analysis of
Geochemical Data from the REE-rich Maw Zone, Athabasca Basin, Canada; Geological Survey of
Canada, Ope n File 7689, 24p.
doi:10.4095/295615.
Hartigan, J. A. and Wong, M. A. (1979). Algorithm AS 136: A K-means clustering algorithm. Applied Statistics, 28, 100–108. doi: 10.2307/2346830. Murtagh, F. and Legendre, P. (2014). Ward's
hierarchical agglomerative clustering method: which algorithms implement Ward's criterion? Journal of Classification, 31, 274–295. doi: 10.1007/s00357-014-9161-z.
Vicente, S., Maia, M., Moreira, N., Matos, J. X., Nogueira, P. (2017). Aplicação de FRX portátil na prospeção. Caso de estudo na Mina de Mociços, Portugal. Livro de Atas de XIV Congresso de Geoquímica dos Países de Língua Portuguesa e XIX Semana de Geoquímica.