DCA as a possible therapy for cutaneous
melanoma in combination with approved
therapeutics
DCA como uma possível terapia para o tratamento do melanoma
cutâneo em combinação com outros fármacos aprovados
Cristina Castro Sampaio Porto, 2016
Dissertação de candidatura ao grau de Mestre em Medicina e Oncologia Molecular, apresentada à Faculdade de Medicina da Universidade do Porto
Supervisor:
Helena Pópulo, PhD
Post Doc fellow at Institute of Pathology and Immunology of the University of Porto/ Institute of Research and Innovation in Health of the University of Porto (IPATIMUP/i3S)
E-mail: [email protected]
Co-supervisor:
Paula Soares, MSc, PhD
Assistant professor at Medicine Faculty of University of Porto
Group leader of Cancer Signaling and Metabolism group at Institute of Pathology and Immunology of the University of Porto/ Institute of Research and Innovation in Health of the University of Porto (IPATIMUP/i3S)
Senior Investigator at IPATIMUP/i3S E-mail: [email protected]
“The road to success is always under construction”
Lily Tomlin
Agradeço ao I3S/IPATIMUP, instituição que me acolheu para a realização deste mestrado, e particularmente ao Professor Manuel Sobrinho Simões, por me terem facultado todas as condições necessárias para o seu desenvolvimento. Agradeço à Faculdade de Medicina do Porto por me ter aceitado como aluna de mestrado, e particularmente ao Professor Henrique de Almeida, diretor do programa de Mestrado em Medicina e Oncologia Molecular, pela prontidão e disponibilidade demonstrados.
Agradeço às minhas orientadoras, Doutora Helena Pópulo e Professora Paula Soares. À Helena agradeço por tudo e mais alguma coisa, pelos ensinamentos, apoio, orientação, ajuda e amizade. À Professora Paula Soares, agradeço a oportunidade que me deu e todo apoio e orientação ao longo deste trabalho. Agradeço a todos os membros do grupo Cancer Signalling and Metabolism, por toda a ajuda prestada na realização deste trabalho. Agradeço em especial á Helena, á Joana, á Ana, ao Rui, ao Pedro, ao João e á Sofia, não só pela ajuda no laboratório, mas também pelos inúmeros lanches e momentos de diversão. Agradeço ao “Gangue do almoço” pelos memoráveis almoços, que me forneceram energia e motivação extra, ao longo da realização deste trabalho. Agradeço aos meus pais todo apoio, carinho e confiança que sempre depositaram em mim, e o esforço inigualável que fizeram para que a realização deste mestrado fosse possível. Ao meu irmão Filipe e á minha cunhada Susana, por aquelas palavras e aquele abraço no momento certo. Ao meu afilhado Rodrigo
coração da madrinha de amor.
Agradeço às minhas amigas, Inês e Catarina, por todo o apoio demonstrado, pela amizade e pelo carinho. Mesmo estando uma em cada canto do Mundo estiveram sempre presentes e prontas a dizer “Força, tu consegues!”.
Agradeço a todos os meus amigos pelo apoio, compreensão e dedicação. Em especial aos meus colegas de part-time, Luís e Paulino, pelo contributo paralelo, de diversão e, “extra doce” que deram a esta tese. E à Sofia, por desesperar comigo e ao mesmo tempo acalmar-me e dar-me força.
Um especial agradecimento ao Joel, pelo amor, carinho e paciência, por estar sempre ao meu lado, incondicionalmente.
Cutaneous melanoma arises from the malignant transformation of melanocytes. Is the least common of the three main types of skin cancer (<5%), but is a very aggressive malignancy, being responsible for the majority of skin cancer-related deaths. Nowadays, available therapies still have limitations due to rapidly acquirement of resistance and adverse secondary effects, resulting in high mortality. As cutaneous melanoma cells evidence the presence of the Warburg effect and deregulation of MAPK and PI3K/AKT/mTOR pathways, we hypothesize that the metabolic modulator DCA, in combination with MAPK or mTOR inhibitors, can be a promising new therapy for melanoma patients. The present work describes the major effects observed on cell viability, cell proliferation, cell cycle, apoptosis, and downregulation of MAPK and mTOR pathways, after treatment with DCA, with a BRAFV600 inhibitor (vemurafenib) and with an mTOR inhibitor (RAD001), either alone or in combination, in melanoma cell lines with different genetic background. DCA combined with vemurafenib appear to be the more efficient treatment, particularly in the BRAFV600 cell line. Also the MAPK and mTOR pathway inhibitors seem to have effects on cell dynamics that were highly potentiated when combined with DCA. Combination of vemurafenib and RAD001 also evidence promising effects, however, the activation of secondary survival pathways seems to occur. In the present study we obtained strong evidences that resistance to vemurafenib can be reversed through combination of BRAF inhibition with a metabolic modulator as DCA. Our work reinforces that the BRAF mutational status can be useful as a therapy predictive marker, in order to perform a personalized therapy that may improve the survival of patients with cutaneous melanoma.
O melanoma cutâneo desenvolve-se a partir da transformação maligna dos melanócitos. É o menos comum dos três principais tipos de cancro de pele (<5%), sendo, no entanto, o mais agressivo e responsável pela maioria das mortes relacionadas com o cancro da pele. Atualmente as terapias disponíveis apresentam limitações, como seja a rápida aquisição de resistência e efeitos secundários adversos, permanecendo a mortalidade elevada. O facto de as células de melanoma cutâneo evidenciarem a presença do efeito de Warburg e desregulação de vias de sinalização das MAPK e PI3K/AKT/mTOR, parece indicar que o modulador de metabolismo DCA, em combinação com inibidores destas vias, poderá ser uma terapia promissora para pacientes com melanoma. O presente trabalho descreve os principais efeitos observados sobre a viabilidade e a proliferação celular, ciclo celular, apoptose e bloqueio das vias das MAPK e mTOR, após tratamento com DCA, com o inibidor de BRAFV600 (vemurafenib) e com o inibidor de mTOR (RAD001), isoladamente ou em combinação, em linhas celulares de melanoma com diferente perfil genético. Os resultados obtidos parecem indicar que o DCA poderá ser um agente terapêutico eficiente no tratamento do melanoma cutâneo, quer isoladamente ou em combinação com os outros fármacos. O DCA em combinação com vemurafenib aparenta ser o tratamento mais eficiente, particularmente na linha celular com a mutação BRAFV600. Os inibidores das vias das MAPK e do mTOR também afetaram a dinâmica celular, sendo o efeito maior quando combinados com o DCA. A combinação do vemurafenib com o RAD001 também demonstrou efeitos promissores, no entanto, parece levar à ativação de vias de sobrevivência secundárias. Foram obtidas evidências de que a resistência ao vemurafenib
modulador do metabolismo, como seja o DCA. Este trabalho reforça o estado mutacional do BRAF como um possível marcador terapêutico, o que permitirá o desenvolvimento de uma terapia mais personalizada, que poderá conduzir a uma maior sobrevivência dos pacientes com melanoma cutâneo.
4E-BP1 Eukaryotic translation initiation factor 4E-binding protein 1 ACT Adoptative T-cell therapy
AJCC American Joint Committee on Cancer
AKT/PKB Protein kinase B
ALM Acral lentiginous melanoma
ATP Adenosine triphosphate
BCC Basal cell carcinoma
Bcl-2 B-cell lymphoma 2
BRAF v-RAF murine sarcoma viral oncogene homolog B
CDK Cyclin-dependent kinase
CDKN2A Cyclin-dependent kinase inhibitor 2A
CM Cutaneous melanoma
CRAF Cellular-RAF proto-oncogene serine/threonine-protein kinase
CTLA-4 Cytotoxic T-lymphocyte-associated protein 4
DCA Dichloroacetate
DMEM Dulbecco's modified eagle medium
ECL Enhanced chemiluminescent reagent
EDTA Ethylenediaminetetraacetic acid EGFR Epidermal growth factor receptor
eIF4E Eukaryotic translation initiation factor 4E ERK Extracellular regulated MAP kinase
FBS Fetal bovine serum
FDA Food and drug administration FKBP12 12 kDa FK506-binding protein
GTPase Guanosine triphosphatase
HER-2 Human epidermal growth factor receptor 2
HGF Hepatocyte growth factor
HIF-1 Hypoxia-inducible factor 1
IC50 Half maximal inhibitory concentration
IGF1R Insulin growth factor 1 receptor IRS-1 Insulin receptor substrate 1
KIT v-kit Hardy-Zuckerman 4 feline sarcoma viral oncogene homolog
LOH Loss of heterozygosity
MAPK Mitogen-activated protein kinase MCR1 Melanocortin 1 receptor
MDM-2 Murine double minute 2
MEK Mitogen activated protein kinase kinase
mTOR Mammalian target of rapamycin mTORC1/2 mTOR complex 1/2
MYC Myelocytomatosis viral oncogene
NF-1 Neurofibromin 1
NM Nodular melanoma
NRAS Neuroblastoma RAS viral (v-ras) oncogene homolog
OIS Oncogene-induced senescence
p53 Tumor protein p53
PB Presto blue assay
PBS Phosphate buffered saline
PD-1 Programmed death receptor-1
PDH Pyruvate dehydrogenase enzyme PDK Phosphoinositide-dependent kinase
PDP Pyruvate dehydrogenase phosphate
PI3K Phosphatidylinositol 3-kinase
PKC Protein kinase C
PTEN Phosphatase and tensin homologue deleted on chromosome ten RAD001 Everolimus; mTOR inhibitor
RAS Rat sarcoma virus oncogene
RGP Radial growth phase
RIPA Radioimmunoprecipitation assay buffer
RNA Ribonucleic acid
ROS Reactive oxygen species
RPMI Roswell Park Memorial Institute 1640 medium
RTK Receptor tyrosine kinase
S6 40S Ribosomal protein S6
S6K S6 kinase
SEGA Subependymal giant cell astrocytoma SSM Superficial spreading melanoma TCA Tricarboxylic acid cycle
TERT Telomerase reverse transcriptase
TNM Tumor Node Metastases
TSC 1/2 Tuberous sclerosis complex 1/2 UVR Ultraviolet radiation
VEGFR Vascular Endothelial Growth Factor Receptor
VGP Vertical growth phase
WHO World Health Organization
1 Introduction ... 1
1.1 Skin cancer ... 1
1.2 Melanoma ... 1
1.2.1 Epidemiology of cutaneous melanoma ... 2
1.2.2 Predisposition and risk factors for cutaneous melanoma ... 3
1.2.3 Clinical aspects of cutaneous melanoma ... 4
1.2.4 Genetic and molecular alterations in cutaneous melanoma ... 6
1.2.5 Cutaneous melanoma therapy ... 8
1.3 mTOR pathway activation in cutaneous melanoma ... 15
1.4 Metabolism modulation in cutaneous melanoma ... 19
2 Aims ... 23
3 Material and Methods ... 25
3.1 Cell lines and culture conditions ... 25
3.2 Treatment of melanoma cell lines with DCA, RAD001 and vemurafenib .... 25
3.3 Cell viability assay ... 26
3.4 Cell count assay ... 27
3.5 Cell cycle and apoptosis analysis ... 28
3.6 Western blot analysis and antibodies ... 28
3.7 Wound healing assay... 29
3.8 Motility assay ... 30
3.9 Statistical analysis ... 30
4 Results ... 31
4.1 Effects of DCA, RAD001 and vemurafenib treatment in melanoma cell lines viability ... 31
4.1.1 IC50 of vemurafenib in melanoma cell lines ... 31
4.1.4 Effects of combined therapies in ED013R2 cell line viability ... 35
4.2 Effects of DCA, RAD001 and vemurafenib treatment on proliferation of melanoma cell lines ... 37
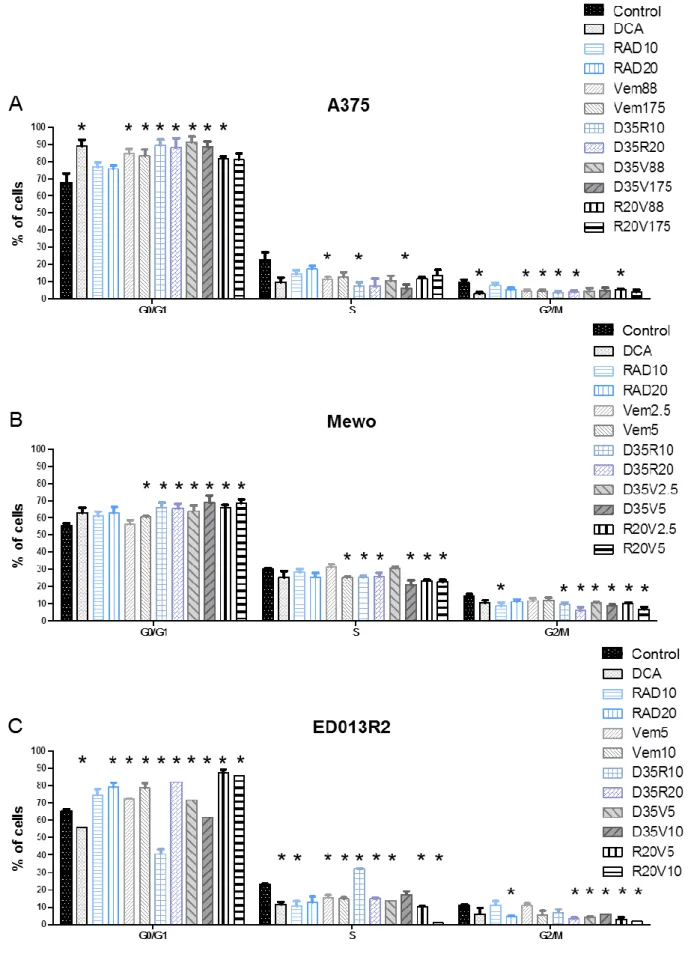
4.3 Effects of DCA, RAD001 and vemurafenib treatment in cell cycle of melanoma cell lines ... 41
4.4 Effects of DCA, RAD001 and vemurafenib treatment in apoptosis of melanoma cell lines ... 44
4.5 Effects of DCA, RAD001 and vemurafenib treatment in MAPK and mTOR pathways effectors, and in HIF1-α expression in melanoma cell lines ... 47
4.6 Effects of DCA, RAD001 and vemurafenib treatment in melanoma cell lines motility ... 52 5 Discussion ... 53 6 Conclusion ... 57 7 References ... 59 8 Appendices ... 71 8.1 Supplementary table 1 ... 71 8.2 Supplementary figure 1 ... 72
1
1 Introduction
1.1 Skin cancer
Skin is the largest organ of the human body, representing almost 20% of the body mass. Covering our entire body, skin provides the first protection barrier against external damage, such as pathogens and UV radiation. Excess of sunlight exposure in combination with other aggressive agents, can generate severe skin diseases particularly skin cancer [1]. According to the World Health Organization (WHO), there are three types of skin cancer that can be subdivided in two major groups: non-Melanoma skin cancers and Malignant Melanoma. Non-Melanoma skin cancers are rarely lethal and are surgical treated, comprising Basal Cell Carcinoma (BCC) and Squamous Cell Carcinoma (SCC) [1]. BCCs are the most common type and rarely metastasize, while SCCs, although less common and treatable in the majority of the cases, can cause patients death.
1.2 Melanoma
Melanoma is the least common of the three main types of skin cancer (<5%), but is responsible for more than 80% of all skin cancer-related deaths [1, 2]. Malignant melanoma may occur de novo, without a precursor lesion, or in 20-30% of the cases may develop from pre-existing melanocytic nevi, which are benign proliferations of melanocytes [3, 4]. Melanocytes are neural crest-derived cells that during development colonize mainly the skin, eye and less often other tissues throughout the body, as inner ear and leptomeninges [5, 6]. These pigment producing cells exist in a lower proportion comparing with the basic skin units, keratinocytes (1 to 35, respectively), and are responsible for the production and export of melanin, the light absorbing pigment [7-9]. Once produced, melanin is
2
delivered from melanocytes to keratinocytes that use it to protect their nucleus from UV radiation-induced DNA damage, reactive oxygen species, metal ions, drugs and organic chemicals [10, 11]. Arising from the malignant transformation of melanocytes, melanoma can occur in any tissue that contains melanocytes, being skin the most common site for melanoma development, followed by the eye. Melanoma can be divided in cutaneous or ocular according to the location of the trigger melanocyte [12]. Ocular melanoma is the most common primary eye tumor in adults, although only accounting for approximately 5% of all melanomas [13]. The majority appears in the uvea (>95%), being the conjunctival melanoma less frequent (<5%) [14]. Cutaneous melanoma is a very aggressive malignancy, and one of the most common cause of cancer death in young adults [15-17].
1.2.1 Epidemiology of cutaneous melanoma
The levels of melanoma incidence are variable worldwide (Fig. 1). Generally, increases with increasing proximity to the equator, where Caucasians are predominant, being exposure to ultraviolet radiation the most important environmental risk factor for cutaneous melanoma [18, 19].
Reporting an increase of incidence in the past decades, cutaneous melanoma became an “epidemic cancer”. Global incidence in 2012 was 232 000 comparing with 197 000 in 2008, with different geographical, gender and age distribution [20, 21]. Improved criteria for diagnosis allows clinicians to perform a better scrutiny with more pigmented lesions biopsied, a far more accurately recognition of melanomas and at earlier stages, thereby raising the number of diagnosed melanomas [20]. Mortality also raised in the last years with values near 46 000 in 2008 and almost 55 500 in 2012 [21].
3
Figure 1: Worldwide incidence of cutaneous melanoma in 2012 (rate/ 100,000 individuals, for both
sexes and all ages). The highest incidence occurs in Australia, followed by Europe, New Zealand and North America (www.globocan.iarc.fr).
1.2.2 Predisposition and risk factors for cutaneous melanoma
Beside environmental factors, such as UV radiation, others like individual features and genetic predisposition, play a role in determining melanoma risk [22]. Fair skin, red hair, blue eyes, freckles and multiple benign or dysplastic nevi are the individual features associated with increased risk [23-26]. Rarely, cutaneous melanoma appears in a familial context (8-12% of all melanomas) [27]. Mutations on CDKN2A and CDK4 genes are considered genetic predisposition events for familial melanoma development [28, 29]. Further prognostic factors for sporadic melanoma are based on patient age and gender, tumor location, level of invasion and tumor vascularity [30, 31]. Better prognosis fits with young age, female, thin localized disease, low mitotic rate and absence of ulceration [18].
4
1.2.3 Clinical aspects of cutaneous melanoma
Clinically, cutaneous melanoma is classified in four major subtypes based on anatomic localization, type of skin, sun-exposure and growth pattern (Table 1). Lentigo maligna melanoma is the least frequent subtype followed by acral lentiginous melanoma, nodular melanoma and superficial spreading melanoma, the most frequent subtype [23]. However, this classification has no prognostic value or diagnostic relevance [18, 31].
Table 1: Clinical classification of cutaneous melanoma [23].
Subtype Frequency Common
site Distinguishing features
Superficial spreading melanoma
(SSP) 70%
Trunk of men
Leg of woman RGP, 1-5 years Nodular melanoma (NM) 10-25% Trunk of men
Leg of woman RGP, 6-8 months Acral lentiginous melanoma (ALM) 5% Palms, soles,
nails
Not related to sun damage, all races affected, 30-70% in dark-skinned individuals Lentigo maligna melanoma (LMM) <1%
Head and neck of
elderly
Associated with chronic sun exposure
RGP, 3-15 years Legend: RGP,radial growth phase.
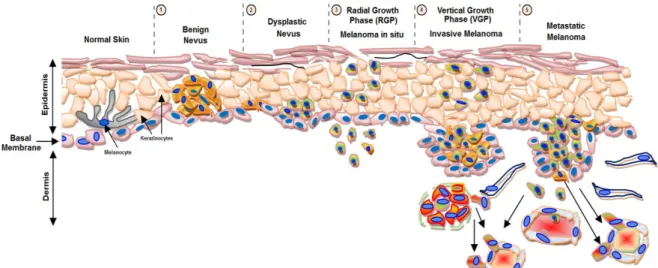
Melanoma progression was described in the 80’s, in a five steps model known as Clark’s model (Fig. 2) [32]. This model comprises: 1) benign proliferation of melanocytes along the basal layer of epidermis, called benign nevus or melanocytic nevus [33]; 2) dysplastic nevus, with a malignant potential, defined as a brownish patch harboring variable pigmentation, asymmetry and/or irregular or indistinct borders [26]; 3) melanoma in situ that is a non-tumorigenic lesion related to an early radial growth phase (RGP) of melanoma, with an abnormal proliferation of melanocytes that grow in an irregular and lateral pattern entirely within and limited to the epidermis [34]; 4) locally invasive melanoma that presents vertical
5
growth phase (VGP), which require the acquisition of additional genetic abnormalities, with the cells leaving the epithelium of the epidermis and entering in the subjacent mesenchymal tissue, such as the dermis or submucosa [34, 35]; 5) metastatic melanoma, which is characterized by the spread of malignant melanoma cells beyond the local site of the primary tumor, colonizing other tissues, such as lymph nodes [34, 36]. Along this melanoma progression model, the most critical event is the transition from RGP to VGP, which involves the escape from keratinocyte-mediated growth control [37]. Metastases appear latter and occur through the lymphatic system, to local lymph nodes. Distant metastases involving visceral sites, which occur through systemic dissemination, appear afterward, being the most common sites lung, liver, brain, bone, and small intestine. The presence of distant metastasis determines the prognosis of cutaneous melanoma [38, 39].
Melanoma has a relatively good prognosis when diagnosed early at a cutaneous localized stage, but patients with distant metastatic disease have a median survival of only 8-9 months and less than 10% of 10-year overall survival [35, 40, 41]. More than 95% of patients with three or more sites of metastatic disease die within one year [42]. Fortunately, most cases of cutaneous melanoma are diagnosed in an early stage, reaching 98% on 5-year survival rate [43]. Staging of cutaneous melanoma is based on the TNM (Tumor Node Metastases) staging system developed by the AJCC (American Joint Committee on Cancer) (Supplementary table 1, Appendices). Melanoma staging is based on prognostic factors such as tumor thickness (Breslow method), mitotic rate, ulceration, number of lymph nodes, tumor burden, LDH serum levels and anatomic site of distant metastases [35].
6
Figure 2: Melanoma progression model. There are five stages of histopathologic progression in
melanocyte transformation from normal skin to metastatic disease. 1) Benign nevus; 2) Dysplastic Nevus; 3) Melanoma in situ; 4) Invasive Melanoma and 5) Metastatic Melanoma. Adapted from http://www.biochim.ro/ib/projects/melanoma-trp2/background.php.
1.2.4 Genetic and molecular alterations in cutaneous melanoma
Clinic, epidemiology and more recently genetics, reveal that melanomas are heterogeneous tumors, harboring various genetic alterations, developing at different body sites, on sun and non sun-exposed skin, suggesting that melanoma arises from divergent causal pathways [40]. Deregulation of MAPK and PI3K/AKT/mTOR pathways is linked to melanoma development through the modulation of cell growth, proliferation and apoptosis [44]. The mitogen-activated protein kinase/extracellular-signal-regulated kinase pathway (MAPK) is the most frequently and constitutively activated pathway in melanoma [45]. The canonical MAPK pathway (RAS–RAF–MEK1/2–ERK1/2) is the best characterized and the aberrant activation commonly occurs through gain-of-function mutations in genes encoding RAS and RAF family members [46, 47]. BRAFV600 and NRASQ61 mutations are the most frequently identified mutations in cutaneous melanoma,
7
50% and 25%, respectively, indicating an important role for MAPK pathway activation in melanoma development [48-52]. BRAFV600 -induced MAPK signaling has been associated with most aspects of human melanoma development and progression in the last decades. Several studies show their involvement in many tumorigenic processes leading to an increase in cell proliferation, survival, hypoxia, invasion, metastization and angiogenesis [53-59]. However, benign melanocytic nevi cells frequently express oncogenic BRAFV600, remaining in growth-arrest for decades because of oncogene-induced senescence (OIS) [60]. Bypass senescence is required for malignant transformation since it provides an efficient suppression of cell proliferation and tumorigenesis. One mechanism to bypass senescence is through the activation of the PI3K/AKT/mTOR pathway. Events like PTEN loss or AKT overexpression, which occur in melanoma and drive to PI3K/AKT/mTOR pathway overactivation [61, 62], can overcome this senescence and lead to melanoma progression [63]. Studies showed that higher mTOR pathway activation was found in cutaneous melanoma and related with MAPK pathway BRAF -activation [64]. The presence of both BRAF mutations and activation of PI3K/AKT/mTOR pathway simultaneously is associated with cutaneous melanoma aggressiveness, worse prognosis and short patient's overall and progression-free survival [64].
The major driving force behind the initiation and progression of melanoma development may be the acquisition of somatic mutations in key regulatory genes [65]. The most frequently altered genes in melanoma are BRAF, NRAS (from MAPK pathway), AKT, PTEN (from PI3K/AKT/mTOR pathway) KIT, TERT and p53 (Table 2) [66, 67]. Other genes as CDKN2A, CDK4, MC1R, MDM-2, ERK,
E-8
cadherin and N-cadherin were reported as being altered during melanoma progression [67].
Table 2: Most frequently altered genes in sporadic cutaneous melanoma.
Genes Frequency Type
Oncogenes
BRAF 40 - 70% Mutation
NRAS 10 - 20% Mutation
c-KIT 30 - 40% Mutation or amplification
AKT 60% Amplification or mutation (OE)
TERT 12 - 71% Mutation
Tumor Suppressor Genes
p53 10% Loss or mutation
PTEN 30 - 50% Deletion, LOH or mutation
Legend: OE, Overexpression; LOH, Loss of heterozygosity
1.2.5 Cutaneous melanoma therapy
If detected at an early stage and treated properly, melanoma has a high rate of curability. Standard cutaneous melanoma treatment for localized disease consists of primary tumor surgical excision followed by adjuvant therapy, such as radiotherapy, to avoid recurrence. Until recently, melanomas with deep local invasion, or lymph nodes involvement, could only be treated with surgery, immunotherapy (interleukin-2 and interferon α-2b), chemotherapy, and/or radiotherapy [68]. Most patients suffering from metastatic disease carries a poor prognosis, with less than 1 year of median survival, and mortality reaching 90% in overall 5-year rate [69]. Over the past decades, efforts were hampered to overcame melanoma resistance to therapy and improve overall survival of
9
melanoma patients. Resistance to apoptosis both in vivo and in vitro appears to be the major cause of chemotherapy drug resistance in melanoma [70].
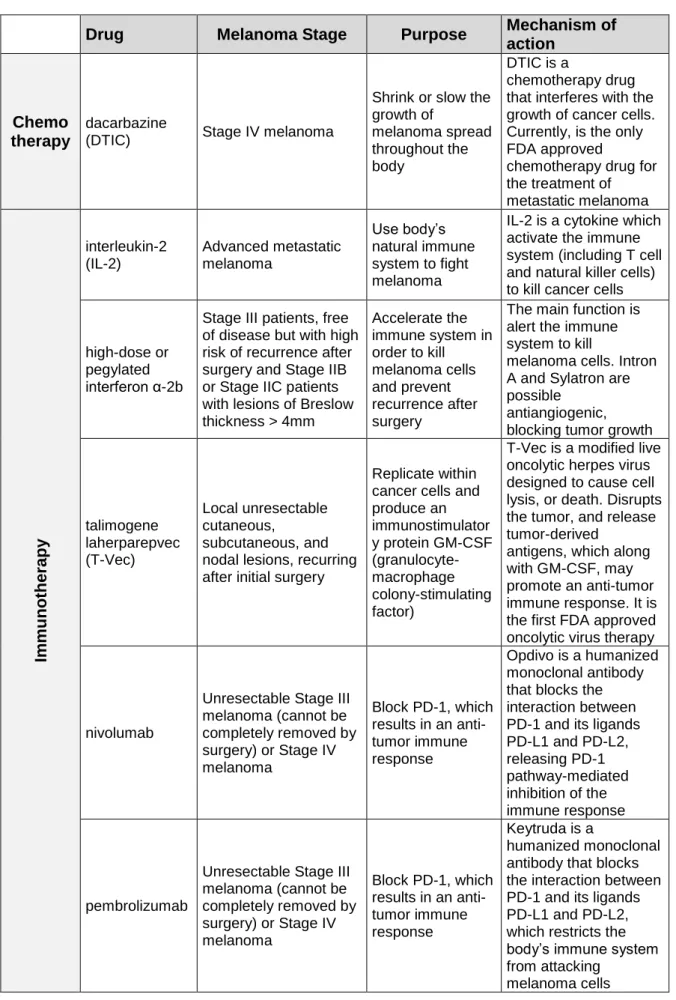
Understanding melanoma genetics, pathogenesis, tumor heterogeneity and the complexity of underlying biologic pathways allowed the development of target treatment, leading to more durable responses [71-73]. The gene mutations referred above are generally exclusive, therefore melanoma can be molecularly classified into distinct subtypes, where these alterations can emerge as targets and predictive factors for therapy response [39]. Several novel therapeutic strategies, such as immuno- and targeted therapies, were approved by FDA (Food and Drug Administration) for melanoma treatment (Table 3) [74, 75].
Dacarbazine is the only currently chemotherapeutic agent approved by FDA for metastatic melanoma treatment, and is associated with modest response rates and low effects in overall survival of patients, when administered alone [76, 77].
10
Table 3: FDA approved therapies for advanced/metastatic melanoma treatment.
Drug Melanoma Stage Purpose
Mechanism of action
Chemo therapy
dacarbazine
(DTIC) Stage IV melanoma
Shrink or slow the growth of melanoma spread throughout the body DTIC is a chemotherapy drug that interferes with the growth of cancer cells. Currently, is the only FDA approved
chemotherapy drug for the treatment of metastatic melanoma Im muno the rapy interleukin-2 (IL-2) Advanced metastatic melanoma Use body’s natural immune system to fight melanoma
IL-2 is a cytokine which activate the immune system (including T cell and natural killer cells) to kill cancer cells
high-dose or pegylated interferon α-2b
Stage III patients, free of disease but with high risk of recurrence after surgery and Stage IIB or Stage IIC patients with lesions of Breslow thickness > 4mm Accelerate the immune system in order to kill melanoma cells and prevent recurrence after surgery
The main function is alert the immune system to kill
melanoma cells. Intron A and Sylatron are possible
antiangiogenic, blocking tumor growth
talimogene laherparepvec (T-Vec) Local unresectable cutaneous, subcutaneous, and nodal lesions, recurring after initial surgery
Replicate within cancer cells and produce an immunostimulator y protein GM-CSF (granulocyte-macrophage colony-stimulating factor)
T-Vec is a modified live oncolytic herpes virus designed to cause cell lysis, or death. Disrupts the tumor, and release tumor-derived
antigens, which along with GM-CSF, may promote an anti-tumor immune response. It is the first FDA approved oncolytic virus therapy
nivolumab
Unresectable Stage III melanoma (cannot be completely removed by surgery) or Stage IV melanoma Block PD-1, which results in an anti-tumor immune response Opdivo is a humanized monoclonal antibody that blocks the interaction between PD-1 and its ligands PD-L1 and PD-L2, releasing PD-1 pathway-mediated inhibition of the immune response pembrolizumab
Unresectable Stage III melanoma (cannot be completely removed by surgery) or Stage IV melanoma Block PD-1, which results in an anti-tumor immune response Keytruda is a humanized monoclonal antibody that blocks the interaction between PD-1 and its ligands PD-L1 and PD-L2, which restricts the body’s immune system from attacking
11 ipilimumab Stage III or Stage IV
melanoma
Blocks the activity of CTLA-4. Restore and sustain an active immune system by supporting the activation and proliferation of T-cells Yervoy is a human monoclonal antibody designed to block the activity of CTLA-4, a protein that normally helps to keep the immune system cells, called T cells, in check. When CTLA-4 is blocked, T cells are active and proliferate in order to attack the melanoma cells.
nivolumab and ipilimumab combination
Unresectable Stage III melanoma (cannot be completely removed by surgery) or Stage IV melanoma Block PD-1 and CTLA-4, respectively
Opdivo and Yervoy are both monoclonal antibodies and immune checkpoint inhibitors. Enhance T cell functions greater than the effects of either antibody alone Ta rgeted The rapy trametinib Patients with BRAFV600 mutation and unresectable Stage III melanoma or Stage IV
Block MAPK pathway and inhibit the growth of melanoma tumors
Mekinist is a MEK inhibitor that blocks the activity of MEK 1 and 2 particulary in metastatic melanoma carrying the BRAF V600 mutation
dabrafenib
Patients with
BRAFV600 mutation and unresectable Stage III melanoma or Stage IV
Block MAPK pathway and inhibit the growth of melanoma tumors
Tafinlar is a kinase inhibitor that blocks the activity of the V600 mutated form of BRAF
vemurafenib
Patients with
BRAFV600 mutation and unresectable Stage III melanoma or Stage IV
Block MAPK pathway and inhibit the growth of melanoma tumors
Zelboraf is a kinase inhibitor that blocks the activity of the V600 mutated form of BRAF
cobimetinib and vemurafenib combination
Patients with
BRAFV600 mutation and unresectable Stage III melanoma or Stage IV
Block MAPK pathway and inhibit the growth of melanoma tumors
Zelboraf is a kinase inhibitor that blocks the activity of the V600 mutated form of BRAF and Cotellic is an inhibitor that blocks the activity of MEK trametinib and dabrafenib combination Patients with BRAFV600 mutation and unresectable Stage III melanoma or Stage IV
Block MAPK pathway and inhibit the growth of melanoma metastases
Tafinlar and Mekinist are inhibitors of the mutated forms of BRAF and MEK, respectively
12
Since 2002, when Davies et al. reported for the first time a high frequency of BRAF point mutations in melanoma and other human cancers, many publications establish these BRAF mutations as drivers of oncogenesis and as direct targets for therapeutic intervention [78]. Based on BRAF oncogenes, a series of small-molecule inhibitors have been developed, which target BRAFV600. Following the failure of sorafenib, the first RAF-inhibitor actively studied in patients with melanoma, more potent and selective inhibitors of BRAF have been developed, namely vemurafenib and dabrafenib [79-81]. Vemurafenib and dabrafenib are small molecules highly potent and selective ATP-competitive BRAF inhibitors. These drugs act by binding to the active site in the kinase domain, in its active conformation, blocking the access to ATP. They lead to decreased proliferation and increased programmed cell death, through reduction of phosphorylated ERK and cyclin D1 [82]. Deactivating BRAFV600 mutant proteins improved progression free-survival and overall survival of patients with unresectable stage III or stage IV melanoma [83-86]. Because of the potential efficacy towards melanoma, in 2011 and 2013, vemurafenib (PLX4032) and dabrafenib (GSK2118436), respectively, received US Food and Drug Administration (FDA) approval for the treatment of patients with unresectable Stage III melanoma or Stage IV melanoma who carry the BRAFV600 mutation [86, 87]. Vemurafenib is a potent inhibitor of the kinase domain of mutant BRAF that Phase III trials of vemurafenib, targeting mutated BRAF, demonstrated effectiveness in metastatic melanoma treatment with significantly high response/tumor burden reduction (85%), increase in overall survival rate (84%), reduction in risk of death from disease (63%) and a median progression-free survival between 6 and 9 months [81, 84, 85]. Nonetheless, treatment with BRAF inhibitors is associated with diverse side effects as nausea,
13
fatigue, rash, arthralgia, alopecia, and photosensitivity reaction [88]. Also other adverse illnesses can appear, such as hyperkeratosis, verrucous keratosis, papillary lesions, keratoacanthomas and/or squamous cell carcinoma [89-91]. The MAPK-pathway is part of a complex network containing scaffold proteins and feedback loops. Therefore, another obstacle for the use of BRAF inhibitors in metastatic melanoma treatment is the rapidly acquisition of secondary resistance, typically in 5–7 months. Several MAPK-dependent and -independent resistance mechanisms that allow cells to bypass BRAF inhibition, by re-activating MAPK pathway and/or activating other signaling pathways, have been described [92]. NRAS oncogenic mutations, upregulation of CRAF proteins, activating mutations of MEK1/2, amplification of MAP3K8, or loss of the RAS suppressor NF1, are some of the resistance mechanisms that can activate MAPK pathway, by re-establishing MEK activity and hence reactivation of ERK [93-99]. Increased expression of eIF4F complex, EGF receptor and pro-survival factors as anti-apoptotic Bcl-2 proteins may also lead to the reactivation of MAPK pathway [100-102]. Overexpression of the mutant BRAF protein itself confers resistance to BRAF inhibitors and also, alternative splicing of BRAFV600 leads to the formation of BRAF truncations, through RAF dimerization that activates MEK, resulting in acquired resistance to selective BRAF inhibitors [103, 104]. Apart from cell-autonomous resistance, the tumor-stroma can also confer resistance to BRAF inhibitors. Stromal fibroblasts can secrete HGF that re-activate ERK through cMET/RAS/CRAF- signaling [105]. MAP kinase pathway-independent mechanisms of resistance involve alterations of the activation in receptors of tyrosine kinases (RTKs), such as overexpression or over-activation of PDGFR-β (platelet-derived growth factor receptor beta) and IGF1R (insulin growth factor 1-
14
receptor), which leads to the induction of oncogenes, by upregulation of the PI3K/AKT/mTOR signaling pathway. Also, acquired loss of tumor suppressor PTEN and amplification or point mutations on AKT, contribute for PI3K pathway activation, another potential driver of resistance [94, 106-108].
Other small molecule used in target therapy is trametinib, a MEK1/2 inhibitor that blocks MAPK pathway in order to stop the growth of melanoma tumors, showing improved progression free-survival over dacarbazine [109]. Combined therapies with these promising drugs as trametinib + dabrafenib and cobimetinib + vemurafenib were FDA-approved in 2014 and 2015, respectively [74, 110]. As response rates increased with these therapies, it becomes evident that combination therapies, targeting several signaling pathways simultaneously, might be an efficient therapeutic strategy to treat melanoma patients. Other signal transduction drugs as PI3K, AKT and mTOR inhibitors are being evaluated in combination with BRAF and MEK inhibitors [111].
Another available therapy to treat melanoma is to detect and destroy tumor cells, by stimulating the immune system of the patients. High-dose interferon α-2b or pegylated interferon α-2b are cytokines used as immunotherapies that improve recurrence-free survival but not overall survival [112, 113]. Interleukin-2 is also an immunotherapeutic agent used in stage IV metastatic melanoma patients that showed disease-free and overall survival increase, but lower effectiveness [114]. As interferon and interleukin treatment trigged severe side effects in patients, monoclonal antibodies targeting immune checkpoint proteins have been approved recently. Ipilimumab, an anti-CTLA4 antibody, was the first revealing improvement in progression-free and overall survival in patients with unresectable advanced melanoma [115, 116]. Other promising monoclonal antibodies include those
15
against programmed death receptor-1 (PD-1), pembrolizumab and nivolumab, better tolerate and efficient when compared with ipilimumab [117-119]. The combination of CTLA-4 and PD-1 antibodies (ipilimumab + nivolumab) showed significant increase in progression-free survival, in comparison to these as single agent [120, 121]. Other immunotherapeutic strategies for advanced melanoma are being investigated, such as adoptative T-cell therapy (ACT) and melanoma vaccines, based on dendritic cells and training to recognize melanoma-specific antigens [122, 123]. Nowadays, available therapies still have limitations in the treatment of melanoma patients and mortality remains high [109, 124].
1.3 mTOR pathway activation in cutaneous melanoma
mTOR (mammalian target of rapamycin), a downstream effector of the frequently deregulated pathway in melanoma PI3K/AKT/mTOR pathway, is a conserved serine/threonine kinase that regulates survival, growth, proliferation, metabolism and motility, in response to growth factors, energy, nutrient and O2 levels
[125-127]. mTOR forms two functionally distinct multiprotein complexes, mTORC1 and mTORC2 [128]. mTOR complexes differ in their sensitivity to rapamycin (mTOR inhibitor); mTORC1 is sensitive to rapamycin, whereas mTORC2 is considered resistant [129, 130]. mTORC1 is a major regulator of protein synthesis and ribosome biogenesis; is activated by the PI3K/AKT pathway, mostly through phosphorylated AKT (on Thr308), that unleashes the signaling cascade, blocking the formation of the TSC1/TSC2 inhibitor complex [131-133]. It is also involved in the regulation of other important proteins such as HIF1-α [134]. Two most well-known downstream effectors of mTORC1 are S6K and 4EBP1; its phosphorylation status is commonly used to access the mTOR complex 1 activity [135]. The
16
serine/threonine kinase p70S6K1 (S6K1) is activated by phosphorylation at Thr389 by mTORC1; once activated, S6K1 phosphorylates S6 (40S ribosomal protein S6) enhancing the translation of mRNAs from ribosomal proteins, elongation factors, and insulin growth factor [136, 137]. The other well-characterized mTORC1 target 4EBP1, when unphosphorylated, forms a complex with the eukaryotic translation initiation factor 4E (eIF4E), binding and inactivating its functions [138]. Phosphorylation by mTORC1 at multiple serine/threonine sites of 4EBP1, allows its dissociation from eIF4E, relieving the inhibitory effect on eIF4E-dependent translation initiation. Once free and active, eIF4E enables the translation of cap-dependent proteins and mRNAs of its downstream target genes required for G1-to-S phase transition such as c-myc, ornithine decarboxylase and cyclin D1 [137, 139, 140]. mTORC2 is resistant to rapamycin; however long-term treatment with this agent is capable to disassemble mTORC2 complex, by sequestering newly synthetized mTOR molecules, blocking its functions [141]. Growth factors are the major activators of mTORC2. Once activated, this complex phosphorylates PKC-α, AKT (on Ser473) and the focal adhesion-associated protein, paxillin. mTORC2 also interferes with small GTPases, such as Rac and Rho, trough regulation of their activity on cell survival, migration and actin cytoskeleton [130, 141, 142]. Given the key role of mTOR in cell growth and metabolism, and its involvement in cancer trough oncogene stimulation or loss of tumor suppressors that enables cell growth, angiogenesis and metastasis, it become a desirable therapeutic target [143]. Anti-cancer therapies targeting mTOR, namely the fungal macrolide rapamycin (naturally mTOR inhibitor) and its analogues (rapalogues) were developed. mTOR inhibitors (mTORi) can be divided in two groups: rapamycin and rapalogues, and the small molecules that are mTOR
17
kinase inhibitors. Rapamycin, an allosteric inhibitor of mTOR, was isolated from the bacterium Streptomyces hygroscopicus, which was found in a soil sample from Easter Island [144, 145]. First fungicide and subsequently potent immunosuppressive and anti-tumor properties were assigned to rapamycin effect [146, 147]. Rapamycin (rapamune, sirolimus) was the first mTOR inhibitor approved by FDA in 1999, as an immunosuppressant drug for prophylaxis of organ rejection in kidney transplant recipients [148, 149]. In recent years, interest has focused on its potential as an anticancer drug. Several studies, performed in cell lines derived from different tumors, reveal that rapamycin promotes direct anti-tumor effects, such as cell growth arrest [134]. Accumulation of cells in G1-phase, after rapamycin treatment, is consistent with the fact that the drug inhibits ribosome biogenesis and global translation, in part by blocking S6K1 and 4EBP1 phosphorylation [131, 134]. Moreover, rapamycin can also inhibit endothelial cell proliferation, HIF1 and VEGF expression, angiogenesis, and vascular permeability [150, 151]. Pharmacological molecules derived from rapamycin (rapalogues), with better water solubility profiles and efficacy, have been developed, such as temsirolimus, everolimus and deforolimus [152]. These rapamycin analogues are cell-type specific mTORC1 and partial mTORC2 inhibitors, and act forming a complex with the intracellular receptor FKBP12 that bind to mTOR and inhibit the downstream signaling [153]. Rapamycin and rapalogues are already been used for the treatment of various dermatologic conditions and rapalogues are in clinical trials for cancer treatment [154, 155]. Moreover, previous studies showed that they may achieve a high response rate of treatment and have an antiproliferative activity on several types of cancer [156, 157]. However, the performance of rapamycin and its analogues has been undistinguished and, despite isolated
18
successes, the antiproliferative effect was variable among cancer types. It is well known that rapamycin and its rapalogues mediate their effects by inhibiting mTORC1, with limited or no effect on mTORC2 activity, being this the major limitation of mTOR inhibitors [152]. Therefore, a new generation of small molecule inhibitors was developed. These molecules are ATP-competitive inhibitors that directly target the mTOR catalytic site. As they inhibit mTORC1 activity, consequently block the phosphorylation of S6K1, and as they inhibit mTORC2, they block AKT phosphorylation. Higher effects on blocking cell proliferation and protein translation are assigned to these selective inhibitors, when compared with rapamycin and analogues [158, 159]. One rapalogue, everolimus, also known as RAD001, was approved by FDA as immunosuppressant for solid-organ transplantation and allograft rejection [160]. Everolimus blocks the cytokine-driven activation responses of T- and B-cells, preventing their proliferation and differentiation. It was already approved as treatment for advanced renal cell carcinoma, tuberous sclerosis SEGA tumors, pancreatic neuroendocrine tumors, tuberous sclerosis angiomyolipoma and, advanced breast cancer [161]. Phase II studies in Hodgkin and non-Hodgkin’s lymphoma also reveal a good response rate (47% and 30%, respectively) with everolimus treatment [162, 163]. Reported effects of everolimus in some human tumors and cancer cell lines include inhibition of cell proliferation, migration, invasion and angiogenesis, as well as promotion of apoptosis [164]. Despite everolimus antiproliferative effect in cancer cell lines and animal models, the specific inhibition of mTORC1 with this agent might induce upstream receptor tyrosine kinase signaling and AKT upregulation, leading to the attenuation of its therapeutic effects [165]. Recognition that rapamycin and rapalogues have limited substrate-specific efficacy and activate
19
several negative oncogenic feedback loops, has fueled the development of new strategies to address these limitations. Dual PI3K-mTOR inhibitors are being developed to target both mTOR function and other PI3K signaling activated molecules, in order to improve the anti-tumor activity [166-168]. Although not yet used in melanoma treatment, higher sensitivity to everolimus was described in cutaneous melanoma cell lines harboring BRAFV600 mutation [169]. Also, a recent phase II study reported that treatment of metastatic melanoma with a combination of bevacizumab (angiogenesis/VEGF inhibitor) and everolimus, was well tolerated and moderately efficacious [170]. Nevertheless, for most tumor types, mTOR inhibitors have been more associated with disease stabilization rather than tumor regression. Therefore, several studies combining mTOR inhibitors with other therapies, as conventional chemotherapy agents, EGFR or HER-2 inhibitors, hormonal therapy, HIF1-α and VEGF inhibitors, and MAPK pathway inhibitors were performed, showing a more cytotoxic response and higher tumor regression [67, 134]. In melanoma, clinical trials with mTOR inhibitors alone yield high toxicity for patients and minor response rates [171]. Rapamycin has shown effectiveness on increasing apoptosis and chemosensitivity, and the anti-tumor effect seems to be enhanced when combined with inhibitors of MAPK and PI3K pathways [172-175].
1.4 Metabolism modulation in cutaneous melanoma
As other cancer cells, melanoma cells exhibit the Warburg effect, a shift from oxidative phosphorylation to glycolysis, which increase glucose consumption and lactate production, comparing to normal melanocytes [176]. The metabolic rewiring observed in cancer cells plays a role on driving development and progression,
20
promoting survival, proliferation, and long-term maintenance [177, 178]. Contrary to normal cells, cancer cells can reprogram their metabolism and energy production. They limit their metabolism to glycolysis, even in the presence of oxygen, leading to a process called ‘aerobic glycolysis’ also known as Warburg effect [179, 180]. Aerobic glycolysis is an inefficient way to obtain ATP compared with mitochondrial respiration; however, the rate of glucose metabolism through aerobic glycolysis is higher than the complete oxidation of glucose in the mitochondria [181, 182]. Therefore, increased glucose consumption is used as a carbon source for anabolic processes to generate nucleotides, lipids, and proteins, essential for cells to proliferate [183-185]. Many tumors with high rate of cell proliferation have a hypoxic environment with low-oxygen availability, mainly because the formation of new blood vessels does not supply enough oxygen. The metabolic adaptation to hypoxia involves induction of metabolic genes that increase glycolytic flux and is achieved through hypoxia-inducible factor (HIF1-α). HIF1-α seems to be constitutive activated in some tumors, where it induces glycolysis and inhibits mitochondrial biogenesis [186]. As skin is a moderate hypoxic environment, cutaneous melanoma present overexpression of HIF1-α, perhaps due to indirect stimulation of expression by reactive oxygen species (ROS), derived from melanin production [187, 188]. UVA-irradiation, partially through ROS, leads to enhancement of the Warburg effect in melanoma cells and increase the invasive potential [189]. Furthermore, the Warburg effect enables cancer cells to avoid excess ROS generation from mitochondrial respiration, by limiting the pyruvate flux into mitochondrial oxidative metabolism, and thus gain increased resistance to cell death and survival advantage for metastization [190]. Understanding tumor metabolism reprogramming, reversibility of the Warburg
21
effect, and knowledge of mitochondrial oxidative metabolism as an important suppressor of metastasis, allows the opening of a therapeutic window to generate new anti-tumor drugs that target altered metabolism in cancer cells and may prevent tumor metastization [191, 192]. Dichloroacetate (DCA) is an old drug, already used in humans for more than 30 years, in the treatment of some congenital mitochondrial diseases that present deficiencies of PDH or other mitochondrial enzymes, like severe lactic acidosis [193]. It is a small-molecule pyruvate mimetic compound included in a new class of “metabolic modulators” that target and switch cancer cells metabolism toward a more normal phenotype [194-196]. Pro-apoptotic and anti-proliferative effects were assigned to DCA in a large variety of cancers, such as prostate, colon, gastric and endometrial cancer, glioblastoma, neuroblastoma, T-cell lymphoma, non-Hodgkin’s lymphoma, fibrosarcoma, and metastatic breast cancer [197, 198]. In cutaneous melanoma, DCA seems to be a possible therapeutic candidate showing a rewiring of metabolism, downregulation of proliferation, increase apoptosis and decrease activation of the mTOR pathway [199]. DCA acts by inhibiting pyruvate dehydrogenase kinase (PDK). Contrary to healthy tissues, where PDK activity is low, in cancer cells there is a high level of PDK activity, mostly due to the activation by HIF1-α, that is overexpressed [200]. PDK is one of the elements that compose the mitochondrial pyruvate dehydrogenase complex (PDC), along with pyruvate dehydrogenase enzyme (PDH) and pyruvate dehydrogenase phosphate (PDP). Once upregulated, PDK phosphorylates and inhibits PDH, at E1-α subunit, leading to an increase glycolytic phenotype over glucose oxidation [201]. DCA blocks PDK activity, allowing PDH dephosphorylation and activation (Fig. 3). Thereby, a higher amount of pyruvate enters in the mitochondria and is catalyzed
22
by oxidative decarboxylation into acetyl-CoA and then used in tricarboxylic acid cycle (TCA) [201].
Figure 3: Schematic representation of dichloroacetate (DCA) interactions with pyruvate
dehydrogenase kinase (PDK) and HIF1-α. DCA inhibits PDK that can be upregulated by HIF1-α, which in turn can be activated by mTOR and BRAF. Adapted from Populo et al. [199].
Thus, DCA promotes the conversion of the glycolytic phenotype into an oxidative phenotype [194]. DCA also inhibits HIF1-α, which is involved in the enhancement of the glycolytic phenotype and is overexpressed in melanoma [187, 202, 203]. Studies performed in non-small-cell lung, glioblastoma and breast cancer cells reported that DCA also promotes glucose oxidation, depolarization of mitochondrial membranes, induces apoptosis, decreases cell growth, and increases ROS production [204]. Therefore, DCA is a promising drug for cancer therapy, particularly in melanoma, alone or in combination with already approved therapies.
23
2 Aims
Recently approved therapies for cutaneous melanoma targeting MAPK pathway have limitations, such as fast acquirement of resistance. Therefore, the development of new and efficient therapies to treat and improve survival of melanoma patients is necessary. Cutaneous melanoma cells display overactivation of the two interconnected MAPK and PI3K/AKT/mTOR pathways and evidence the presence of the Warburg effect. MAPK inhibitors improve overall and progression free-disease survival of melanoma patients. PI3K, specifically mTOR inhibitors, already prove to have anti-tumor properties. DCA that targets metabolism and promotes apoptosis, may reverse the metabolic switch and promote tumor regression.
The major goal of this study was to determine if DCA, in combination with mTOR inhibitors or BRAF inhibitors, is a suitable drug to use as therapy for melanoma patients. We hypothesize that reverting melanoma cell metabolism (from glycolysis to oxidative phosphorylation), may have therapeutic benefits in combination with already approved therapies. To test this hypothesis we analyzed the sensitivity of melanoma cell lines to combined therapy of DCA with everolimus (mTOR inhibitor) and with vemurafenib (BRAF inhibitor), and checked if this combination could be addictive or synergistic and also checked if DCA could overcome resistance to the treatment with vemurafenib of melanoma cells. Moreover, as mTOR and MAPK (BRAF –activated) pathways are interconnected in cutaneous melanoma, another goal for this study was to determine if the combined therapy of mTOR and BRAF inhibitors may have an additive and improved effect on melanoma therapy.
25
3 Material and Methods
3.1 Cell lines and culture conditions
Three different melanoma cell lines were used in this study: A375 (BRAFV600E), Mewo (BRAF-wildtype) and ED013R2 (BRAFV600E; vemurafenib resistant). A375 cell line was provided by Dr. Madalena Pinto, from CEQUIMED, Faculty of Pharmacy, University of Porto, Portugal. Mewo cell line was provided by Dr. Marc Mareel, from the Department of Radiotherapy and Nuclear Medicine, Ghent University Hospital, Belgium. Vemurafenib-resistant cell line (ED-013R2) was provided by Prof. Per Guldberg, from the Danish Cancer Society Research Center, Copenhagen, Denmark. This last cell line was generated from a parental BRAFV600E cell line (ED-013) by exposing the cells to increasing concentrations of vemurafenib and were considered resistant when they could be continuously propagated at a concentration of vemurafenib above the IC50 [205]. A375 was
maintained in RPMI medium (Gibco/BRL – Invitrogen) and Mewo in DMEM medium (Gibco/BRL – Invitrogen), both supplemented with 10% of fetal bovine serum, 100U/mL Penicillin and 100ug/mL Streptomycin. The ED013R2 vemurafenib-resistant line was maintained in RPMI medium (Gibco/BRL – Invitrogen), supplemented as previous described mediums, plus 1µM of vemurafenib. Cell lines were maintained at 37°C, in a humidified atmosphere (5% CO2) and cultured as a monolayer.
3.2 Treatment of melanoma cell lines with DCA, RAD001 and vemurafenib
DCA (Sodium dichloroacetate, Sigma-Aldrich, St. Louis, MO, EUA) was dissolved in dH2O and filtered. RAD001 (everolimus, Novartis Pharma AG, Basel,
26
Deutschland) were dissolved in DMSO. All treatments were added to the culture medium and used for 48 and 72h treatment. Melanoma cells incubated with culture medium and culture medium supplemented with dH2O and DMSO served
as control.
3.3 Cell viability assay
The effect of DCA, RAD001 and vemurafenib in melanoma cell lines viability was analyzed by Presto Blue (PB) assay. Cells were seeded in 96-well plates at a density of 7x10³ (A375), 9x10³ (Mewo) and 10x103 (ED013R2) in 200μl medium. After 24h, the medium was replaced by a medium containing different treatment concentrations and combinations. For DCA, the concentration of 35mM previously established was used [199]. For vemurafenib alone, concentrations of 10, 50, 100, 1000, 2500, 5000nM were used in A375 and Mewo cell lines and, 1, 2.5, 4, 5, 6, 7.5, 10µM to ED013R2 resistant cell line. For DCA plus RAD001, the concentrations of 35mM of DCA and 5, 10, 15 and 20nM of RAD001 were used as already reported or as recommended by the manufacture [169, 199]. For DCA plus vemurafenib, 35mM of DCA was used and variable concentrations of vemurafenib were used according with the cell line (44, 88, 132, 175nM for A375, 1.25, 2.5, 3.75, 5µM for Mewo and 1, 2.5, 4, 5, 6, 7.5, 10µM for ED013R2). For RAD001 plus vemurafenib, 20nM of RAD001 was used as recommended by the manufacture, and vemurafenib concentrations were variable, depending on the cell line, as described above. Cells were incubated for 48 and 72h, washed with PBS (pH 7.4) and assayed for cell growth using PB according to the manufacturer’s instructions. During incubation with the cells, PB reagent is modified by the reducing environment of the viable cells and becomes highly fluorescent. Fluorescence was
27
measured using a microplate reader (Synergy HT Multi-Mode Microplate Reader, BioTek Instruments Inc., Winooski, VT, USA) at excitation and emission wavelengths of 560 and 590nm, respectively. The absorbance of the wells containing culture medium was used as control, as well as medium with drug solvents (dH2O and different DMSO concentrations) and each experimental
condition was evaluated with triplicates and repeated three times. By comparing the measured fluorescence/absorbance of the wells containing treated cells with the measurements of the wells containing untreated cells, it was possible to generate dose response profiles and determine the IC50 (the concentration that
inhibits cell survival in 50%) values for vemurafenib, using GraphPadPrism5.0 (GraphPad Software, Inc., La Jolla, CA).
3.4 Cell count assay
Cells were plated in 6-well plates at a final density of 1.5×10⁵ cells/well for A375 and ED013R2 cell lines, and 2×10⁵ cells/well for Mewo cell line; and incubated at 37°C for 24h. Cells were then treated with 35mM DCA, 10nM and 20nM RAD001, vemurafenib (88 and 175nM to A375; 2.5 and 5µM to Mewo; 5 and 10µM to ED013R2) and drug combinations of DCA + RAD001, DCA + vemurafenib, RAD001 + vemurafenib with the concentrations described above. Following 72 hours of treatment, cells were collected, diluted 1:200, and the absolute cell count was performed using a Z2 Coulter particle counter (Beckman Coulter, Brea, CA). Each experimental condition was evaluated in triplicate and repeated three times.
28
3.5 Cell cycle and apoptosis analysis
For cell cycle profile and apoptosis analysis, melanoma cells were plated in 6-well plates at a final density of 1.5×10⁵ cells/well for A375 and ED013R2 cell lines, and 2×10⁵ cells/well for Mewo cell line; and incubated at 37°C for 24h. Cells were then treated with 35mM DCA, 10nM and 20nM RAD001, vemurafenib (88 and 175nM to A375; 2.5 and 5µM to Mewo; 5 and 10µM to ED013R2) and drug combinations of DCA + RAD001, DCA + vemurafenib, RAD001 + vemurafenib with concentrations described above for 72h of treatment. For cell cycle analysis, cells were harvested and fixed overnight in ice-cold 70% ethanol. Afterwards, cells were resuspended in PBS with 0.1mg/mL RNase A and 5μg/mL propidium iodide, before analysis. For apoptosis measurements, cells were harvested and the levels of apoptosis were analyzed by flow cytometry using the Annexin-V FITC Apoptosis Kit (Clontech Laboratories, Inc., Saint-Germain-en-Laye, France) according to the manufacturer’s instructions. Flow cytometry analysis of cellular DNA content and phosphatidylserine externalization were performed with a flow cytometer (BD Accuri C6), plotting at least 20000 events per sample. The data was analyzed using the FlowJo 7.6.5 software (Tree Star, Inc., Ashland, USA). Each experiment was evaluated in triplicate and repeated three times.
3.6 Western blot analysis and antibodies
Cells were lysed for 15min at 4ºC using RIPA buffer (1% NP-40 in 150mM NaCl, 50mM Tris (pH 7.5), 2mM EDTA) supplemented with protease (Roche Applied Science, Penzberg, Germany) and phosphatase inhibitors (Sigma-Aldrich). Proteins were quantified using a modified Bradford assay (Bio-Rad). Protein samples (50µg) were denatured for 5min at 95ºC, separated in 10% SDS/PAGE
29
gels and then electrotransferred onto a nitrocellulose membrane (GE Healthcare, Piscataway, USA) for 2h at 100V on ice. Membranes were blocked for 1h at room temperature in phosphate buffered saline (PBS) containing 0.5% Tween-20 and 5% low-fat dry milk or 4% bovine serum albumin (depending on the dilution of the primary antibodies). In order to access the effects of DCA, RAD001 and vemurafenib treatment on downstream effectors, the following primary antibodies were used: PDH, phospho-PDH Ser293 (1:2000, Abcam); S6, phospho-S6 Ser235/236, ERK 1/2, phospho-ERK1/2 Thr202/Tyr204, AKT (pan), phospho-AKT Ser473, mTOR, phospho-mTOR Ser2448, HIF1-alpha, (all 1:1000; Cell Signaling Technology), and BRAF (1:500; Santa Cruz Biotechnology), incubated overnight at 4ºC. Secondary antibodies were conjugated with peroxidase (Santa Cruz Biotechnology); protein bands were detected by chemiluminescense (ECL detection solution) and visualized by X-ray film exposure (GE Healthcare). Membranes were re-stained with a goat polyclonal anti-actin (1:2000; Santa Cruz Biotechnology) antibody for loading protein control. All experiments and quantifications (using Bio-Rad Quantity One 1-D Analysis software (4.6.6 version)) were performed in triplicate.
3.7 Wound healing assay
Migration of the cells was assessed through their ability to close an artificially created gap (wound) in the cell growth area. Cells (A375 and Mewo) were seeded in high density (depending on cell line) to reach confluence and predicting motility in 6-well plates with 2ml appropriate media per well and grown for 24h. Then, the media was replaced and the treatment conditions referred above were added. Cells were incubated for more 24h. In the third day the medium was removed, a
30
10-μl pipette tip was used to create a ‘scratch’ in the growth area and the same medium was reloaded. Cells were placed under a Leica DMI 2000 time-lapse microscope (Leica Microsystems, Wetzlar, Germany) and images were recorded since 48h until 72h post treatment. Migration was defined as the capacity of the cells to migrate into the wound and measured as the percentage of wound coverage through time. Images were automatically collected in each field every 10min using LAS AF software (Leica Microsystems) and further processed using Fiji software.
3.8 Motility assay
For motility assays, cells (A375 and Mewo) were plated in low density (depending on the cell line) in a 1µ-slide 4-wellph+ ibiTreat (ibidi GmbH, Martinsried, Germany). After seeding for 24h, the medium was replaced and the treatment conditions were added. After another 24h, cells were monitored until 72h post treatment, using a Leica DMI 2000 time-lapse microscope (Leica Microsystems, Wetzlar, Germany). The movement covered by a single cell was quantified only if the cell was individualized, remained in the field and did not enter in division or apoptosis. Images were collected similarly to wound healing assay.
3.9 Statistical analysis
Statistical analyses were performed using STAT VIEW-J 5.0 (SAS Institute, Inc., Cary, NC). The data from the cell lines experiments was analyzed by the two-tailed unpaired Student’s t-test. A p value ≤0.05 was considered statistically significant.
31
4 Results
4.1 Effects of DCA, RAD001 and vemurafenib treatment in melanoma cell lines viability
A375, Mewo and ED013R2 melanoma cell lines were exposed to different concentrations of DCA, RAD001 and vemurafenib, alone and in combination, to establish the effect on cell viability. IC50 of DCA was previously determined as
35mM for A375 and Mewo cell lines [199]. For RAD001, 20nM were used as recommended by the manufacture.
4.1.1 IC50 of vemurafenib in melanoma cell lines
Increasing concentrations of vemurafenib were used to determine the IC50 in the
three cell lines after 48h and 72h of treatment (Fig. 4A). Vemurafenib reduced viability of A375 and Mewo cell lines in a dose-dependent manner after 48h and a higher decrease of the cell viability was observed after 72h treatment. A375 was the cell line more sensitive to vemurafenib. After 48h of treatment, a significant effect of vemurafenib on A375 cell viability was firstly observed after treatment with 10nM (86.1±9.3%; p=0.05) (Fig. 4B), in Mewo cell line with 100nM of vemurafenib (80.0±13.2%; p=0.04) (Fig. 4C) and in ED013R2 cell line, a similar effect was achieved after treatment with 1000nM (68.0±3.5%; p<0.01) (Fig. 4D). The IC50
values were estimated as 173±3.3nM for A375 (Fig. 4B) and 4990±8.3nM for Mewo cell line (Fig. 4C), after 48h of vemurafenib treatment. The IC50 was not
32
Figure 4: A) Graphic representation of the percentage of viable cells of A375, Mewo and ED013R2
melanoma cell lines treated with various concentrations of vemurafenib for 48 and 72h, determined by Presto Blue assay. The black line marks the IC50 values obtained that were estimated as
33
173±3.3nM for A375 and 4990±8.3nM for Mewo, after 48h of vemurafenib treatment. In ED013R2 cell line, growth inhibition was observed after 48h of vemurafenib treatment, although it did not reach an IC50 value. B, C and D) Column graphic representation of the percentage of viable cells of
A375 (B), Mewo (C) and ED013R2 (D) melanoma cell lines treated with various concentrations of vemurafenib for 48 and 72h. The data are presented as mean±SD. * refers to significant (p≤0.05) difference when comparing cells treated with vemurafenib for 48 and 72h to non-treated cells.
4.1.2 Effects of combined therapies in A375 cell line viability
After 48h of treatment, A375 cell line showed to be sensitive to 35mM DCA treatment, with significantly lower percentage of viable cells compared with the control (28.5±4.5%; p<0.01) (Fig. 5A). Treatment with 5, 10, 15 and 20nM of RAD001 alone achieved a significant decrease on cell viability compared with the control (85.3±3.5%; p<0.01, 78.1±10.5%; p=0.02, 68.5±18.1%; p=0.03 and, 73.0±11.0%; p<0.01, respectively), after 48h of treatment. Although the decrease of viability after RAD001 treatment was dose-dependent, it did not reach significance between the different concentrations of the drug. Generally, combined therapies seem to increase significantly the sensitivity of A375 cell line, showing a decrease on cell viability compared with single therapies. Combined therapy of DCA 35mM and increasing concentrations of RAD001 (5, 10, 15 and 20nM) progressively decrease cell viability compared with the control (26.1±5.1, 21.5±5.3%, 19.5±2.4% and 18.2±0.4%, respectively; p<0.01) (Fig. 5A). Comparing with treatment with RAD001 5, 10, 15 and 20nM alone, these combinations with DCA 35mM reached significantly lower cell viability (p<0.01).
The same trend was observed in cells treated with combined therapy of DCA 35mM and vemurafenib 44, 88, 132 and 175nM compared with the control (33.9±7.3, 27.5±7.1%, 24.7±10.5% and 21.3±3.9%, respectively; p<0.01), and also compared with the treatment with vemurafenib alone (p<0.01), after 48h of

![Table 1: Clinical classification of cutaneous melanoma [23].](https://thumb-eu.123doks.com/thumbv2/123dok_br/15582866.1049488/24.892.101.772.466.717/table-clinical-classification-of-cutaneous-melanoma.webp)