27004
Preliminary Results of an ERT in a Vineyard in
Estremoz, Portugal
A.M. Correia* (Evora University) & J. Passos (R&P Business, Lda.)
SUMMARY
In 2014 a geophysical survey was carried out in a vineyard in Quinta do Mouro, in the wine region of Estremoz, in southern Portugal, to understand and study the geoelectrical characteristics of the soil. The main objective of the geophysical work was to delineate and characterize the soil and bedrock in geoelectrical terms in the vineyard’s area. The area has patches where high quality grapes are produced and patches which produce mediocre grapes. The geophysical survey aimed to try to understand if there was any correlation between the electrical resistivity of the ground (related with the amount of moisture in the ground) and the quality of the vines and grapes. The results indicate that, in this case, the quality of the vines and grapes appear to be related with the moisture in the ground, the good vines and grapes being associated with higher moisture content of the ground and so lower electrical resistivities.
Introduction
In order to understand and study the soil in a vineyard in the Quinta do Mouro, in the wine region of Estremoz, in southern Portugal, a geophysical survey was carried out in 2014. The objective of the geophysical work was to delineate and characterize the soil and bedrock in geoelectrical terms in the vineyard’s area; the motivation for the geophysical study was the fact that the quality of the grapes varies in the area; as a matter of fact, in the vineyard, there are patches where high quality grapes are produced and patches which produce mediocre grapes.
First six vertical electrical soundings (VES) were performed in February 14, 2014 (see Fig.1). In September 2, 2014, an electrical resistivity tomography was done along the direction defined by the six VESs (Profile 1 in Fig. 1); finally, that same profile was repeated in December 22, 2014, and a new one (Profile 2) was done 11 m southest of Profile 1. Only the work concerning Profile 1 will be presented here.
Figure 1 Location of the six vertical electrical soundings (VES1 – VES6) along Profile 1 which was
also the orientation of the first electrical resistivity tomography. Profile 2 indicates the location of the second electrical resistivity tomography which will not be discussed in this abstract.
Method
Direct current geoelectrical methods were chosen to study the vineyard; as a matter of fact, georadar was also considered to study the ground in the vineyard; however, it could not be used because of the wiring supporting the vines. The six vertical electrical soundings (VES) were done along the lines of the vines, were spaced by ten meters and done perpendicular to the direction of Profile 1; the maximum distance between the current electrodes was 40 m. Interpretation of the sounding curves was done considering a 1D ground. In a second phase, electrical resistivity tomographies (ERT) were done; first along Profile 1 (in February 14, 2014) and, at a later time (in December 22, 2014), along Profile 2 and repeated along Profile 1 (Fig. 1). For each ERT 40 electrodes were used in a Wenner configuration; adjacent electrodes were 2 m apart. The software RES2DINV (Loke and Barker, 1995,
1996) was used for inverting the apparent electrical resistivity values into two-dimensional models of electrical resistivity of the ground (Fig. 3). The models are a representation of the distribution of the electrical resistivity of the ground to depths of about 11 m along profiles 78 m long.
Results
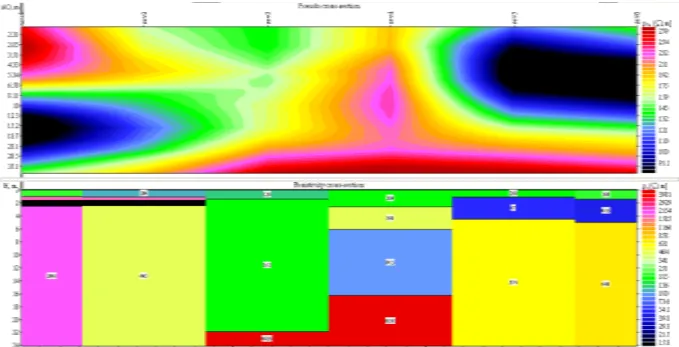
The interpretation of the VES indicates that the soil and bedrock in the vineyard’s area present several blocks of different electrical resistivities which vary from a few Ω.m, at the surface, to hundreds of Ω.m at depths of about 3 to 22 m (Fig. 2).
Figure 2 Pseudo section generated from the six vertical electrical soundings (top) and geoelectrical
block structure generated with the results of the interpretation of the six vertical electrical soundings (bottom).
To refine the geoelectrical structure along the set of the six VES, and to verify whether there would be any change in time resulting from increase or decrease of moisture in the ground, two ERTs were done within a time span of about three months. Fig 3 shows the two electrical resistivity tomographies done on February 14, 2014 and on December 22, 2014.
Generally speaking both electrical tomographies are very similar and show that, at the surface, the southwest portion presents lower electrical resistivities than the northest portion. At the same time, between 30 and 36 m, almost outcropping, there is a higher electrical resistivity block. Beneath the high electrical resistivity area in the NE side of the electrical resistivity tomographies there is a low electrical resistivity zone which has electrical resistivity values similar to the ones at the surface on the SW zone.
It is interesting to note that vines show a different vitality NE and SW of the distance of 26 m from the origin of Profile 1; as a matter of fact, NE of that distance vines present a poorer shape and vitality, and the grapes are usually of poorer quality that to the SW.
So, the high electrical resistivity zone between 30 and 36 m in Profile 1 is presumably creating some kind of barrier that influences the quality and vitality of the vines. It appears that SW of that zone the ground presents a higher content of moisture than in the NE zone.
To try to decipher the geological situation of the ground, another electrical resistivity tomography was done in the middle region of Profile 1 using an electrode spacing of 1 m instead of 2 m used in the first electrical resistivity tomographies. The new electrical resistivity tomography, which is shorter
that the first ones, is shown in Fig. 4; it has higher horizontal and vertical resolution than the first electrical resistivity tomographies.
Figure 3 Electrical resistivity tomographies done along Profile 1 of Fig. 1 in September and
December 2014.
Figure 4 Electrical resistivity tomography done in the middle portion of Profile 1 of Fig.1 and Fig. 3.
In comparison with the profiles in Fig. 3, this electrical resistivity profile is shorter (39 m long) but has higher horizontal and vertical resolution.
Conclusions
The interpretation of the ERTs described above indicates a coincidence between the area where poor grapes are produced and high values of near surface ground electrical resistivities (100 - 500 Ω.m); on the other hand, the area where high quality grapes are produced appear to be coincident with low values of near surface ground electrical resistivities (20 - 100 Ω.m).
These are preliminary results and indicate the great potential for using these methodologies in characterizing and managing soil productivity; other geophysical work and soil analysis are planned for the near future. Fig. 5 is a cartoon showing the location of the short electrical resistivity tomography in the longer one. It also shows the limit that separates the good from the poor vines.
Figure 5 Location of the short ERT (bottom) in the long ERT (top). Also shown is the limit that
separates good from poor vines.
Acknowledgements
Dr. Miguel Passos, owner of the vineyard, is thanked for allowing to perform the geoelectrical experiments in his farm.
References
Loke, M.H. and Barker, R.D. [1995] Least-squares deconvolution of apparent resistivity. Geophysics,
60, 1682-1690.
Loke, M.H. and Barker, R.D. [1996] Rapid least-squares inversion of apparent resistivity pseudosections using a quasi-Newton method. Geophysical Prospecting, 44, 131-152.