Catarina Filipa Braz Rijo
Licenciada em Ciências de Micro e Nanotecnologias
A paper-based low-cost label-free biosensing
silver core-gold shell nanostructure for SERS to
be applied to breast cancer diagnostics
Dissertação para obtenção do Grau de Mestre em Engenharia de Micro e Nanotecnologias
Orientador: Elvira Maria Correia Fortunato, Professora catedrática,
FCT-UNL
Co-orientador: Bruno Costa-Silva, Investigador, Fundação
Champalimaud
Júri: Presidente: Arguente(s): Vogal(ais): Março 2018
ii
A paper-based low-cost label-free biosensing silver core-gold shell nanostructure for SERS to be applied to breast cancer diagnostics
Copyright © Catarina Filipa Braz Rijo, Faculdade de Ciências e Tecnologia, Universidade Nova de Lisboa.
A Faculdade de Ciências e Tecnologia e a Universidade Nova de Lisboa têm o direito, perpétuo e sem limites geográficos, de arquivar e publicar esta dissertação através de exemplares impressos reproduzidos em papel ou de forma digital, ou por qualquer outro meio conhecido ou que venha a ser inventado, e de a divulgar através de repositórios científicos e de admitir a sua cópia e distribuição com objetivos educacionais ou de investigação, não comerciais, desde que seja dado crédito ao autor e editor.
iii
“One of the greatest discoveries a man makes, one of his great surprises, is to find he can do what he was afraid he couldn’t do.”
iv
Acknowledgement
Antes de mais gostaria de agradecer à Faculdade de Ciências e Tecnologias da Universidade Nova de Lisboa que foi a minha casa em todos estes anos necessários para a conclusão do curso. Um agradecimento especial também ao Departamento de Ciências dos Materiais e a todos os excelentes professores que nestes anos me ensinaram, não só coisas técnicas, mas também várias vezes no aconselharam para sermos pessoas melhores na nossa vida.
Um especial obrigado ao professor Rodrigo Martins que tornou possível a minha formação neste curso, assim como o melhoramento do mesmo. Também à professora Elvira Fortunato por toda a sua disponibilidade para ajudar e orientação durante o período de realização da tese e ao longo de todo o curso. Também queria agradecer ao Dr. Bruno Costa-Silva pela oportunidade de trabalhar juntamente com a sua equipa na Fundação Champalimaud e ao Cristian Bodo pela sua paciência e disponibilidade no esclarecimento de dúvidas e vontade de ajudar.
Ao CENIMAT e toda a sua equipa, desde a professores a funcionários da secretaria. À Sónia Pereira e à Alexandra Gonçalves por ajudarem sempre que precisava de reagentes e caixas de Petri, pelas conversas de ocasião e por todas a chamadas de atenção que me fizeram que só contribuíram para me tornar uma pessoa melhor e mais atenta. À Carolina Marques que também esteve sempre disponível para ajudar e orientar nas tarefas e solucionadora de todos os problemas que tinha no Raman… À Professora Joana Pinho pelos resultados de DRX que não marquei mas a professora fez na mesma (ahah) Ao Jonas Deuermier por ser uma pessoa sempre disponível para ajudar e mais importante que tudo, sempre preocupado que a sua explicação em qualquer assunto fosse bem entendida! Também quero agradecer à Daniela Gomes, por muitas vezes, às 8h da manhã, estar a tentar tirar imagens de fibras de papel com nanopartículas com o SEM semi-estragado e as fibras desintegrarem (literalmente). Também à Raquel Água que foi muito importante no início do meu trabalho transmitindo-me conhecimentos essenciais tanto individualmente, como em reuniões, que me ajudaram a organizar as minhas tarefas. A todos os meus colegas que partilharam o laboratório comigo e sobreviveram às obras, obrigado!! Especialmente agradeço à minha querida amiga Catarina Costa que desde o dia 1 desta jornada se manteve como uma fiel amiga e companheira e que sempre esteve lá para mim.
A todos os amigos (que se tornaram família) que tive o prazer de conhecer. Ao meu grande amigo Marco Rodrigues, que mesmo desaparecido na maior parte do tempo, cada conversa com ele parecia que era como se tivéssemos sempre juntos. Ao Xavi, ao Centeno, ao Nano, ao Casa Branca e ao Narciso por fazerem parte de um grupo de amigos de Faculdade sempre prontos para beber aquela jola às cinco da tarde, por serem todos diferentes à sua maneira e por serem verdadeiros amigos!! À minha querida amiga Lauríssima, a amiga que demorei a conhecer mas desde que conheci nunca mais larguei, que se tornou a minha companheira de todas as horas e tenho a certeza que será uma amizade que levarei para a vida toda até termos filhos e os nossos filhos terem filhos. Orgulho-me em dizer que principalmente levo bons amigos de toda esta experiência, mas também gostava de salientar todas as pessoas que de alguma forma contribuíram para o meu trajeto, mesmo que já não nos falemos, porque sem eles não seria a pessoa que sou agora e acreditem que só guardo memórias boas!!
Aos meus amigos do Algarve que sempre me incentivaram a seguir os meus sonhos e que estão sempre lá para mim, mesmo havendo uma distância de 300 km a separar-nos… À minha grande, grande amiga Ana Beatriz Lopes, que me acompanha desde a primária (como é que é possível?) e que faz parte de quase todas as minhas memórias importantes, tanto boas, como más, é a minha metade! Ás minhas amigas Gabby Ferreira, Rita Martins pela amizade e boleias até ao Algarve e Ana Rita Cardoso. À Ana Rita era impossível escrever por palavras o quanto estou
v
grata por tudo o que ela fez por mim, às vezes até sem se aperceber. Ao Pedro Monteiro e todas as meninas que fizeram parte do grupo de teatro TV (Teatro Vilão), foram sem dúvida os melhores 4 anos da minha vida. A toda a gente que recentemente conheci e me ajudaram a ultrapassar certos momentos mais tristes e que estiveram comigo em outros de felicidade extrema.
Agora ao mais importante, à minha família, que ficou mais pequenina este ano, mas sem dúvida mais unida. À minha Tia Maria Pereira, mais conhecida por Joaquina, que já não está entre nós, mas que foi tão importante no meu crescimento pessoal enquanto ser humano, ensinou-me, com a doçura e jeito especial dela, a escutar os mais velhos e receber o amor e sabedoria dos mesmos. Tenho saudades dela! À minha mãe não tenho palavras para agradecer, todo o amor e carinho que me deu. É incalculável, todo o esforço que a vi fazer por mim, nunca conseguirei agradecer. Todos os taparweres de comida que ela me fez, todos os sacrifícios daqueles tempos difíceis que parecia que não íamos conseguir, mas conseguimos, obrigado, és a minha melhor amiga. Ao meu pai que acreditou em mim, que foi e é o pilar da nossa família, por sempre ter as palavras que mais me acalmavam quando achava que não ia conseguir, e por ser aquele que eu mais quero que tenha orgulho em mim! Amo-vos muito!! Não posso deixar de agradecer à minha pessoa favorita: o meu irmão Diogo. Aquele que foi o descuido que fez mais sentido na nossa família, não sei como consigo, mas o meu amor por ele é maior do que o meu próprio ser. É a pessoa que me completa e às vezes sem falar me ajuda mais do que qualquer pessoa, pelo seu olhar doce e enorme preocupação para comigo. Também um agradecimento especial ao resto da minha família que querem sempre o melhor para mim, sem vocês também não seria possível.
A todas as pessoas que aqui referi, e a outras tantas que não referi, espero que me continuem a acompanhar ao longo da minha vida que acaba de começar.
vi
Abstract
Breast cancer (BCa) is one of the most common and deadly diseases in women worldwide. In 2018, 2.1 million cases were diagnosed with BCa from which 626,679 women died. Therefore, an early diagnosis is imperative for treatment and a cure success rate. Recent studies have concluded that exosomes can be used as biomarkers, since they participate in the communication between cells, carrying genetic information from the mother cells.
Common methods of detection of exosomes as Enzyme-Linked Immunosorbent Assays (ELISA) are used, however, large amounts of highly concentrated sample, special preparation and labelling processes are required. As an alternative, Raman Spectroscopy stands out as a low-cost, simple and fast detection method that leads to a less invasive real sample collection and sample preparation. Low sample volumes are needed due to surface enhancement signal (SERS). However commercial SERS substrate for these measures present high cost and low shelf-life.
In this work, Ag-core-Au-shell bimetallic nanoparticles were directly synthesized on paper substrates (Whatman and Office paper) through two-stage successive ionic layer absorption and reaction (SILAR) techniques and tested as SERS substrates. Enhancement factors (EF) from 104
to 105 were reached and, for both substrates the Limit of Detection (LOD) was calculated as 10 -11 M R6G.
Non-tumoral (MCF-10A) and tumoral (MDA-MB-231) exosomes from breast cells were tested on the optimized substrates and Raman spectra were analysed by a statistical method called PCA (Principal Component Analysis). The data was successfully grouped with 95% confidence confirming its potential as a low-cost, label-free point-of-care test chip for the early diagnosis of breast cancer diseases.
Keywords: SILAR fabrication, bimetallic Ag@AuNPs, SERS, cellulose fibbers, PCA, exosomes
vii
Resumo
O cancro da mama é a doença mais comum e mortal nas em todo o mundo, em 2018, 2.1 milhões de casos foram diagnosticados aos quais 626,679 mulheres acabaram por morrer. Consequentemente, é necessário que haja um diagnóstico precoce para o tratamento e sucesso na cura. Estudos recentes concluíram que exossomas podem ser usados como biomarcadores, uma vez que participam na comunicação entre células, deixando informação genética proveniente da célula mãe.
Métodos como Ensaios de Imunoadsorção Enzimática (ELISA) são normalmente usados, no entanto são necessárias grandes quantidades de amostra altamente concentrada, preparações especiais da amostra e processos de rotulagem.
Como alternativa, a Espectroscopia de Raman destaca-se como método mais barato, simples e de deteção rápida que implica uma coleta de amostra menos invasiva e preparação da amostra menos exigente, também um menor volume de amostra é necessário devido ao melhoramento de sinal à superfície (SERS). No entanto, substratos SERS comerciais apresentam elevado custo.
Neste trabalho, foram sintetizada nanopartículas bimetálicas Ag-núcleo-Au-concha diretamente nas fibras do papel (papel Whatman e de escritório) através da técnica de absorção e reação sucessiva de camada iónica (SILAR) e testado como substratos SERS. Enhencement Factors (EF) obtidos foram de 104 e 105 e para ambos os substratos, o limite de deteção (LOD)
foi de 10-11 M R6G.
Exossomas saudávies (MCF-10A) e tumorais (MDA-MB-231) provenientes de células tumorais foram testados nos substratos otimizados e os espectros Raman foram analisados através de um método estatístico chamado de PCA (Principal Component Analysis). Onde os dados foram agrupados com 95% de confiança, confirmando o seu potencial como técnica de diagnóstico do cancro da mana no local, com baixo custo e label free.
Palavras-chave: fabricação SILAR, nanopartículas bimetálicas, Ag@AuNPs, fibras de celulose, PCA, exossomas
viii
Abbreviations
CENIMAT Centro de Investigação de Materiais
BCa Breast Cancer
MVBs Multivesicular Bodeis
AgNO3 Silver Nitrate
AgNPs Silver nanoparticles
HAuCl4 Gold (III) chloride hydrate
AuNPs Gold nanoparticles
NaBH4 Sodium borohydride
CaCO3 Calcite
Ag@AuNPs Bimetallic nanoparticles Ag-core-Au-shell
ELISA Enzyme-Linked Immunosorbent Assay
min Minutes
secs Seconds
SPR Surface plasmon ressonnce
LSPR Localized Surface Plasmon Resonance
EF Enhancement Factor
ix
XRD X-ray Diffraction
SEM Scanning Electron Microscope
EDS Energy-Dispersive X-ray Spectroscopy
XPS X-ray Photoelectron Spectroscopy
SERS Surface Enhanced Raman Spectroscopy
R6G Rhodamine 6G
LOD Limit of Detection
PCA Principal Component Analysis
PC1 Principal Component 1
PC2 Principal Component 2
x
Symbols
ISERS Raman peak intensity from a certain analyte in an active substrate (SERS
intensity)
IRaman Normal Raman peak intensity from a certain analyte (Raman intensity)
NSERS Number of molecules responsible for the SERS signal
NRaman Number of molecules responsible for the Raman signal
xi
Table of Contents
Acknowledgement ...iv Abstract ...vi Resumo...vii Abbreviations ...viii Symbols ...xTable of Contents ...xi
List of Figures ...xiii
List of Tables ... xv
Motivation ... xvi
1 Introduction ...1
1.1 Breast cancer exosomes analysis ...1
1.2 Surface-Enhanced Raman Spectroscopy ...2
1.2.1 Chemical enhancement effect ...3
1.2.2 Electromagnetic enhancement effect ...4
1.2.3 SERS Enhancement Factor and hot spots ...4
1.3 Bimetallic nanoparticles on SERS application ...5
1.3.1 Solid surface matrix and Ag@AuNPs SILAR-synthesised...5
2 Materials and Methods ...7
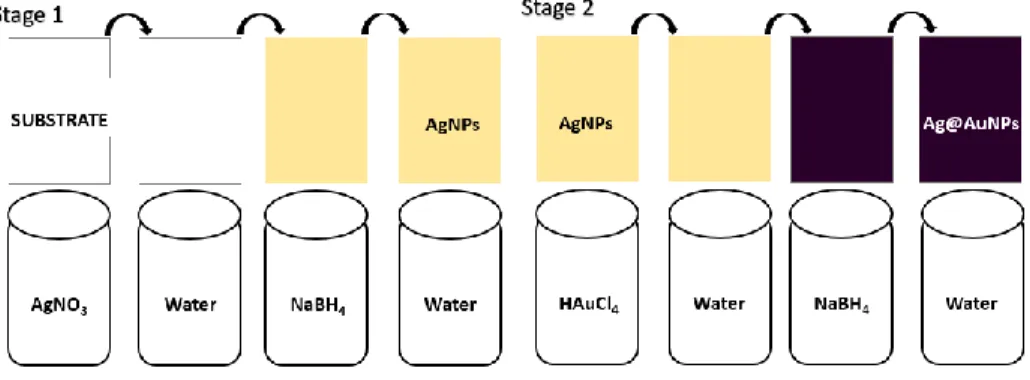
2.1 Production technique of the paper bimetallic features Ag@AuNPs by two-stage SILAR fabrication procedures on the cellulose substrate. ...7
2.2 Exosomes growth and isolation ...8
2.2.1 Cell culture ...8
2.2.2 Exosome Isolation/purification and labeling ...8
2.3 Characterization techniques ...9
2.3.1 Characterization of SILAR-synthesized Ag@AuNPs ...9
3 Results and Discussion ... 10
3.1 Characterization of cellulose base support: Whatman no.1 and Office paper ... 10
3.2 SILAR-synthesized Ag@AuNPs... 12
3.2.1 Optimization of SILAR-synthesized Ag@AuNPs on Whatman paper no 1 ... 13
3.2.2 Optimization of SILAR-synthesized Ag@AuNPs on office paper ... 16
3.2.3 SILAR-synthesized Ag@AuNPs on different papers: comparison... 22
3.2.4 Optimized SILAR-synthesized Ag@AuNPs on Office paper: Biological tests 27 4 Conclusion and futures perspectives ... 30
References ... 32
xii
Appendix B ... 37
Appendix C ... 38
Appendix D... 40
xiii
List of Figures
Figure 1.1 - Secretion of exosomes and exosome-mediated transfer. The formation of exosomes starts with the ...1 Figure 1.2 - Energy diagram representing (from left to right)- Elastic Rayleigh scattering (left), the inelastic Stokes (middle) and anti-Stokes (right) Raman scattering with 𝝎𝒊𝒏𝒄 , 𝝎𝒊𝒏𝒄±𝝎𝒗𝒊𝒃 and 𝝎𝒗𝒊𝒃 referring to the frequencies of the incident light, the Raman scattered light, and the molecular vibration, respectively. ...3 Figure 1.3 - Illustration of LSPR phenomenon ...4 Figure 1.4 Scheme of the two-stage SILAR fabrication of the Ag@AuNPs core-shell on the cellulose substrate (Adopted from Wansun Kim et al 28). ...6
Figure 2.1 - Scheme of two stage SILAR technique. Representation of stage 1 and stage 2 of the process. ...7 Figure 2.2 - Schematic representation of the sucrose cushion purification method ... Error! Bookmark not defined.
Figure 3.1 - SEM images of Whatman no.1 fibres (a) and Office paper fibres (b) ... 10 Figure 3.2 - EDS analysis of the paper substrates. Cumulative spectra of the EDS analysis of the Whatman no.1 paper (red) and office paper (blue). The chemical symbols on the top of each peak represent the corresponding element identified by the EDS technique and the intensity is indicative of the relative quantity of the elements. ... 11 Figure 3.3 - Diffractograms of office (blue) and Whatman paper (red). The peaks corresponding to Cellulose type I and Calcite (CaCO3) are represented. ... 12
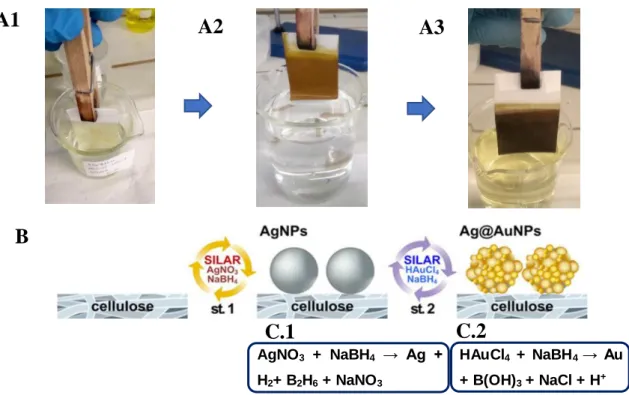
Figure 3.4 The images A1, A2, A3 correspond to what was actually done in SILAR-synthesis, where the papers are immersed in the solutions of each SILAR-cycle. A1-Beginning of the SILAR cycle for the formation of AgNPs, A2- end of SILAR-synthesis cycles for the AgNPs formation, A3- end of the synthesis cycles for AuNPs formation. B- Scheme of the two-stage SILAR fabrication procedures of Ag@AuNPs on the cellulose substrate (Adopted from Wansun Kim et al 28). C1 and C2 correspond to the chemical equations equivalent to reactions in the paper fibers
when the nanoparticles are synthesized. ... 13 Figure 3.5 - Raman spectra and (B) intensities of 1 mM R6G characterized peak at 1508 cm–1 with the number of SILAR cycles for decorating the shell AuNPs on the core AgNPs. ... 14
Figure 3.6 - Raman spectra of 10-6 M R6G with bare paper and AgNPs, AuNPs and
Ag@AuNPs on paper right after the synthesis; (B) Raman spectra of 10-6 M with Ag@AuNPs
and AgNPs on paper 30 days after the synthesis. ... 15 Figure 3.7 - Three measurement average of rhodamine SERS spectra on the optimized SILAR-synthesised Ag@AuNPs whatman nº1 substrate with different concentrations. (Left) zoom of the 1508 cm-1 peak range for 10-8 M, 10-9 M and 10-10 M. (Right) zoom of the 1508 cm-1 peak range
for 10-11 M and 10-12 M. ... 15
Figure 3.8 - Homogeneity tests of Whatman n.1 SERS substrate with Ag@AuNPs. ... 16 Figure 3.9 - Three average measurements of rhodamine SERS spectra of the SILAR-synthesised AgNPs on Office paper with reducing agent (red) and without reducing agent (blue) ... 17
Figure 3.10 - A- 3 average measurements of rhodamine SERS spectra of the SILAR-synthesised AgNPs on Office paper from 1 to 9 cycles. B- intensities of 10-6 M R6G characterized
peak at 1508 cm–1 with the number of SILAR cycles. C- Photo of the papers with the SILAR-synthesised AgNPs whitout reducing agent, from left to right: 1 to 9 cycles. ... 18
Figure 3.11 - A- EDS analysis of the substrate with AgNPs synthesized without NaBH4 as
reducing agent. B- SEM image of AgNPs 8 cycle SILAR-synthesised without NaBH4 reducing
agent. C- Distribution map of the substrates whose where AgNPs were SILAR-synthesised without NaBH4 as reducing agent. ... 19
Figure 3.12 - Three average measurements of rhodamine SERS spectra of the SILAR-synthesised AgNPs on Office paper varying the time of each step cycle: 10, 20, 30 , 40 and 50 secs. ... 19
xiv
Figure 3.13 - A- Raman spectra and B- intensities of 10-6 M R6G characteristic peak at 1508
cm-1 with the number of SILAR cycles for decorating the shell AuNPs on the core AgNPs.
C-photo of the substrate after the Ag@AuNPs were synthesized by SILAR method. ... 20 Figure 3.14 - Three measurement average of rhodamine SERS spectra on the optimized SILAR-synthesised Ag@AuNPs (AgNPs synthesis without NaBH4 as reducing agent) on Office
paper support with different concentrations. (Left) zoom of the 1508 cm-1 peak range for 10-9 M
and 10-10 M. (Right) zoom of the 1508 cm-1 peak range for 10-11 M and 10-12 M. ... 21
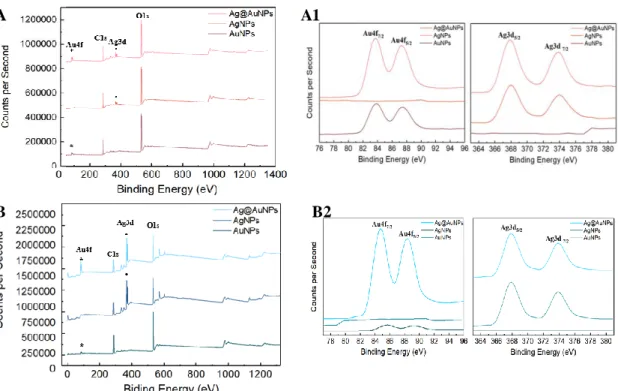
Figure 3.15 - Homogeneity tests of Office paper SERS substrate with Ag@AuNPs... 22 Figure 3.16 - (A) XPS spectra of the previously optimized SILAR-synthesised AuNPs, AgNPs and Ag@AuNPs on Whatman paper; (B) XPS spectra of the recent optimized SILAR-synthesised AuNPs, AgNPs and Ag@AuNPs on office paper. (A1) and (B1) Zoomed part of the spectrum relative to gold and silver peaks... 23 Figure 3.17 - (A) XPS spectra of the SILAR-synthesised Ag@AuNPs on Office paper without NaBH4 as reducing agent of silver synthesis with differences in synthesis time: 30 (blue) and 40
secs (orange) each cycle step; (B) Zoomed part of the spectrum relative to gold (Au4f) and silver (Ag3d) peaks. ... 24 Figure 3.18 A- XRD diffractograms of office paper (blue) and Whatman paper (red) with SILAR-synthesised bimetallic nanoparticles Ag@AuNPs. B- XRD diffractograms of Ag@AuNPs SILAR-synthesised on Office paper without NaBH4 as reducing agent of silver NPs
with differences in synthesis time: 30 (blue) and 40 secs(orange) each cycle step... 25 Figure 3.19 - EDS analysis of the Whatman com Ag@AuNPs synthesized with the previously optimized SILAR-synthesis (red) and the Office paper with Ag@AuNPs synthesised with the recent optimized SILAR-synthesis (blue). C- EDS image and B- Distribution maps of the office substrate. ... 26 Figure 3.20 - SEM images of the Ag@AuNPs synthesized by the two-stage SILAR technique on Whatman nº1 paper and Office paper. ... 27 Figure 3.21 - PCA resultant score plot using PC1 and PC2 as the analysed principal components: PBS (control) in black, MCF-10A (red) and MDA-MB-231 (green) exosome sample analysed. (B) Average PBS, MCF-10A and MDA-MB-231 Raman spectrum: spectra peaks with most variance between groups highlighted in pink. ... 28
xv
List of Tables
Table 3.1 - Values of fibre diameter, porosity and pore size of Whatman and Office paper . 10 Table 3.2 - XPS element quantification for the different papers... 24 Table 3.3 - Mean values of bimetallic nanoparticle diameters on Whatman and Office paper ... 27
xvi
Motivation
Breast cancer stands out as the most deadliest disease among women around the world. The success rate depends on the early diagnosis, however the available diagnostic methods are not fast enough to guarantee this. Exosomes have been studied as biomarkers, since they participate in the communication between the same cell and different cells, carrying information from the mother cell, and thus can be used as a promising detection tool in the early diagnosis, since this microvesicle are found in almost all body fluids. Current methods of detection of exosomes such as Enzyme-Linked Immunosorbent Assay (ELISA) are not appropriate for an actual diagnostic test due to the need to use samples of very high concentrations and complex preparation.
Optical techniques such as Surface Enhanced Raman spectroscopy (SERS) has shown great interest and sensitivity in this type of tests, besides the need of small sample amounts of reduced concentration, simple preparation and non-destructive. Existing commercial substrates have a high cost and a very short lifetime.
The main objective of this work is the development of a SERS substrate, capable of distinguishing biological samples containing tumoral and non-tumoral exosomes, using paper substrates, in which bimetallic silver-core-gold-shell nanoparticles are directly synthesized in the paper fibers. Rhodamine (6G) will be used as a test molecule for substrate optimization and to verify its SERS sensitivity.
Exosomes from tumoral cells (MDA-MB-231) and non-tumoral cells (MCF-10A) will be isolated, purified and tested with the developed substrates through Raman Spectroscopy. The data will then be analysed through PCA analysis, in order to group these data within 95% confidence ellipses, demonstrating that this can be an important tool in the early diagnosis.
1
Introduction
1.1 Breast cancer exosomes analysis
Every day thousands of people die due to a long illness. In the case of women breast cancer (BCa) it is the most common cause of death worldwide. The disease is more manifested in more developed countries, whereas in developing countries the rates are low but with a tendency to increase1.
According to Global Cancer Statistics (data from GLOBOCAN 2018), in 2018, almost 2.1 million cases were diagnosed with BCa from which 626,679 women died2, thus an early diagnosis
is very important. Studies had shown that cancers arises due to a series of sequential mutations which occur as a result of genetic instability, environmental factors3 and other factors like
breastfeeding, menopause, oral contraceptives, among others1.
Nowadays, there are many ways for BCa conventional diagnosis, Mammography is the most common exam used among women around the world, the doctors refute that women over the age of 20 should take this test every year, that consists in a X-Ray picture of the breast. Magnetic Resonance Imaging (MRI), similar to Mammography is also used as a detection method. This method gives a high-resolution image of the breast without the use of harmful radiation. However, for more effective examination the most used is the breast biopsy (tissue sample obtained from the organism for the purpose of examining it in detail4) is the most definitive exam for diagnosing
all the types of breast cancer5.
In the past, control of BCa was not possible due to poor knowledge of the molecular mechanisms involved in the pathogenesis of this cancer. Recently, it was concluded that small extracellular vesicles (EVs) named exosomes are involved in BCa development, and for this reason, exosomes can be considered as biomarkers for BCa diagnosis and terapy6. Exosomes are
small membrane vesicles, (microvesicles), first documented by Pan and Johnstone in 19836, with
sizes ranging between 30 and 100 nm. These membranes are mostly derived from the fusion of multivesicular bodies with the cell plasma membrane7, and secreted by normal and diseased cells,
during endocytic recycling8. It contains genetic information from the cell in which they were
formed, mediates cell-to-cell communication by transferring proteins, RNA, and lipids between cells6,9 and also have autocrine effects on the same cell type contributing to the proliferation of
cancerous cells10 (Figure 1.1).
Figure 1.1 - Secretion of exosomes and exosome-mediated transfer. The formation of exosomes starts with the invagination of the plasma membrane, resulting in early endosomes that mature into multivesicular bodies (MVBs). Upon fusion of MVBs with the plasma membrane these vesicles are secreted and release into the
2
extracellular environment as exosomes, and then they interact with recipient cells. (Adopted from Jin-Peng
Wang et al)11
These small vesicles are of great interest for diagnosis and prognostics applications since they are secreted by cells directly into their local environment and body fluids such as saliva, urine, cerebrospinal fluid, and so on, making them easily acessible6. However, EVs from the same
mother cell may contain slightly different genetic information making it difficult to detect.12
The different methods applied to exosomal detection can be classified into optical and non-optical methods13. The non-optical are the most common methods like enzyme-linked
immunosorbent assays (ELISA)8, that allows the detection of specific antibodies presents in the
sample, Western Bolt, that separate and classifies the sample proteins based on molecular weight, and thus by type, through gel electrophoresis14 (despite providing high-resolution molecular
information of exosomal content, it requires large amounts of highly concentrated sample, special sample preparation and labelling processes12,15) and other methods like X-ray microscope,
transmission electron microscopy, atomic force microscopy and impedance-based flow cytometry. As an alternative, there is a need for simpler and faster methods for biological applications, such as optical techniques including scattering flow cytometry (SFC) that relies on the scattered light, Dynamic Light Scattering (DLS), based on measuring the light scattering dependent of the Brownian motion of vesicles and Surface-Enhanced Raman Spectroscopy (SERS), which enhances the electrical field by a surface treatment and analyses vibrational modes of the sample by measuring the non-elastic scattering effect caused by a radiating laser ,among others8,13.
1.2 Surface-Enhanced Raman Spectroscopy
Nowadays, Raman Spectroscopy is known to be an important method for the evaluation of biological samples, since it gives fingerprint information about the structure and conformation of biomolecules such as proteins, lipids and acid nucleics16,17. Thus this analytical technique is
capable of providing important information about the biochemical content of exosomes allowing its detection and can be considered a simpler and faster method for biological applications18.
Raman scattering consists in an inelastic scattering, first characterized by Raman and Krishman in a Nature publication in 192819. This phenomenon, known as Raman scattering, is
based in the observed change of the wavelength of a photon by molecules rather than an absorption. In other words, the inelastic scattering occurs when some of the energy of the incident photon is lost or increased, in which the frequency changes and equals precisely the difference in vibrational energy levels20,21. This excitation energy sets the molecule into a virtual state, the
molecule moves to a new state, for a short period of time before the photon is emitted with different energy than the initial frequency of the photon. If the initial energy state is lower than the final state, the scattered photon will be shifted to a lower frequency, ensuring that total energy remains the same (Stokes Shift). In other hand, if the final state is lower in energy, the scattered photon will be shifted to a higher frequency (Anti-stokes shift) (Figure 1.2) 22.
3
Figure 1.2 - Energy diagram representing (from left to right)- Elastic Rayleigh scattering (left), the inelastic Stokes (middle) and anti-Stokes (right) Raman scattering with 𝝎𝒊𝒏𝒄 , 𝝎𝒊𝒏𝒄±𝝎𝒗𝒊𝒃 and 𝝎𝒗𝒊𝒃
referring to the frequencies of the incident light, the Raman scattered light, and the molecular vibration, respectively.
Every molecule has its own Raman spectrum, because each functional group have different characteristic vibrational energies 20. However, one of the major drawback consist on the number
of scattered photons related with the vibrational energies within the analyte, 1 in 106-1010, causing
the Raman signal considerably weak, which places limitations on the detection of analytes at very low concentrations23. Other drawback is the strong fluorescence background making difficult to
extract the Raman signals16 being about 14 orders of magnitude smaller than the fluorescence
emission in most cases. Therefore, Raman scattering was restricted for many years20, leading to
the need to use high laser power and major time of data collection for spectral acquisition which may lead to degradation of the sample16.
To solve this problem, Jenmaire and Van Duyne, in 1974, proved that it’s possible to greatly enhance the Raman scattering signal placing the scattered near a roughened noble-metal substrate, colloidal solution or roughened electrode 16-20 by noticing that pyridine adsorbed on a roughened
silver electrode dramatically increases the Raman signal24.
This finding allowed the development of Surface Enhanced Raman Spectroscopy (SERS), that greatly improves the Raman signal being strongly enhanced up to 1014 times, while suppresses
fluorescence emissions at the same time16.
SERS phenomenon is based on the fact that the local high electric fields are generated when the localized surface plasmon resonance (LSPR) of the metal features on the surface are excited by visible light22.
There are two enhancement factors that contribute to SERS spectroscopy: chemical (CE) and electromagnetic (EM) enhancement mechanisms. The CE factor is usually associated with the transferring of charges between the adsorbed analytes and metal nanofeatures on the surface. The EM is the dominant contribution, where there is an increase of the electromagnetic field caused by the interaction of the light on the metal surface inducing the excitation of the plasmon.17
1.2.1 Chemical enhancement effect
This effect consists on a transfer of charge between the metal structure and the absorbed molecules. The charge transfer possible to occur it’s about half the energy of the intrinsic intramolecular excitations when the energy of highest occupied molecular orbital (HOMO) and lowest unoccupied molecular orbital (LUMO) of the adsorbate are distributed according to the Fermi level of the metal25. The existence of this charge-transfer sate leads on a major probability
of Raman transition by providing a pathway for resonant excitation. This mechanism strongly depends on the direct interaction between the substrate and the adsorbate, being limited by the first adsorbed molecules, resulting on smaller enhancement compared to the EM21.
4
1.2.2 Electromagnetic enhancement effect
As described above, EM effect consists on the interaction of an electromagnetic wave with a metal surface, typically composed of gold (Au) and/or silver (Ag)22. These metallic nanoparticles
(MNPs) have been a subject of research for decades due their associated strong plasmon resonance frequency (delocalized conduction electrons- named plasmas oscilatiors)20 which
represents an enormous interest in areas such as nanoscale photonics and biological sensing26.
This surface plasmon resonance varies depending on the NPs properties such as metal type, size, shape, distance between particles and also the dielectric environment of the MNPs26.
The enhancement results from the amplification of the light by the excitation of localized surface plasmon resonances (LSPRs)27, leading to a local enhance electromagnetic fields due the
fact that particle surface plasmon resonance allows direct coupling of light to resonant collective electron plasmon oscillation (Figure 1.3). A Coulombic attraction appears, acting as a restoring force between negatively charged electronic cloud with a positively charged metal surface. Those wavelengths of the incident light that equals to this resonance frequency are absorbed and can be elastically re-emitted as scattered light from nanoparticles, acting as an antena22.
Therefore is important to obtain a rough surface because of this light concentration that occurs preferentially in the gaps, crevices or sharp features of plasmonic materials.26
Figure 1.3 - Illustration of LSPR phenomenon
1.2.3 SERS Enhancement Factor and hot spots
Due to an increase of local electric field on SERS substrates, an increase in the signal strength is observed, comparatively with the Raman scattering, and the enhancement factor (EF) is a measure of the efficiency of SERS substrates. The constant development of new SERS substrates creates the need to compare them with each other, already known in the literature28, knowing that
the single molecular (SM) detection is one of the main objectives in the development of SERS substrates. EF is a quantitative method to express this capacity, with values above 108-1010 are, in
fact, sufficient for the detection of SM-SERS.28 The average EF shall be calculated from the
following equation:
𝐸𝐹 = 𝐼𝑆𝐸𝑅𝑆
𝐼𝑅𝑎𝑚𝑎𝑛×
𝑁𝑅𝑎𝑚𝑎𝑛
𝑁𝑆𝐸𝑅𝑆 (1.1) Equation (1.1), describes the average Raman enhancement and the enhancement of the incident wavelength and the resulting Stokes-shifted Raman field22, where I
SERS and IRaman are the
scattering intensities of the SERS and normal Raman substrates, and NSERS and NRaman are related
to the number of molecules that contribute to the inelastic scattering evaluated by SERS and normal Raman scattering measurements29.
Although it is hard to produce substrates that consistently provide enhancements for single molecule detection. The effort to improve EF has led to a tremendous interest in the properties of nanoparticles. Metal aggregations, nanoparticles different shapes, for example, pointed edges, like star shapes, or conjugation of different nanoparticles such as bimetallic, creates punctual locations called “hot-spots”, in which near-field intensities are greater than the far field intensities when under resonance conditions and consequently the increase of the signal intensity. Studies
5
are underway to ascertain the influence of sizes, shapes of nanoparticles and interparticle distances, smaller than 2 nm induce extraordinary enhancements on SERS phenomena due to the generation of nonlocal effects and quantum confinement 25,30,31,32.
1.3 Bimetallic nanoparticles on SERS application
For SERS are commonly used all types of metallic features in all kind of shapes and sizes, like sphere or star-shaped nanoparticles. Metallic nanoparticles have their strong plasmon resonance which is used for enhancement proposes in fields such as nanoscale photonics and biological sensing26. Silver and gold nanoparticles (AgNPs and AuNPs, respectively) are the most common
metallic compounds used for SERS implementation due to their unique optical, electric, magnetic and catalytic properties33. Despite offering a strong surface plasmon resonance effect, AgNPs
suffers a rapid decrease in SERS efficiency due to state of early oxidation. On other hand, AuNPs are more stable nanoparticles than AgNPs, however provides a considerably decrease in SERS efficiency in terms of detection of a single molecule28. In addition, the use of gold is also
advantageous for the detection of exosomes, since it’s been used on experiments with biological compounds and shows an incredible biocompatibility34,35. Bimetallic composite nanoparticles
composed of two different metal elements structures have shown a great interest for this type of applications than monometallic nanoparticles. The bimetallic nanostructures are defined by the distribution and orientation of the elements. This structures can be oriented randomly alloy, alloy with an intermetallic compound, cluster-in-cluster and core-shell structures.36 This work is based
on bimetallic nanoparticles (Ag@AuNPs) core-shell structure in order to increase the SERS EF and overcome silver oxidation28.
1.3.1 Solid surface matrix and Ag@AuNPs SILAR-synthesised
A SERS substrate consists in a nanofabrication of metallic features, taking into account that the substrate used in SERS has as main and fundamental requirement to support the LSPR capable of providing the greatest amount of “hot-spots” in order to achieve great enhancements21,22 for
on-site applications.
Cellulose substrates have been widely used for SERS due to its flexibility, lightweight, low-price and user friendly, requirements for a substrate to be used as sensing support for on-site applications 22. Cellulose matrices such as paper are also used to increase substrate rugosity due
to the random orientation and texture of their fibers, thus increasing the number of “hot-spots”. Dipping and printing the paper strip for deposition of plasmonic nanoparticles are techniques that have been studied, however they have shown a non-uniform distribution of SERS-active region. Apart from that, these methods require complicated processes28. In this project, it was used a
recent technique of deposition of Ag-Core-Au-Shell nanoparticles (Ag@AuNPs) directly on the paper substrate based on layer-by-layer deposition of opposite charges (positive and negative ions), called SILAR (Successive Ionic Layer Absorption and Reaction). The SILAR method was firstly introduced by Nicolau in the 80s as a technique for thin films depositions37. SILAR is
mainly based on the adsorption and reaction of the ions and solvated ions on the solid-liquid interface. It is separated in 2 stages, the first stage consists in the formation of AgNPs (core) and the second stage translates into the synthesis of AuNPs (shell) over the already synthesized AgNPs. In both stages, metal cations (Ag+ and Au3+) are adsorbed onto the paper. The next step
consists of washing the paper with deionized water (DW) in order to eliminate all the excess unadsorbed cations. Next, the paper is immersed on the reducing solution (NaBH4), allowing the
reaction to occur. The adsorbed cations in contact with the sodium borohydride ions (BH4-) reacts
6
water to expel the ions in the diffusion layer weakly bonded to the paper fibbers (Figure 1.4). It is expected to obtain raspberry-shape nanoparticles. The need of low deposition temperatures, easy to performed and control the size of nanoparticles through multiple repetitions of chemical reactions are characteristics that make this technique quite appealing28.
Figure 1.4 Scheme of the two-stage SILAR fabrication of the Ag@AuNPs core-shell on the cellulose substrate (Adopted from Wansun Kim et al 28).
7
2
Materials and Methods
2.1 Production technique of the paper bimetallic features Ag@AuNPs by
two-stage SILAR fabrication procedures on the cellulose substrate.
The synthesis performed in this work were based on the two-stage SILAR28 method where the
bimetallic nanoparticles were directly synthesized on the paper by the successive ionic layer absorption and reaction.
Two types of paper were used as substrate: Whatman nr. 1 (Whatman Internacional Ltd., Florham Park, NJ) and Office paper (300%, Portucel Soporcel, Setúbal, Portugal).
SILAR process
All the glass material was immersed with aqua regia for at least 5 hours, to ensure that all the particles were eliminated. Next all the material was placed under running water and its pH value was checked and washed again with Milli-Q water, until a pH of 7.0.
The SILAR synthesis was performed according to the schematic representation depicted in Figure 2.1.
Figure 2.1 - Scheme of two stage SILAR technique. Representation of stage 1 and stage 2 of the process.
• With reducing agent:
An optimization on the concentrations of reactants and number of cycles was perform along this work. The protocol detailed below shows the optimized conditions.
Firstly, the AgNPs-core (Figure 2.1, Stage 1) was directly synthesized on the paper strip, using 6 cycles with 20/20 mM of AgNO3/NaBH4: the paper substrate was dipped in aqueous silver
nitrate (AgNO3>99%, from Sigma-Aldrich) and washed with Milli-Q water. Then it was dipped
in the reducing agent solution of sodium borohydride (NaBH4>96%, from MERCK) and rinsed
with Milii-Q water to remove all the residual non-reactants. Stage 2 consists on the synthesis of the AuNPs-shell (Figure 2.1, Stage 2) using 2 cycles with 1/1 mM of HauCl4/ NaBH4): the paper
with AgNPs already synthesized, was dipped in an aqueous solution of gold (III) chloride trihydrate (HauCl4>99%, form ACROSORGANICS) and rinsed with Milli-Q water. Then it was treated in NaBH4 reducing solution and rinsed once again with Milli-Q water. In the SILAR
fabrication, one cycle includes four successive steps such as the treatment of the substrate in a metal salt solution (AgNO3 or HAuCl4) and rinsed to wash out non-reacted remains, re-treatment
of the paper in the reducing solution and again washed with water. Each step has a duration of 30 sec, making 2 min the total time of a cycle.
8
Unlike the SILAR method described above, for the office paper no reducing agent was used. The AgNPs-core were grown directly on the substrate, according to the experiments (8 cycles with 20 mM of AgNO3). The paper strip was sunken in aqueous silver nitrate and washed with
Milli-Q water, counting as a cycle in order to remove all the non-reactants, the time of each step was increased to 40 sec in agreement with the newly optimized conditions. Secondly, the AuNPs-shell were deposited directly into the AgNPs-core in accordance with Figure 2.1- stage 2, keeping the time of each step following the already optimized conditions28.
2.2 Exosomes growth and isolation
The isolation of exosomes was performed at Champalimaud Foundation (CF), where all the equipment and materials were made available for the cell culture of tumoral (MDA-MB-231) and non-tumoral (MCF-10A) exosomes and its isolation.
2.2.1 Cell culture
For the growth of the tumoral cells (MDA231-TGL), it was prepared a culture medium by adding to a 500 ml of DNEM (Lonza™ BioWhittaker™), 1% of Penicillin/Streptomycin (P/S) antibiotic solution to prevent contamination of exosomes and 10% of Fetal Bovine Serum (FBS, from Biomest). Both reagents were frozen and heated to 37°C to prevent thermal shock of the cells. Then an Exo-free medium was prepared: 40 ml of FBS was ultra-centrifuge (Beckman Coultier, Optima XPN-100 Ultracentrifuge) at 100000 xg, for 2h20min at 10°C, using a 45Ti motor, and passed through a filter to discard all the obtained pellet, and a new culture medium was prepared with the same reagents and the same proportions described above, with the Exo-free PBS.
After the cells are thawed, 1 ml were added to 8 ml of culture medium (DNEM+FBS+P/S) in order to remove the remain Dimethyl sulfoxide (DMSO), followed by centrifugation at 1200 rpm for 5 min at 24°C (Sorvall, ST40R, centrifuge). After removing the supernatant, the cells were re-suspended with 20 ml of culture medium then leave to incubate at 37 °C with 5% of CO2 in a 175
ml culture flask. Once reached the confluence point, the number of cells were estimated using a haemocytometer to guarantee the existence of 1 million cells per ml and then distributed by 5 culture dishes (1 ml of cells and 19 ml of Exo-free culture medium) and was left to incubate for 2 days at 37 °C with 5% of CO2 until reaching the confluence point.
The cell passages were made by sucking the culture medium, with a small vacuum system, then the phosphate buffer saline (PBS 1X 7.4 pH, Lonza) was added in enough quantity to cover the bottom of the flask and the same amount of trypsin to detach the cells from the bottom and leave to incubate for 5 min. Then 10 ml of culture medium was added to neutralize the trypsin and centrifuged at 1200 rpm, for 5 min at 24 °C.
For non-tumoral cells, the procedure was the same described above with few exceptions. The Dulbecco's Modified Eagle Medium/Nutrient Mixture F-12 (DMEM/F12, Sigma-Aldrich) medium was supplemented with 5% of Horse Serum and Epidermal Growth Factor (EGF, 20 ng/ml), Hydrocortisone (0.5 mg/ml) and Cholera toxin (100 ng/ml) and due to a toxicity of this toxin, this process was done on the biosafety unit BSL2 of the CF.
2.2.2 Exosome Isolation/purification and labeling
The process of isolation and purification was the same for both cellular lines. First, was collected the culture medium and then centrifuged at 500 rpm for 10 min at 10 °C to remove all dead cells and remain only the medium rich in exosomes. Then a second centrifugation was performed after removal of the previous pellet at 3000 g for 20 min at 10°C and storage at 80°C.
9
The collected supernatant was then transferred to an ultracentrifuge tube and two ultra-centrifugations were performed at 12000 xg for 2h20min at 10 °C and discarding the pellet. The resulting supernatant was submitted to another centrifugation at 100 000 xg for 2h20min at 10 °C and finally discarded, obtaining an aggregated pellet containing the exosomes. Then, the purification process is followed with the sucrose cushion. To a 4 ml sucrose solution (protocol in Appendix B, B1) was slowly added 14 ml of PBS diluted with the previously obtained pellet, to not break the sucrose layer and proceeded to ultra-centrifugation at 100 000 xg for 1h10min at 10 °C. Then, about 5 ml of the resulting phase mixture of sucrose and exosomes was collected far from the pellet. Finally, 16 ml of PBS was added to the collected fraction and the last ultra-centrifugation was carried out overnight at 100 000 xg at 10 °C, and the resulting pellet was resuspended in 100 – 200 µl of PBS.
2.3 Characterization techniques
2.3.1 Characterization of SILAR-synthesized Ag@AuNPs
Different papers (Whatman n. 1 and Office): The papers were morphological analyzed through Scanning Electron Microscopy (SEM, Carl Zeiss AURIGA FIB-SEM Croossbeam), to investigate and compare the type and density of paper fibers. Energy Dispersive X-ray spectroscopy (EDS) coupled with SEM imaging was used for chemical identification of the paper fibers. The conductive coating (Iridium) on the paper samples was performed by sputtering (Quorum).
X-ray Diffraction (XRD, PANalytical, X’Pert Pro) was done to have a structural analysis and subsequent calculation of the crystallinity index.
SILAR-synthesized Ag@AuNPs: The obtained composites were also morphologically characterized by SEM and EDS, as described above, with the exception that for EDS analysis Iridium was not used to avoid gold peak overlap with the iridium peak, instead carbon was used. X-ray photoelectron spectroscopy (XPS, Kratos, Axis Supra) was used for superficial chemical identification to confer the presence of metallic features of silver and gold. X-Ray Diffraction (XRD) was used for diffractogram obtainment to check for cellulose, silver and gold diffraction peaks.
The SILAR-synthetized papers were tested as SERS substrates using Renishaw® inViaTM
Qontor® confocal Raman microscope and using both lasers (532 and 633 nm) depending on the purpose of the measurement. The Raman Shift wavenumber scan was centred at 1200 cm-1.
The baseline was subtracted from all spectra using the WiRETM 5.0 software.
Tumoral and non-tumoral exosomes: The NanoSight®, NS300, located at Champalimaud Foundation, was used to characterize the size distribution of isolated and purified exosomes from both cultured cellular lines (tumoral and non-tumoral). The samples were diluted 1:3000 and 1:5000 for tumoral and non-tumoral exosomes, respectively. Results are presented in Appendix B, B2.
10
Results and Discussion
The main purpose of this work was the development of new, efficient, cheap, flexible and environment-friendly substrates for SERS applications. For that, it was studied two types of cellulose substrates: Whatman no.1 and Office paper. The obtained substrates were morphologic and chemically characterized by the techniques described in the previous chapter and finally tested as SERS active substrates.
3.1
Characterization of cellulose base support: Whatman no.1 and Office paper
Both papers were morphologically characterized, by SEM, in order to understand and compare the type and density of the fibers.
Figure 3.1 - SEM images of Whatman no.1 fibres (a) and Office paper fibres (b)
It is crucial for SERS that the nanoparticles concentrate on the surface to interact as much as possible with the analyte to achieve higher signal efficiency22. In the figure above it’s possible to
observe at microscopic level the random arrangement of fibres on both papers. The Whatman (a) paper fibres have a more cylindrical geometry, which contributes to a larger paper thickness, unlike Office paper (b) which has flatter fibres. Whatman is a lot more porous than the Office paper, and the latter seems to have a higher fibre density indicating that this one has a flatter surface.
Besides that, it’s possible to observe that the Office paper is covered by calcium carbonate (CaCO3) crystals resulting from the bleaching process that the paper undergoes (a process that
chemically modifies the materials themselves)38. The presence of this salt was suspected to aid in
the formation of NPs.
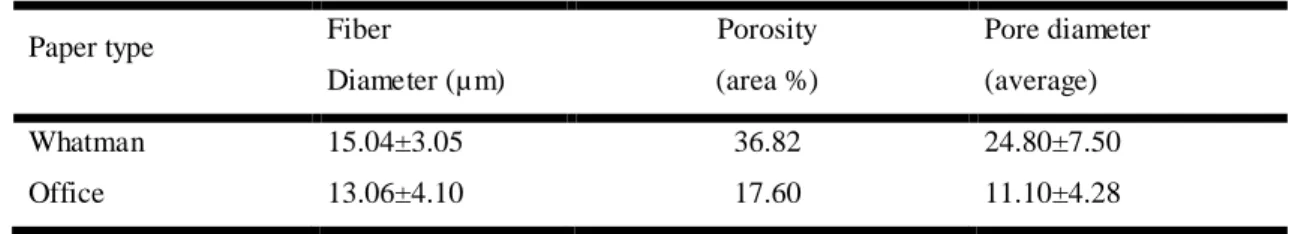
The average fiber and pore diameter of the papers were calculated using ImageJ software and the results are shown in Table 3.1.
Table 3.1 - Values of fibre diameter, porosity and pore size of Whatman and Office paper
Paper type Fiber
Diameter (µm) Porosity (area %) Pore diameter (average) Whatman 15.04±3.05 36.82 24.80±7.50 Office 13.06±4.10 17.60 11.10±4.28
The obtained results show that in terms of fiber diameter, the two papers are very similar. However, the office paper, as is well visible in Table 3.1, has a significantly lower porosity and
11
pore size, indicating that the surface area of office paper is higher than Whatman paper, although office paper pores are mostly covered by the salt
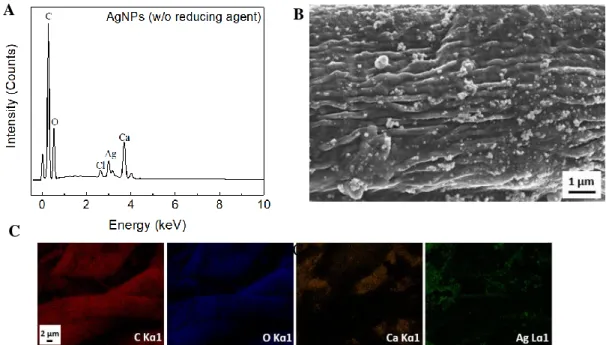
In addition, SEM-EDS was used. It’s an important technique to perceive the differences between substrates, since this is a semi-quantitative analysis giving information on the chemical composition of the sample, it’s possible to confirm not only the existence of certain elements, but also their relative quantity39. In both papers, the prominent peaks, represented in the spectrum of
Figure 3.2, correspond to Carbon, C (E = 0.28 keV), and Oxygen, O (E = 0.52 keV) since these are the constituents of cellulose, the main component of paper. Also, the common initial peak to all papers, corresponding to (E = 0 keV), is characteristic of the equipment and the Ir peaks at E = 1.98 keV and E = 2.08 keV are related to the paper coating (thickness of 10 nm) and not to its composition.
Comparing to Whatman no.1 paper (98 % of cellulose), office paper is composed by more elements40. The presence of the CaCO
3 salt in office paper is confirmed by the detection of
Calcium (Ca) (E = 3.7 keV and E = 4.02 keV). Also, other elements were detected in residual quantities such as Sodium (Na) (E = 1.04 keV), Silicon (Si) (E = 1.48 keV) and Chlorine (Cl) (2.62 keV). The Si is the main constituent of the support used in this technique and the remaining elements are possible contaminations of the papers.
Figure 3.2 - EDS analysis of the paper substrates. Cumulative spectra of the EDS analysis of the Whatman no.1 paper (red) and office paper (blue). The chemical symbols on the top of each peak represent the corresponding element identified by the EDS technique and the intensity is indicative of the relative quantity of the elements.
In addition to the cumulative spectrum, the EDS analysis also provides a distribution map of the different types of detected elements (Appendix A, Figure A1). The distribution maps confirm that oxygen and carbon are the main constituents of the cellulose fibers of both papers. Calcium is only possible to observe on office paper, as expected, and is in a considerable proportion in relation to carbon and oxygen and according to the map of distribution this element is in the form of agglomerate between the cellulose fibers.
In complementarity the structural analysis of the papers was made through X-ray diffraction and the diffractograms are represented in Figure 3.3, also indicating the identified crystalline structures.
It is possible to observe that the papers show the crystalline diffraction pattern of type I cellulose with the main peaks at 14.9º, 16.6º and 22.8º in 2θ values, corresponding to the crystalline planes (11−0), (110) and (002), respectively41. However, the office paper presents the
12
two first peaks convoluted at 15.9º, indicating the presence of amorphous components in its structure, such as hemicellulose and lignin42.
Figure 3.3 - Diffractograms of office (blue) and Whatman paper (red). The peaks corresponding to Cellulose type I and Calcite (CaCO3) are represented.
By this technique it is also possible to determine the index of crystallinity (Icr) of the substrates
which can be calculated using the maximum intensity of the plane (002) of the crystal structure of type I cellulose, I(200), (peak at 22.8 °) and the intensity of the (11−0) plane peak, related to the
amorphous components of the cellulose, I(11−0), using the Segal empirical method, through Equation 3.1:
𝐼𝐶𝑟=𝐼(002)−𝐼(11−0)
𝐼(002) × 100 (3.1) As expected, office paper has a lower index of crystallinity (69 %) than Whatman paper (74 %), confirming what was previously said.
In addition, the analysis of the office paper diffractogram identifies the crystalline form of calcite, showing peaks around 29.4º, 35.9º, 39.4º, 43.1º, 47.5º and 48.6º that aren’t present in Whatman paper. These peaks were related to the (104), (110), (113), (202), (018) and (116̅) crystal planes, respectively. Calcite (CaCO3) represents 20% of the office paper composition and
is the main additive used in the photochromic papermaking process. It forms porous agglomerates that impart opacity and brightness, altering the optical properties of the paper41–43.
3.2 SILAR-synthesized Ag@AuNPs
In this work, a method of successive adsorption and ion-layer reaction (SILAR) was used for the formation of bimetallic nanostructures of gold and silver directly on the substrates (Whatman and office paper). This is a simple and inexpensive method, done at room temperature and requires less synthesis time compared to conventional methods such as Chemical Vapor Deposition (CVD), Metal-Organic Chemical Vapor Deposition (MOCVD), among others, that are very cumbersome and inefficient for the deposition of complex materials44. The synthesis is based on
treating the substrate separately with each aqueous precursor solution so that the adsorption and reaction can occur.
The core@shell nanoparticles are constructed by two-stage SILAR fabrication procedures including the formation of AgNPs (core) into paper and the synthesis of AuNPs (shell) on the AgNPs. The first stage consists on AgNPs synthesis, the silver cations (Ag+) are adsorbed onto
13
the paper, and then all the excess unadsorbed cations are washed away by rising the substrate with purified water. The rinsing is followed by the reaction step where the paper is dipped into the aqueous anion precursor solution (NaBH4) and the solvated anions (BH4̶) react with the adsorbed
cations forming a solid Silver compound (Ag0) on the surface and once again the unadsorbed ions
are washed away with purified water. The second stage consists on AuNPs synthesis over the AgNPs already formed. First, the paper is immersed into an aqueous solution of HAuCl4·3H2O
and the gold cations (Au3+) are adsorbed onto the paper and the excess unadsorbed ions are
washed away with deionized water. Then the paper is immersed in the reducing solution where the reaction takes place, the anions (BH4̶), in the diffusion layer, react with the adsorbed cations
forming a solid Gold compound (Au0) over the Silver. By repeating these deposition cycles,
nanoparticles can be formed layer by layer. The size of the nanoparticles and their growing shape is controlled by the number of deposition cycles.
AgNO3 + NaBH4 → Ag +
H2+ B2H6 + NaNO3
HAuCl4 + NaBH4 → Au
+ B(OH)3 + NaCl + H+
Figure 3.4 The images A1, A2, A3 correspond to what was actually done in SILAR-synthesis, where the papers are immersed in the solutions of each SILAR-cycle. A1-Beginning of the SILAR cycle for the formation of AgNPs, A2- end of SILAR-synthesis cycles for the AgNPs formation, A3- end of the synthesis cycles for AuNPs formation. B- Scheme of the two-stage SILAR fabrication procedures of Ag@AuNPs on the cellulose substrate (Adopted from Wansun Kim et al 28). C1 and C2 correspond to the chemical equations equivalent to reactions in
the paper fibers when the nanoparticles are synthesized.
3.2.1 Optimization of SILAR-synthesized Ag@AuNPs on Whatman paper no 1
At first, the Ag core were synthesized directly on the paper strip, according to the previous optimized SILAR conditions- 6 cycles of 20/20 mM of AgNO3/NaBH428- as this is a method of
ionic adsorption and reaction, by increasing the number of SILAR cycles performed will also increase the diameter of the formed AgNPs until they fuse and form a thin film of silver45.
The same phenomenon happens during Au shell formation, ionically deposited in the AgNPs core. In previous studies have shown an optimized SILAR conditions and concentrations of 6
A1
A2
A3
C.1
C.2
14
( b) cycles of 10/10 mM of HAuCl4/NaBH4, which in fact increased SERS efficiency by increasing
the number of cycles (Appendix C, Figure C1). However, comparing the bimetallic nanoparticles to the Ag monometallic ones, the latter presents a superior SERS effect, showing that this effect was likely to be induced by only gold nanostructure rather than bimetallic nanostructure possibly due to the AuNPs diameter could be twice as large as AgNPs, even though the concentration of HAuCl4 ions (10 mM) is half the concentration of AgNO3 ions (20 mM)28.
So, a new SILAR concentration was chosen, 1/1 mM of HAuCl4/NaBH4, in order to minimize the
influence of gold and prevent the silver from being completely covered by gold nanofeatures (Figure 3.5).
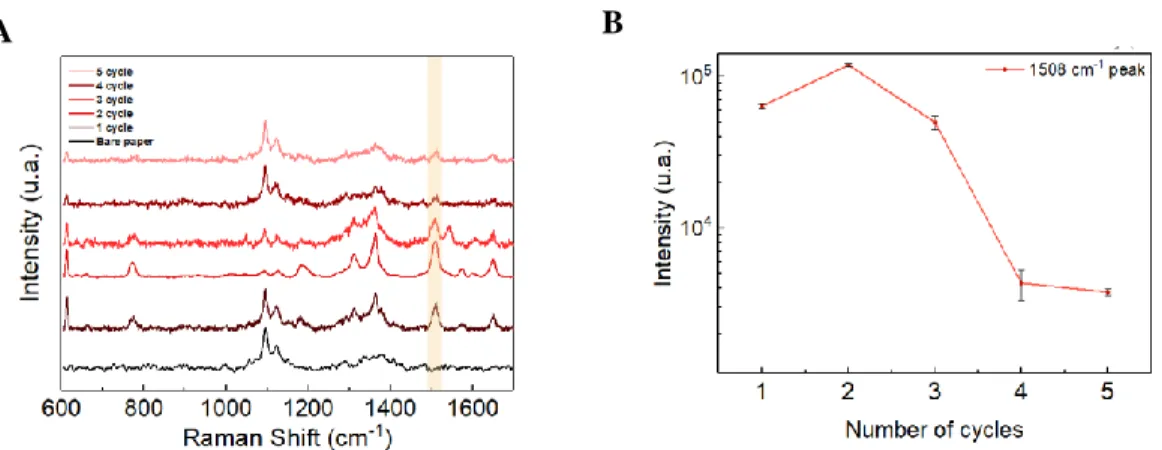
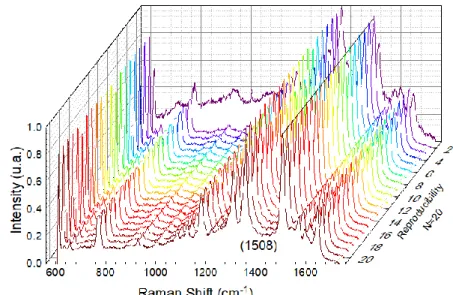
Figure 3.5 - Raman spectra and (B) intensities of 1 mM R6G characterized peak at 1508 cm–1 with the
number of SILAR cycles for decorating the shell AuNPs on the core AgNPs. The number of cycles and their intensities is plotted on the log scale because the intensity values of 4 to 5 cycles are very close to zero.
A droplet of 10-6 M of Rhodamine (R6G) molecule was used to evaluate the SERS activity,
since this is a widely studied dye in this area, easy to interpret and presents well defined characteristic peaks. The characteristic peak of R6G chosen for the study was 1508 cm-1 instead
of 1363 cm-1, although the latter shows higher intensities, also presents a greater contribution of
the cellulose, which may inference with the measurements. The same conditions were used in all measurements (15 secs of exposure time, 5% of laser power and 5 accumulations), in order to guarantee a reliable comparison (Figure 3.5). Also, the 633 nm laser was used due to being closer to the gold SPR peak, resulting in higher plasmonic activity. Although the substrate contains silver and gold, when using the 532 nm laser, fluorescence phenomenon was verified, often resulting in signal saturation. The Raman peak of R6G continued to increase until two SILAR cycles, then it decreases slightly until the 3 cycles and greatly decreased for 4 and 5 cycles (Figure 3.5-B). Which is in agreement with the findings already made, with the increase of the number of gold SILAR-cycles, the particle size will also increase, eventually covering the entire silver core and the Ag cease to be the major contributor to the signal. The two SILAR cycles were selected as an optimal condition for decorating the shell AuNPs on the core AgNPs.
As an outcome, the bimetallic nanoparticles (Ag@AuNPs) produced by the SILAR process compared to the monometallic ones (AgNPs and AuNPs) produced by the same method demonstrate an incredible SERS effect (Figure 3.6-A). The substrates were maintained under the same laboratory conditions (away from light and kept in the fridge) and tested 30 days after the synthesis. The SERS activity of AgNPs paper showed a 75% degradation (assessment based on peak area and intensity under investigation), while that of Ag@AuNPs paper showed less than 10% degradation (Figure 3.6-B), indicating that the AgNPs suffered a greater oxidation, thus
15
proving the stabilizing power of the gold over the bimetallic nanoparticles, leading to a moderate anti-oxidation effect.
Figure 3.6 - Raman spectra of 10-6 M R6G with bare paper and AgNPs, AuNPs and Ag@AuNPs on paper
right after the synthesis; (B) Raman spectra of 10-6 M with Ag@AuNPs and AgNPs on paper 30 days after the
synthesis.
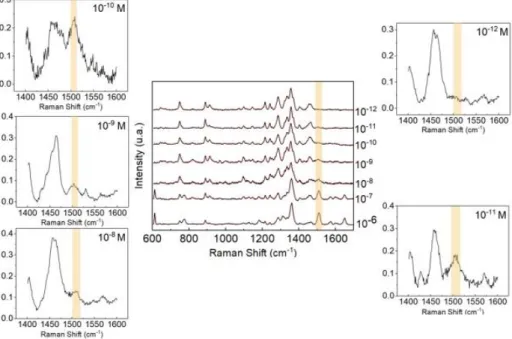
Once synthesis is optimized in Whatman paper, it was tested the sensitivity of the substrate containing bimetallic nanoparticles. Small squares of the substrate were cut with 5 x 5 mm each side, 2 µl of R6G was used and 3 points were randomly chosen for data collection. The mean spectra is represented in the Figure 3.6. Different R6G concentrations were tested, the highest of 10-6 and the lowest of 10-12 M, the peak intensity rapidly decrease with the lowering of the R6G
concentration, showing that the limit of detection (LOD) achieved was 10-11 M (Figure 3.7),
contrary to what was reported by Wansun Kim, et. al28 which his team was able to detect
concentrations of 10-15 M. The peaks associated with 10-8 M and 10-9 M (Left) are smaller than
expected and may be associated with the degradation of these solutions.
Figure 3.7 - Three measurement average of rhodamine SERS spectra on the optimized SILAR-synthesised Ag@AuNPs whatman nº1 substrate with different concentrations. (Left) zoom of the 1508 cm-1 peak range for
10-8 M, 10-9 M and 10-10 M. (Right) zoom of the 1508 cm-1 peak range for 10-11 M and 10-12 M.
16
The enhancement factor (EF) was calculated using the equation (1.1). For this, spectra were compared using different R6G concentrations: 10-2 M measured on a glass and 10-6 M measured
on the substrate. (Appendix C Figure C2). NRAMAN and NSERS were substituted for the R6G
concentrations: 10-2 and 10-6 M, respectively. I
RAMAN and ISERS were replaced by the peak area
corresponding to the 1508 cm-1 band, measured on the glass and on the optimized substrate,
respectively. The peak area was used to obtain a more real EF value. The obtained EF was 3.5 × 10⁴.
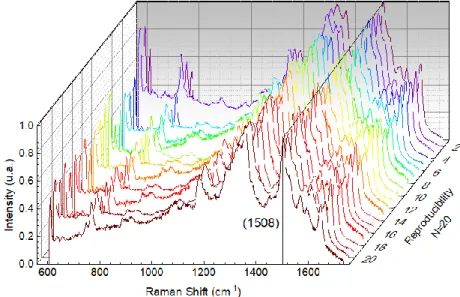
As the optimized substrate found, homogeneity tests were performed with R6G 10-6 M.
Twenty measurements were made between the same substrate and different samples of the same substrate at random points, also the measurement conditions were kept and the results are presented in Figure 3.8.
Figure 3.8 - Homogeneity tests of Whatman n.1 SERS substrate with Ag@AuNPs.
The line indicates the peak under study (1508 cm-1). Although not very consistent, at almost
all points the spectrum obtained shows well-defined peaks while the intensity is not constant indicating that the paper may not be evenly coated with nanoparticles.
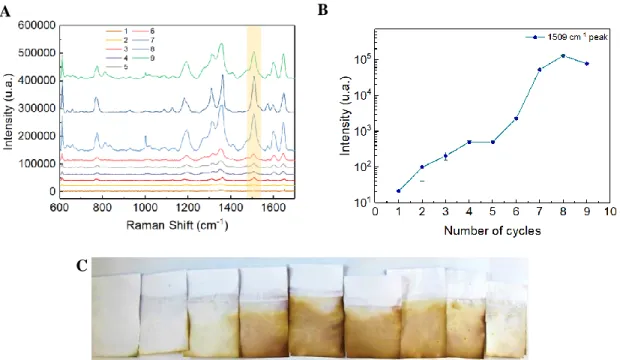
3.2.2 Optimization of SILAR-synthesized Ag@AuNPs on office paper
The same SILAR-synthesis tested inWhatman nº1 was also tested in the office paper. The EF obtained was found to be 9.2 × 10⁴, higher than that obtained with whatman paper, while the limit of detection (LOD) remained the same, 10-11 M. In this office substrate with Ag@AuNPs
SILAR-synthesized, biological tests were performed between tumoral exosomes and PBS (control) and tested with PCA, which was not effective because the of the 95% confidence ellipses overlapped. It was concluded, that this poor result was due to the great contribution of the cellulose that overlapped the characteristic peaks of the biological samples, leading to the need to create a substrate, with more NPs on the surface, increasing its SERS efficiency and decrease of cellulose contribution.
Other synthesis conditions were tested on this paper. Since this is a synthesis of successive ionic layer adsorption and reaction which is a layer-by-layer deposition of oppositely charged, positive and negative, ions of two salts: metal salt (AgNO3 and HAuCL4) and reducing salt